概述
本策略是一个基于多重蜡烛图形识别的交易系统,主要聚焦于识别四种经典的蜡烛图形:看涨吞没、看跌吞没、锤子线和流星线。策略通过分析连续的蜡烛图形来识别潜在的市场反转点,并在识别到特定图形时自动执行买入或卖出操作。该策略的核心在于利用蜡烛图形所反映的市场情绪和力量对比,来预测短期价格走势,从而捕捉交易机会。
策略原理
看涨吞没:由两根蜡烛组成,第一根为阴线(收盘价低于开盘价),第二根为较大的阳线(收盘价高于开盘价),且第二根蜡烛的实体完全覆盖了第一根蜡烛的实体。这种形态通常被认为是潜在的反转信号,表明多头力量正在增强。
看跌吞没:与看涨吞没相反,由一根阳线后跟一根较大的阴线组成,第二根蜡烛的实体完全覆盖了第一根蜡烛的实体。这种形态可能预示着空头力量的增强和潜在的下跌趋势。
锤子线:单根蜡烛形态,特征是有一个小实体位于交易区间的上端,下影线长度至少为实体长度的两倍,上影线很短或不存在。这种形态通常出现在下跌趋势的底部,可能预示着反转。
流星线:单根蜡烛形态,与锤子线相反,特征是小实体位于交易区间的下端,上影线长度较长,下影线很短或不存在。这种形态通常出现在上涨趋势的顶部,可能预示着即将下跌。
策略通过定义这些蜡烛图形的数学条件来识别它们的出现。当识别到特定图形时,策略会根据图形的类型执行相应的交易操作:看涨吞没和锤子线触发买入信号,看跌吞没和流星线触发卖出信号。
策略优势
多样化的信号源:通过同时监控多种蜡烛图形,策略能够捕捉到不同类型的市场反转信号,增加了交易机会。
视觉直观:蜡烛图形在图表上清晰可见,便于交易者直观理解市场动态和策略逻辑。
灵活性:策略允许用户选择特定的蜡烛图形进行交易,可以根据个人偏好或市场条件进行调整。
自动化执行:一旦识别到符合条件的蜡烛图形,策略会自动执行交易,减少了人为干预和情绪因素的影响。
风险管理:通过设置初始资金和每次交易使用资金的百分比,策略内置了基本的风险管理机制。
策略风险
假信号风险:蜡烛图形可能会产生假信号,特别是在波动较大的市场中。单纯依赖图形识别可能导致频繁的错误交易。
缺乏趋势考虑:策略主要关注短期反转信号,没有考虑更大的市场趋势,可能导致逆势交易。
时间框架局限性:策略在单一时间框架上运行,可能忽视了其他时间框架的重要信息。
缺乏止损机制:当前策略没有明确的止损策略,可能导致在不利行情中承受过大损失。
过度交易风险:频繁的信号可能导致过度交易,增加交易成本并可能降低整体收益。
策略优化方向
整合趋势指标:引入移动平均线或其他趋势指标,以确保交易方向与主要趋势一致,减少逆势交易。
多时间框架分析:结合更长和更短的时间框架信息,提高信号的可靠性和交易决策的准确性。
引入止损和止盈机制:设置合理的止损和止盈水平,以更好地控制风险和锁定利润。
信号确认机制:增加额外的确认条件,如成交量分析或其他技术指标,以减少假信号。
优化入场时机:考虑在图形形成后的下一根蜡烛开盘时入场,以获得更好的执行价格。
动态调整交易规模:根据市场波动性和账户净值变化动态调整每次交易的资金比例。
增加过滤条件:设置最小波动幅度或时间间隔条件,以避免在横盘市场中过度交易。
总结
多重蜡烛图形识别与交易策略是一种基于经典技术分析的自动化交易系统。通过识别看涨吞没、看跌吞没、锤子线和流星线等蜡烛图形,策略旨在捕捉潜在的市场反转点并执行相应的交易。该策略的优势在于其多样化的信号源、直观的视觉表现和自动化执行能力。然而,它也面临假信号、缺乏趋势考虑和风险管理不足等挑战。
通过整合趋势指标、多时间框架分析、完善风险管理机制和引入额外的信号确认方法,该策略有潜力得到显著改进。这些优化措施可以提高策略的稳健性和盈利能力,使其更适应不同的市场条件。
总的来说,这个策略为交易者提供了一个自动化的技术分析框架,但应该被视为更全面交易系统的一部分,而不是单独使用。结合其他分析工具和风险管理技术,这个策略可以成为一个有效的交易决策辅助工具。
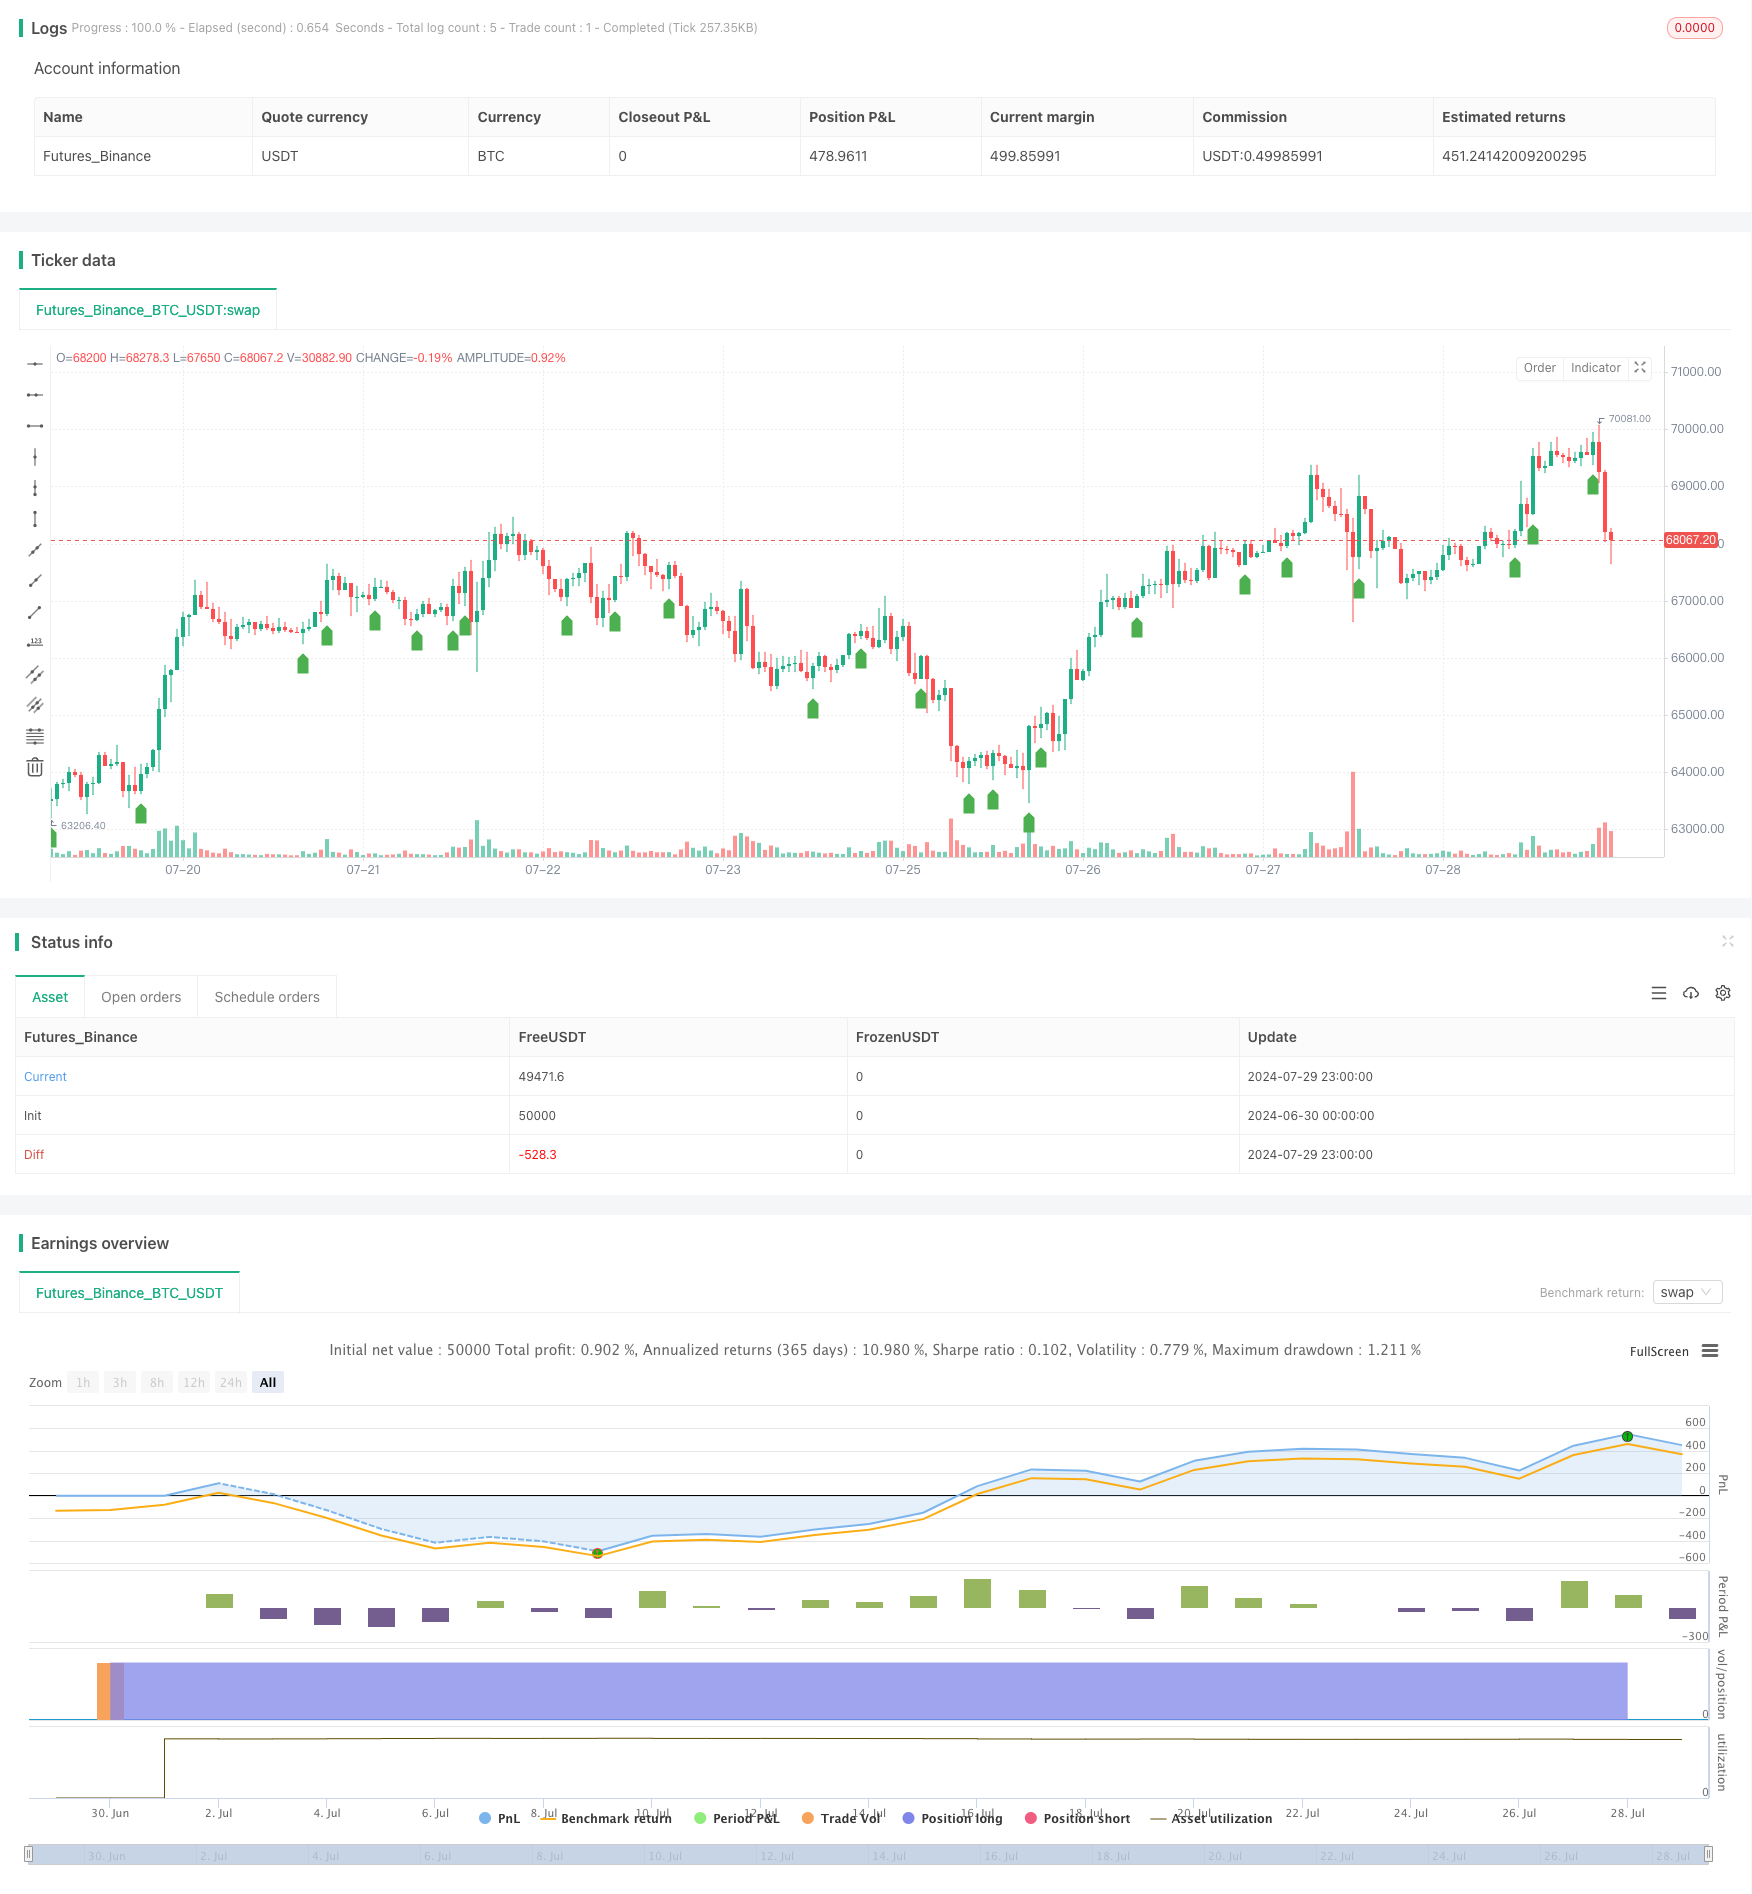
/*backtest
start: 2024-06-30 00:00:00
end: 2024-07-30 00:00:00
period: 1h
basePeriod: 15m
exchanges: [{"eid":"Futures_Binance","currency":"BTC_USDT"}]
*/

//@version=5
strategy("Crude Oil Candlestick Pattern Strategy", overlay=true, initial_capital=10000, default_qty_type=strategy.percent_of_equity, default_qty_value=10)

// Input parameters
pattern = input.string("Bullish Engulfing", title="Candlestick Pattern", options=["Bullish Engulfing", "Bearish Engulfing", "Hammer", "Shooting Star"])

// Define candlestick patterns
bullishEngulfing = close[1] < open[1] and close > open and open <= close[1] and close >= open[1]
bearishEngulfing = close[1] > open[1] and close < open and open >= close[1] and open <= open[1]
hammer = close > open and (low == close or low == open)
shootingStar = close < open and (high == close or high == open)

// Condition for bullish engulfing pattern
bullishSignal = pattern == "Bullish Engulfing" and bullishEngulfing

// Condition for bearish engulfing pattern
bearishSignal = pattern == "Bearish Engulfing" and bearishEngulfing

// Condition for hammer pattern
hammerSignal = pattern == "Hammer" and hammer

// Condition for shooting star pattern
shootingStarSignal = pattern == "Shooting Star" and shootingStar

// Execute buy and sell orders based on selected pattern
if (bullishSignal)
    strategy.entry("Buy", strategy.long)
if (bearishSignal)
    strategy.entry("Sell", strategy.short)
if (hammerSignal)
    strategy.entry("Buy", strategy.long)
if (shootingStarSignal)
    strategy.entry("Sell", strategy.short)

// Plot candlestick patterns on the chart
plotshape(series=bullishSignal, location=location.belowbar, color=color.green, style=shape.labelup, title="Bullish Engulfing")
plotshape(series=bearishSignal, location=location.abovebar, color=color.red, style=shape.labeldown, title="Bearish Engulfing")
plotshape(series=hammerSignal, location=location.belowbar, color=color.blue, style=shape.labelup, title="Hammer")
plotshape(series=shootingStarSignal, location=location.abovebar, color=color.orange, style=shape.labeldown, title="Shooting Star")