概述
本策略是一个结合了多个技术指标和高级马尔可夫模型的交易策略。它利用移动平均线(MA)、相对强弱指标(RSI)和波动率指标来定义市场状态,然后使用马尔可夫模型来模拟市场状态之间的转换,从而生成交易信号。这种方法旨在捕捉市场趋势和反转,同时考虑市场波动性,以实现更稳健的交易决策。
策略原理
技术指标:
- 移动平均线(MA): 使用短期(10周期)和长期(50周期)简单移动平均线来识别潜在的牛市和熊市状态。
- 相对强弱指标(RSI): 计算14周期的RSI,超买和超卖水平分别设置为70和30。RSI与移动平均线结合使用,用于定义牛市和熊市状态。
- 波动率: 使用20周期收盘价的标准差作为波动率指标。根据波动率是否高于1.5的阈值来定义高波动和低波动状态。
马尔可夫模型: 策略使用简化的马尔可夫模型来模拟市场状态之间的转换。转换概率是预定义的,应根据模型分析进行调整。模型根据当前状态和下一个状态生成进入多头、空头或中性仓位的交易信号。
交易信号生成:
- 牛市状态(nextState == 1): 进入多头仓位。
- 熊市状态(nextState == 2): 平掉任何开放的多头仓位,进入空头仓位。
- 中性状态: 平掉任何开放的多头或空头仓位。
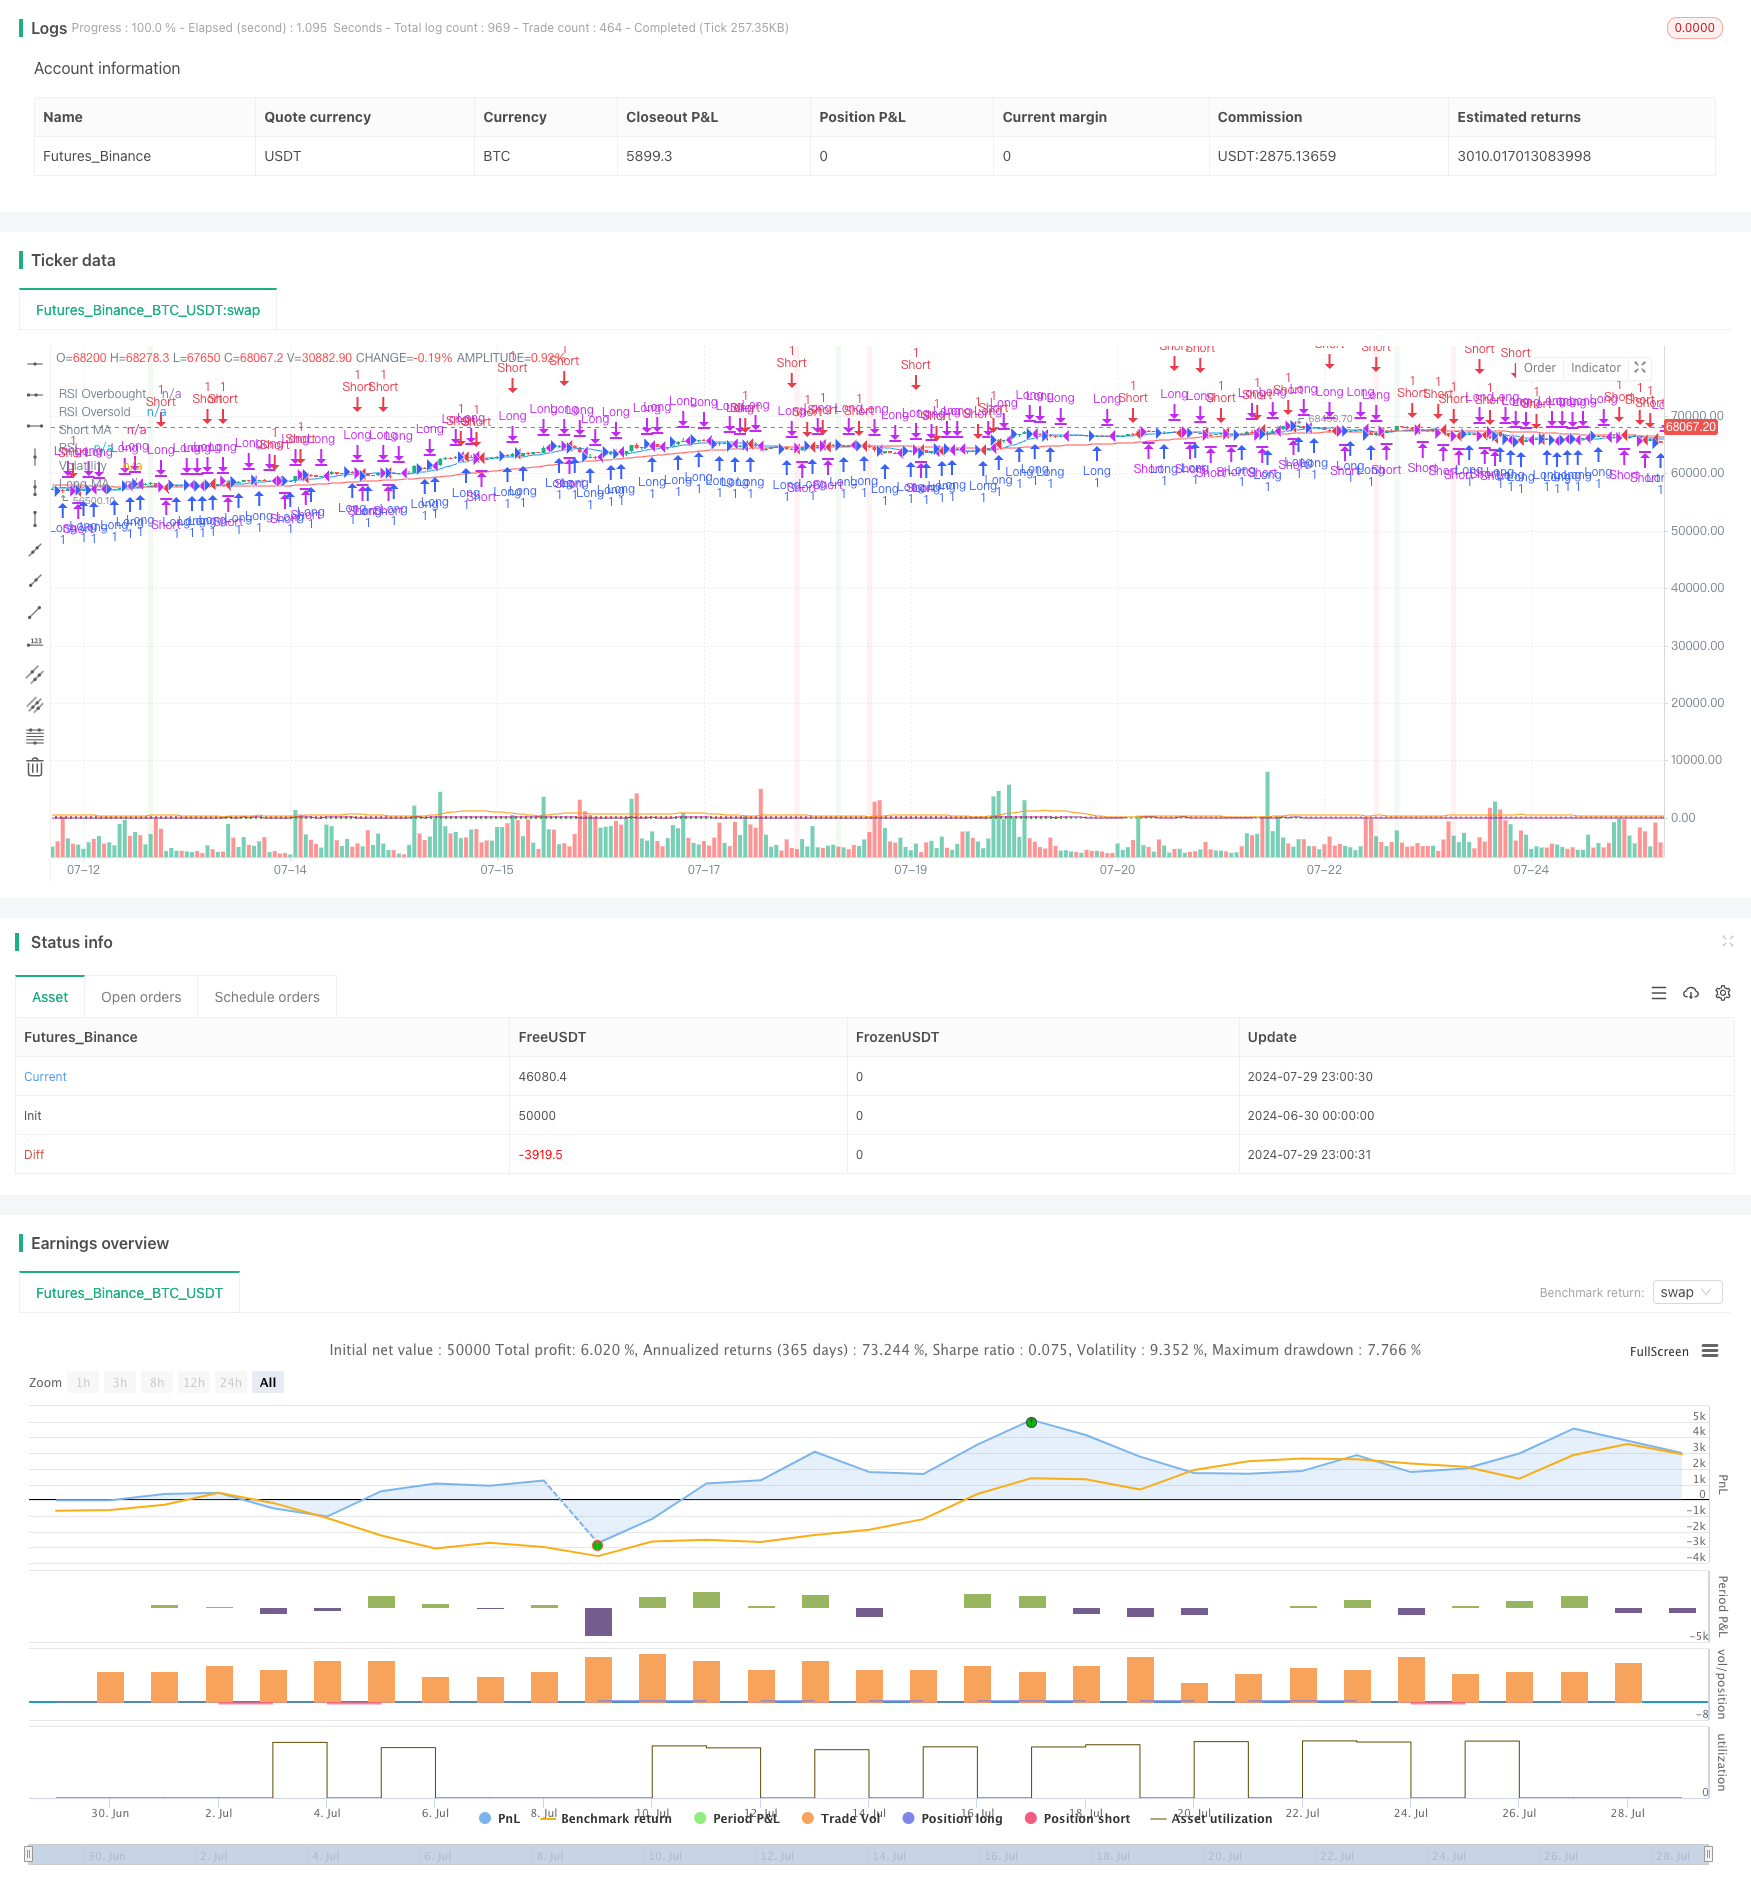
可视化: 策略绘制短期和长期移动平均线、RSI和波动率。图表的背景颜色根据当前市场状态(牛市、熊市或中性)而变化。
策略优势
多指标融合: 通过结合多个技术指标(MA、RSI和波动率),策略能够全面评估市场状况,降低单一指标可能带来的误判风险。
动态市场状态识别: 使用马尔可夫模型动态模拟市场状态转换,使策略能够更好地适应不同的市场环境。
考虑市场波动性: 将波动率纳入决策过程,有助于在高波动期间调整交易策略,降低风险。
灵活的仓位管理: 策略能够根据市场状态灵活进入多头、空头或中性仓位,适应不同的市场趋势。
可视化支持: 通过绘制关键指标和使用背景颜色表示市场状态,为交易决策提供直观的视觉支持。
策略风险
参数敏感性: 策略依赖于多个预设参数(如MA周期、RSI阈值等),这些参数的选择可能显著影响策略性能。不当的参数设置可能导致过度交易或错失重要机会。
市场状态误判: 尽管使用多个指标,但在某些市场条件下,策略仍可能误判市场状态,导致不适当的交易决策。
模型简化风险: 当前的马尔可夫模型是简化的,可能无法完全捕捉复杂的市场动态,特别是在快速变化或高度不确定的市场环境中。
滞后性: 基于历史数据的技术指标可能存在滞后性,在快速变化的市场中可能无法及时捕捉转折点。
过度依赖技术分析: 策略主要基于技术指标,忽视了基本面因素,可能在某些市场环境下表现不佳。
策略优化方向
动态参数调整: 实现参数的动态优化机制,根据不同的市场环境自动调整MA周期、RSI阈值和波动率阈值等参数。
改进马尔可夫模型: 采用更复杂的马尔可夫模型,如隐马尔可夫模型(HMM),以更好地捕捉市场状态转换的复杂性。
整合机器学习: 引入机器学习算法,如支持向量机(SVM)或随机森林,来优化市场状态的识别和预测。
加入基本面分析: 结合基本面指标,如宏观经济数据或公司财务指标,以提供更全面的市场分析。
风险管理增强: 实现更复杂的风险管理机制,如动态止损和利润目标设置,以更好地控制每笔交易的风险。
多时间框架分析: 引入多时间框架分析,结合不同时间尺度的市场信息,以提高交易决策的准确性。
波动率预测: 开发波动率预测模型,以更准确地anticipate高波动期,从而优化交易时机和仓位大小。
总结
高级马尔可夫模型技术指标融合交易策略通过结合多个技术指标和马尔可夫模型,提供了一个全面的市场分析和交易决策框架。该策略的主要优势在于其动态市场状态识别能力和对波动性的考虑,使其能够适应不同的市场环境。然而,策略也面临参数敏感性和模型简化等风险。
通过实施建议的优化措施,如动态参数调整、改进马尔可夫模型和整合机器学习技术,策略有潜力进一步提高其性能和稳健性。特别是,加入基本面分析和多时间框架分析可以提供更全面的市场视角,而增强的风险管理机制则可以更好地控制交易风险。
总的来说,这个策略为量化交易提供了一个坚实的基础,具有显著的优化和扩展潜力。通过持续的研究和改进,它有望成为一个强大而灵活的交易工具,能够在各种市场条件下产生稳定的收益。
/*backtest
start: 2024-06-30 00:00:00
end: 2024-07-30 00:00:00
period: 1h
basePeriod: 15m
exchanges: [{"eid":"Futures_Binance","currency":"BTC_USDT"}]
*/

//@version=5
strategy("Advanced Markov Model Trading Strategy", overlay=true)

// Parameters for defining market states
shortMA = input(10, title="Short MA Length")
longMA = input(50, title="Long MA Length")
rsiPeriod = input(14, title="RSI Period")
rsiOverbought = input(70, title="RSI Overbought Level")
rsiOversold = input(30, title="RSI Oversold Level")
volatilityLength = input(20, title="Volatility Length")
volatilityThreshold = input(1.5, title="Volatility Threshold")

// Calculating technical indicators
shortMovingAverage = ta.sma(close, shortMA)
longMovingAverage = ta.sma(close, longMA)
rsi = ta.rsi(close, rsiPeriod)
volatility = ta.stdev(close, volatilityLength)

// Defining market states based on indicators
bullish = ta.crossover(shortMovingAverage, longMovingAverage) and rsi < rsiOverbought
bearish = ta.crossunder(shortMovingAverage, longMovingAverage) and rsi > rsiOversold
neutral = not bullish and not bearish

// Advanced market state definitions based on volatility
highVolatility = volatility > volatilityThreshold
lowVolatility = not highVolatility

// Transition probabilities (simplified due to script limitations)
var float bullishToBearishProb = 0.2
var float bearishToBullishProb = 0.3
var float bullishToNeutralProb = 0.5
var float bearishToNeutralProb = 0.4
var float neutralToBullishProb = 0.3
var float neutralToBearishProb = 0.2

// Declare nextState and currentState variables
var int nextState = na
var int currentState = na

// Simulated Markov transition (this is a simplification)
var float entryPrice = na
if bullish
    currentState := 1
    if math.random() < bullishToBearishProb
        nextState := 2
    else if math.random() < bullishToNeutralProb
        nextState := 3
    else
        nextState := 1
else if bearish
    currentState := 2
    if math.random() < bearishToBullishProb
        nextState := 1
    else if math.random() < bearishToNeutralProb
        nextState := 3
    else
        nextState := 2
else
    currentState := 3
    if math.random() < neutralToBullishProb
        nextState := 1
    else if math.random() < neutralToBearishProb
        nextState := 2
    else
        nextState := 3

// Trading signals based on state transitions
if nextState == 1  // Bullish
    if na(entryPrice)
        entryPrice := close
    strategy.entry("Long", strategy.long)
else if nextState == 2  // Bearish
    if not na(entryPrice)
        strategy.close("Long")
        entryPrice := na
    strategy.entry("Short", strategy.short)
else  // Neutral
    strategy.close("Long")
    strategy.close("Short")
    entryPrice := na

// Plotting
plot(shortMovingAverage, color=color.blue, linewidth=1, title="Short MA")
plot(longMovingAverage, color=color.red, linewidth=1, title="Long MA")
hline(rsiOverbought, "RSI Overbought", color=color.red, linestyle=hline.style_dotted)
hline(rsiOversold, "RSI Oversold", color=color.green, linestyle=hline.style_dotted)
plot(rsi, color=color.purple, linewidth=1, title="RSI")
plot(volatility, color=color.orange, linewidth=1, title="Volatility")

// Background color based on market states
bgcolor(currentState == 1 ? color.new(color.green, 90) : na, title="Bullish")
bgcolor(currentState == 2 ? color.new(color.red, 90) : na, title="Bearish")