概述
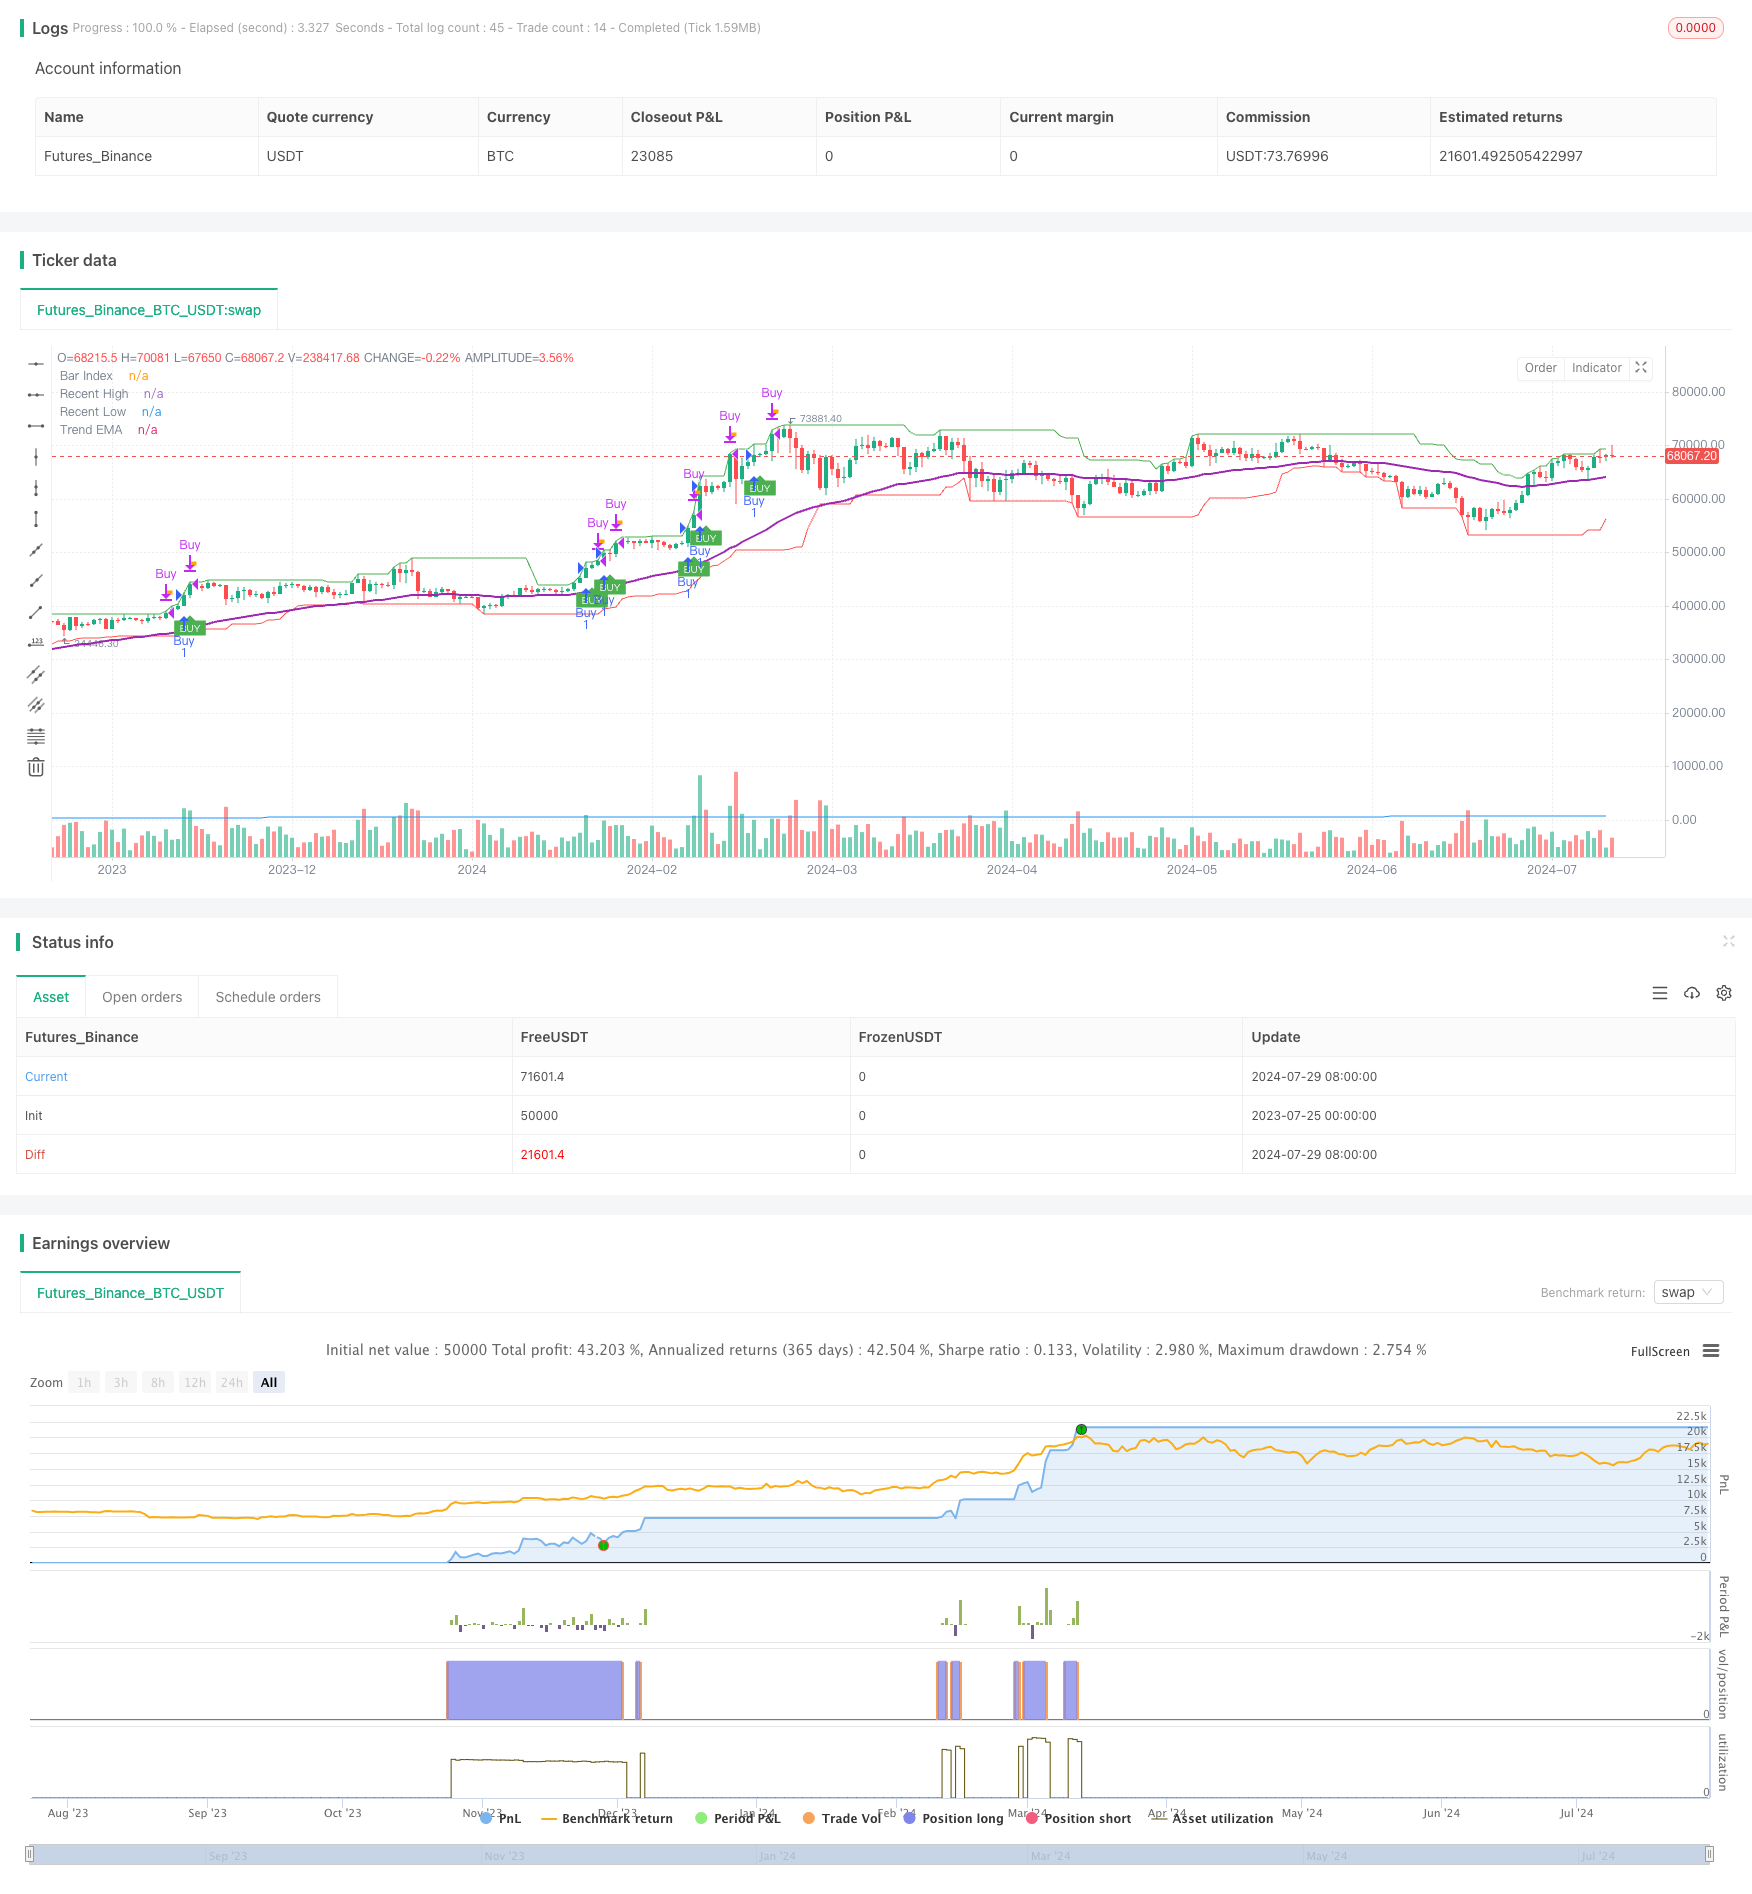
动态趋势追踪与精准止盈止损策略是一个基于价格动量和趋势的短期交易系统。该策略利用指数移动平均线(EMA)作为动态趋势过滤器,结合价格行为模式和真实波幅(ATR)来识别潜在的交易机会。策略的核心在于其精确的入场信号生成机制,以及动态设置的止盈(TP)和止损(SL)水平,旨在最大化盈利潜力同时有效控制风险。
策略原理
趋势识别:使用50周期EMA作为动态趋势过滤器。只有当价格位于EMA之上时才考虑做多,反之则考虑做空。这确保了交易方向与整体趋势保持一致。
入场信号:策略通过分析连续三根蜡烛线的价格行为来确定入场时机。具体而言,它寻找以下模式:
- 做多:连续三根阳线,且每根阳线的实体都大于前一根,收盘价逐根上升。
- 做空:连续三根阴线,且每根阴线的实体都大于前一根,收盘价逐根下降。
波动性确认:使用真实波幅(ATR)的变种来确保只在波动性充足时入场。这有助于避免在市场过于平静时进行交易。
动态止盈:入场后,策略会根据最近的高点(做多)或低点(做空)设置止盈目标。这种方法允许在强劲趋势中获得更多利润。
自适应止损:止损位置设定在最近的低点(做多)或高点(做空),提供了针对市场结构的动态保护。
实时执行:策略在每根蜡烛线收盘时评估市场条件,确保决策基于最新的市场数据。
策略优势
趋势对齐:通过EMA过滤器确保交易方向与主要趋势一致,提高了盈利概率。
精确入场:严格的入场条件(连续的价格动量和波动性确认)有助于减少虚假信号,提高交易质量。
动态风险管理:自适应的止盈和止损机制使策略能够根据市场结构灵活调整,在保护资金的同时不会过早限制利润。
波动性利用:通过ATR变种确保只在市场提供足够交易机会时入场,避免在低波动期过度交易。
多时间框架适应性:策略的参数可以根据不同的交易品种和时间框架进行调整,提供了广泛的应用可能性。
可视化反馈:通过清晰的图表标记(包括买卖信号、止盈和止损触发),为交易者提供直观的市场洞察。
策略风险
假突破风险:在横盘市场中,策略可能会误解短期波动为趋势开始,导致不必要的交易。
滑点影响:在快速移动的市场中,实际执行价格可能与信号生成时的价格有显著差异。
过度交易:在高波动性时期,策略可能生成过多信号,增加交易成本。
趋势反转延迟:依赖EMA可能导致在趋势反转初期错过机会或承受不必要的损失。
参数敏感性:策略性能可能对输入参数(如EMA周期、ATR倍数)高度敏感,需要仔细优化。
为降低这些风险,可以考虑以下措施: - 实施额外的市场结构分析,以区分真实突破和假突破。 - 使用限价单而非市价单来控制滑点。 - 引入冷却期或每日交易限制以防止过度交易。 - 结合更敏感的趋势指标来提高趋势反转的响应速度。 - 进行彻底的回测和前向测试,以找到稳健的参数设置。
策略优化方向
多重时间框架分析:整合更高时间框架的趋势信息可以提高入场决策的准确性。例如,可以添加日线EMA作为额外的趋势过滤器。
改进趋势识别:考虑使用更复杂的趋势指标,如Directional Movement Index (DMI)或Parabolic SAR,以提供更准确的趋势识别。
优化止盈机制:实现跟踪止盈,允许在强势趋势中持有头寸更长时间。可以考虑使用ATR的倍数来动态调整止盈水平。
细化入场条件:加入成交量确认或其他技术指标(如RSI或MACD)来验证价格动量,减少假信号。
风险管理增强:实现基于账户规模的头寸规模调整,确保每笔交易的风险一致。考虑使用目标风险回报比来优化交易决策。
市场环境适应:开发一个市场环境分类系统(如趋势、范围、高/低波动性),并根据不同的市场状态调整策略参数。
机器学习整合:使用机器学习算法来优化参数选择或预测最佳入场/出场时机,提高策略的适应性。
这些优化方向旨在提高策略的稳健性,减少假信号,并在不同市场条件下保持其有效性。实施任何优化时,都应进行全面的回测和前向测试,以确保改进确实带来了性能提升。
总结
动态趋势追踪与精准止盈止损策略是一个精心设计的短期交易系统,结合了趋势跟踪、动量交易和精确的风险管理技术。通过EMA趋势过滤、严格的入场条件和动态的止盈止损机制,该策略旨在捕捉市场的短期动量机会,同时保护交易资金免受过度风险。
策略的主要优势在于其对市场结构的适应性和精确的风险控制,使其有潜力在各种市场环境中保持稳定性能。然而,像所有交易策略一样,它也面临着一些固有风险,如假突破和参数敏感性。
通过持续优化和改进,特别是在多时间框架分析、高级趋势识别和机器学习应用等方面,该策略有潜力进一步提高其性能和适应性。对于寻求在短期交易中平衡机会把握和风险管理的交易者来说,这个策略提供了一个坚实的基础框架。
最后,重要的是要记住,没有一个策略是完美的或适用于所有市场条件。成功的应用需要持续的监控、测试和调整,以及对个人风险承受能力和交易目标的深刻理解。
/*backtest
start: 2023-07-25 00:00:00
end: 2024-07-30 00:00:00
period: 1d
basePeriod: 1h
exchanges: [{"eid":"Futures_Binance","currency":"BTC_USDT"}]
*/

//@version=5
strategy("Scalp Slayer (i)", overlay=true)

// Input Parameters
filterNumber = input.float(1.5, "Filter Number", minval=1.0, maxval=10.0, tooltip="Higher = More aggressive Filter, Lower = Less aggressive")
emaTrendPeriod = input.int(50, "EMA Trend Period", minval=1, tooltip="Period for the EMA used for trend filtering")
lookbackPeriod = input.int(20, "Lookback Period for Highs/Lows", minval=1, tooltip="Period for determining recent highs/lows")
colorTP = input.color(title='Take Profit Color', defval=color.orange)
colorSL = input.color(title='Stop Loss Color', defval=color.red)  // Added color for Stop Loss

// Inputs for visibility
showBuyLabels = input.bool(true, title="Show Buy Labels")
showSellLabels = input.bool(true, title="Show Sell Labels")
showStrategy = input.bool(true, title="Show Strategy", tooltip="Enable for strategy testing")

// Calculations
tr = high - low
ema = filterNumber * ta.ema(tr, 50)
trendEma = ta.ema(close, emaTrendPeriod)  // Calculate the EMA for the trend filter

// Ensure calculations are based on historical data only
recentHigh = ta.highest(high, lookbackPeriod)
recentLow = ta.lowest(low, lookbackPeriod)

// Variables to track the entry prices for profit target and stop-loss
var float entryPriceLong = na
var float entryPriceShort = na
var float targetPriceLong = na
var float targetPriceShort = na
var float stopLossLong = na
var float stopLossShort = na

// Buy and Sell Conditions with Trend Filter
buy = close > trendEma and  // Buy only if above the trend EMA
      close[2] > open[2] and close[1] > open[1] and close > open and
      (math.abs(close[2] - open[2]) > math.abs(close[1] - open[1])) and
      (math.abs(close - open) > math.abs(close[1] - open[1])) and
      close > close[1] and close[1] > close[2] and tr > ema

sell = close < trendEma and  // Sell only if below the trend EMA
       close[2] < open[2] and close[1] < open[1] and close < open and
       (math.abs(close[2] - open[2]) > math.abs(close[1] - open[1])) and
       (math.abs(close - open) > math.abs(close[1] - open[1])) and
       close < close[1] and close[1] < close[2] and tr > ema

// Entry Rules
if (buy and barstate.isconfirmed)  // Check for buy condition on candle close
    if (showStrategy)
        strategy.entry("Buy", strategy.long, comment="Buy at Close")
    entryPriceLong := close  // Track entry price for long position
    targetPriceLong := recentHigh  // Set take profit target to recent high
    stopLossLong := recentLow  // Set stop-loss to recent low

if (sell and barstate.isconfirmed)  // Check for sell condition on candle close
    if (showStrategy)
        strategy.entry("Sell", strategy.short, comment="Sell at Close")
    entryPriceShort := close  // Track entry price for short position
    targetPriceShort := recentLow  // Set take profit target to recent low
    stopLossShort := recentHigh  // Set stop-loss to recent high

// Take Profit and Stop Loss Logic
signalBuyTPPrint = (not na(entryPriceLong) and close >= targetPriceLong)
signalSellTPPrint = (not na(entryPriceShort) and close <= targetPriceShort)

signalBuySLPrint = (not na(entryPriceLong) and close <= stopLossLong)
signalSellSLPrint = (not na(entryPriceShort) and close >= stopLossShort)

if (signalBuyTPPrint)
    if (showStrategy)
        strategy.close("Buy", comment="Close Buy at Profit Target")
    entryPriceLong := na  // Reset entry price for long position
    targetPriceLong := na  // Reset target price for long position
    stopLossLong := na  // Reset stop-loss for long position

if (signalSellTPPrint)
    if (showStrategy)
        strategy.close("Sell", comment="Close Sell at Profit Target")
    entryPriceShort := na  // Reset entry price for short position
    targetPriceShort := na  // Reset target price for short position
    stopLossShort := na  // Reset stop-loss for short position

if (signalBuySLPrint)
    if (showStrategy)
        strategy.close("Buy", comment="Close Buy at Stop Loss")
    entryPriceLong := na  // Reset entry price for long position
    targetPriceLong := na  // Reset target price for long position
    stopLossLong := na  // Reset stop-loss for long position

if (signalSellSLPrint)
    if (showStrategy)
        strategy.close("Sell", comment="Close Sell at Stop Loss")
    entryPriceShort := na  // Reset entry price for short position
    targetPriceShort := na  // Reset target price for short position
    stopLossShort := na  // Reset stop-loss for short position

// Plot Buy and Sell Labels with Visibility Conditions
plotshape(showBuyLabels and buy, "Buy", shape.labelup, location=location.belowbar, color=color.green, text="BUY", textcolor=color.white, size=size.tiny, offset=1)
plotshape(showSellLabels and sell, "Sell", shape.labeldown, location=location.abovebar, color=color.red, text="SELL", textcolor=color.white, size=size.tiny, offset=1)

// Plot Take Profit Flags
plotshape(showBuyLabels and signalBuyTPPrint, title="Take Profit (buys)", text="TP", style=shape.flag, location=location.abovebar, color=colorTP, textcolor=color.white, size=size.tiny)
plotshape(showSellLabels and signalSellTPPrint, title="Take Profit (sells)", text="TP", style=shape.flag, location=location.belowbar, color=colorTP, textcolor=color.white, size=size.tiny)

// Plot Stop Loss "X" Marker
plotshape(showBuyLabels and signalBuySLPrint, title="Stop Loss (buys)", text="X", style=shape.xcross, location=location.belowbar, color=colorSL, textcolor=color.white, size=size.tiny)
plotshape(showSellLabels and signalSellSLPrint, title="Stop Loss (sells)", text="X", style=shape.xcross, location=location.abovebar, color=colorSL, textcolor=color.white, size=size.tiny)

// Plot Trend EMA for reference
plot(showStrategy ? trendEma : na, title="Trend EMA", color=color.purple, linewidth=2)

// Plot recent high and low for debugging and validation
plot(showStrategy ? recentHigh : na, title="Recent High", color=color.green, linewidth=1)
plot(showStrategy ? recentLow : na, title="Recent Low", color=color.red, linewidth=1)

// Debugging: Plot bar index to verify real-time behavior
plot(showStrategy ? bar_index : na, title="Bar Index", color=color.blue)

// Debugging: Print the take profit and stop loss conditions
//label.new(bar_index, high, text="TP Buy: " + tostring(signalBuyTPPrint) + "\nSL Buy: " + tostring(signalBuySLPrint) + "\nTP Sell: " + tostring(signalSellTPPrint) + "\nSL Sell: " + tostring(signalSellSLPrint), color=color.blue, textcolor=color.white, size=size.small, style=label.style_label_down)