概述
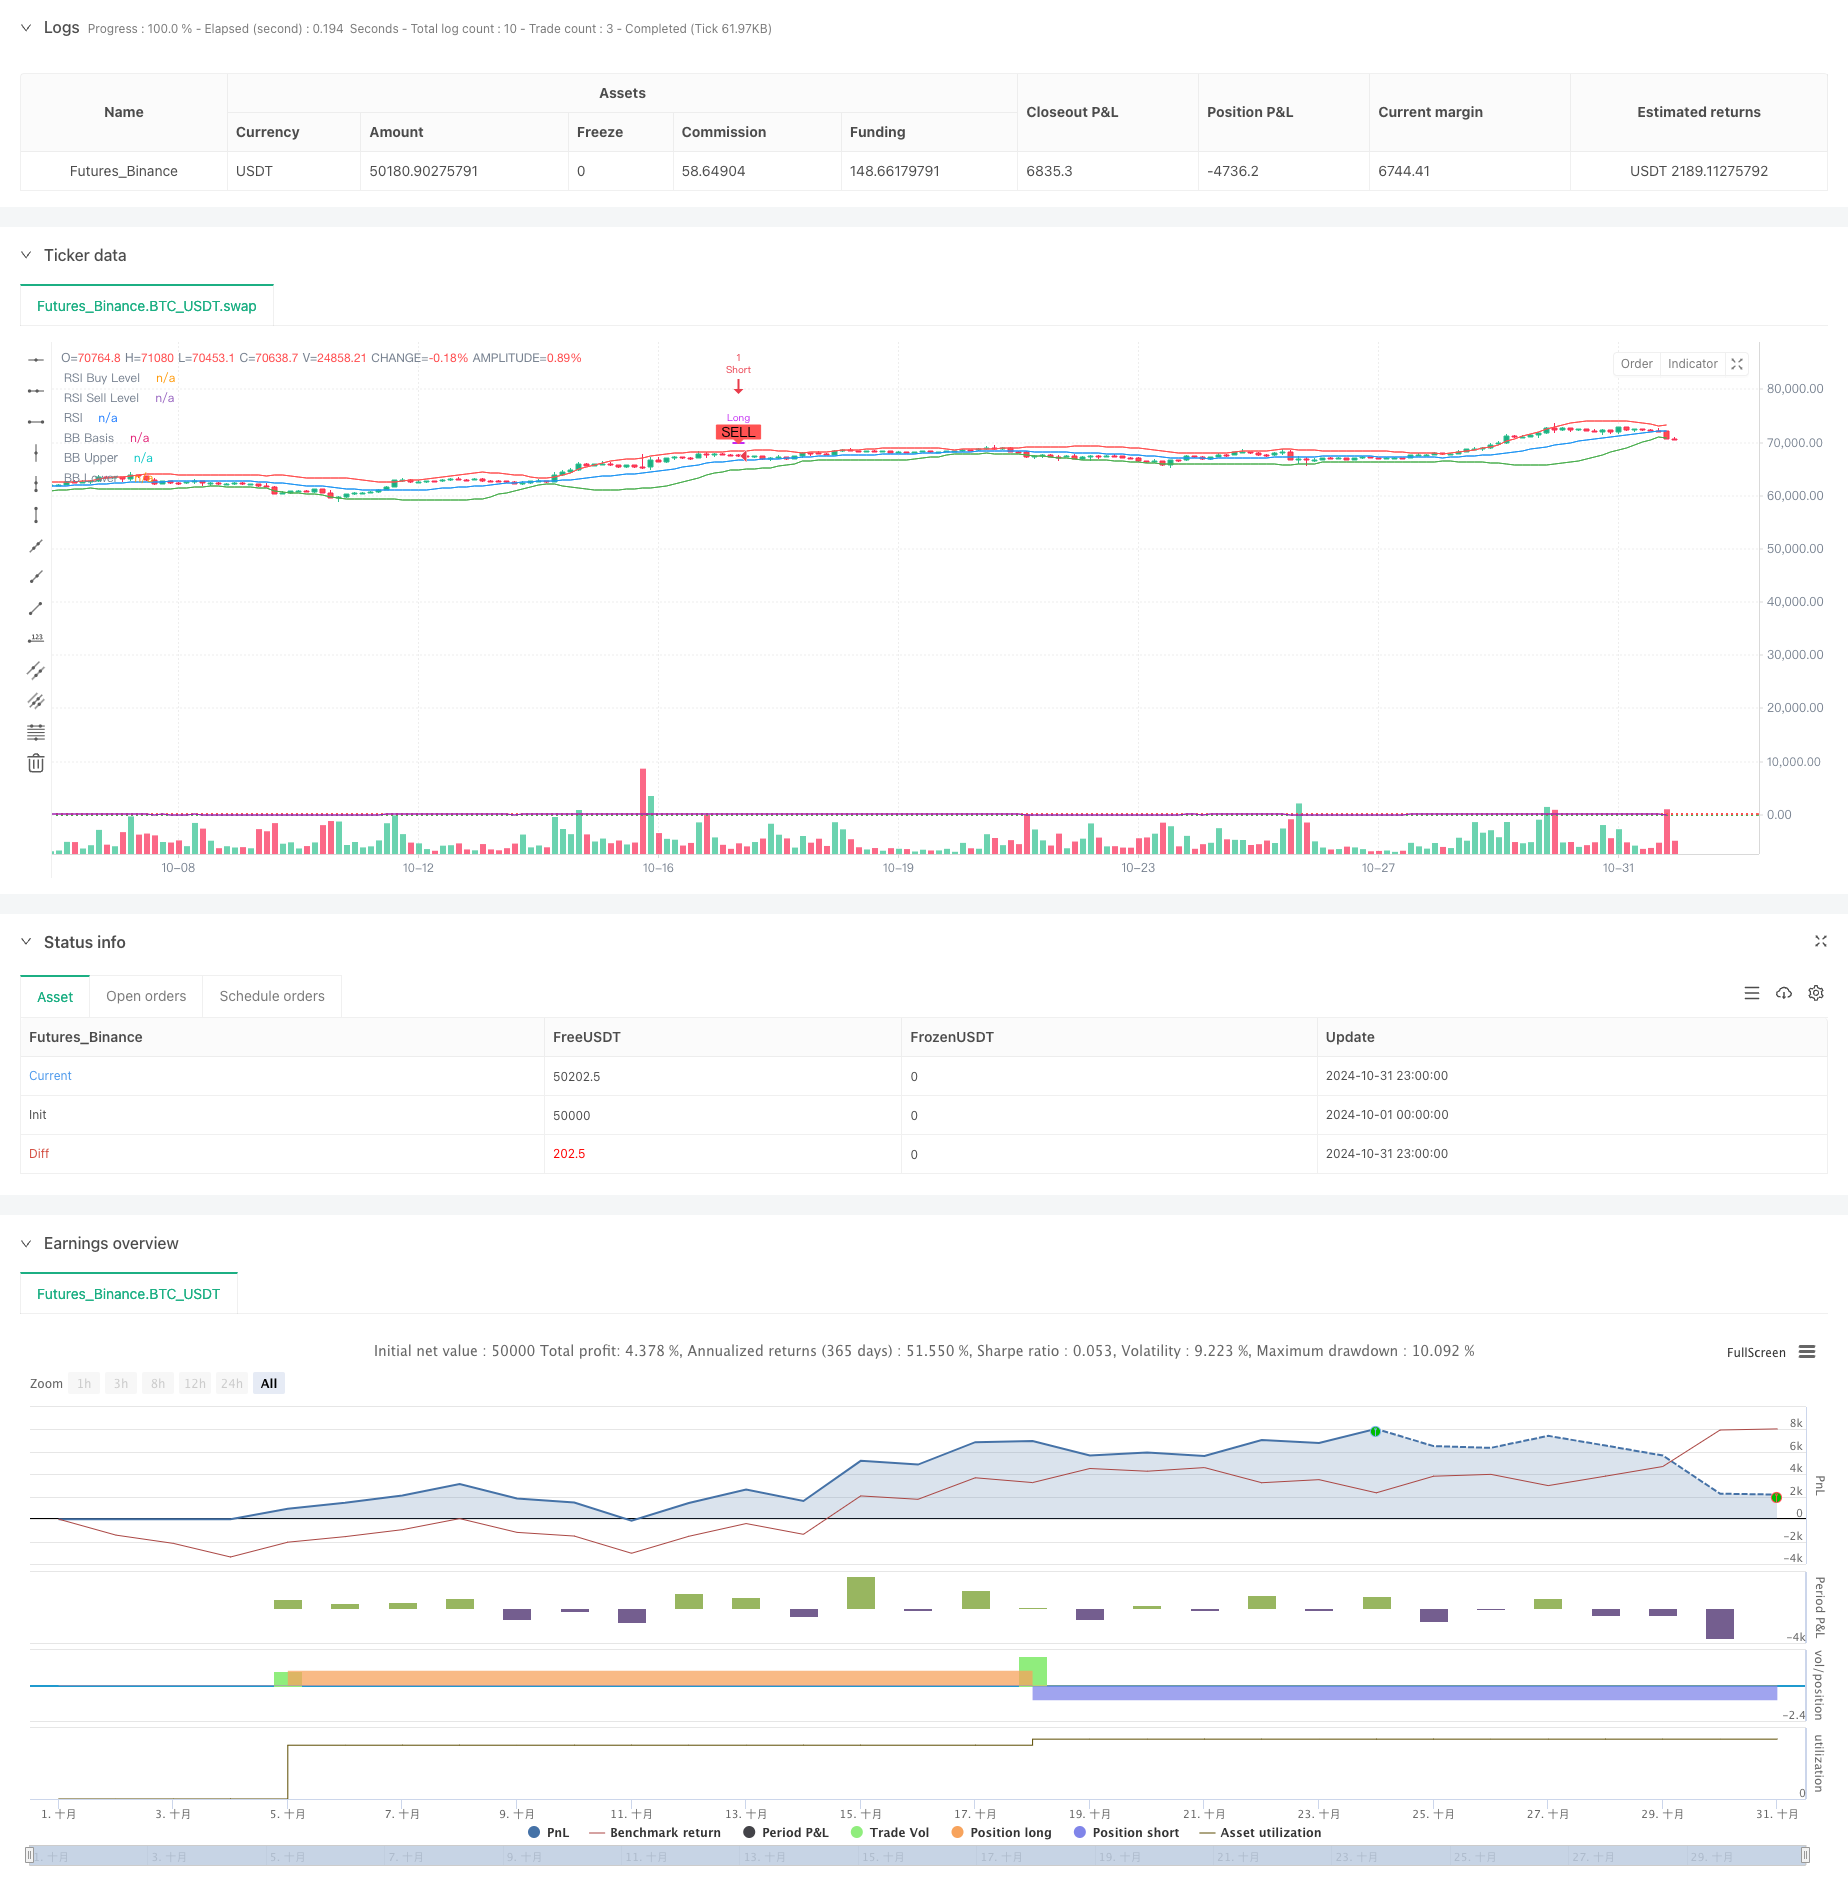
该策略是一个结合了多重技术指标的趋势跟踪系统,通过布林带、RSI和MACD三个经典指标的协同配合,在市场震荡和趋势转换阶段捕捉交易机会。策略采用金字塔式加仓方式,通过严格的交易间隔控制来管理风险。
策略原理
策略核心逻辑建立在三重信号确认基础上: 1. 使用RSI指标识别超买超卖区域,RSI<45视为超卖,RSI>55视为超买 2. 通过布林带通道判断价格位置,当价格接近或突破布林带上下轨时产生信号 3. 利用MACD金叉死叉作为趋势确认,与RSI和布林带信号共振后开仓 策略还设置了最小交易间隔(15个周期),避免过度交易,同时采用金字塔式持仓管理。
策略优势
- 多重技术指标交叉验证,大幅减少虚假信号
- 金字塔式加仓机制提高了资金利用效率
- 设置最小交易间隔,有效控制交易频率
- 指标参数可调整,具有较强的适应性
- 具备自动平仓机制,控制风险敞口
策略风险
- 多重指标可能导致信号滞后
- 震荡市场中可能产生频繁交易
- 金字塔式加仓在趋势反转时可能带来较大损失
- 固定的RSI阈值可能不适合所有市场环境
策略优化方向
- 引入自适应的RSI阈值,根据市场波动度动态调整
- 增加成交量指标作为辅助确认
- 优化金字塔加仓的仓位管理算法
- 加入更灵活的止损机制
- 考虑市场周期特征,动态调整交易间隔
总结
该策略通过多重技术指标的协同配合,在控制风险的同时追求稳定收益。虽然存在一定的滞后性,但通过合理的参数优化和风险管理机制,策略展现出较好的适应性和稳定性。未来可以通过引入自适应机制和更完善的仓位管理来进一步提升策略表现。
策略源码
/*backtest
start: 2024-10-01 00:00:00
end: 2024-10-31 23:59:59
period: 3h
basePeriod: 3h
exchanges: [{"eid":"Futures_Binance","currency":"BTC_USDT"}]
*/

//@version=5
strategy("[ETH] Optimized Trend Strategy", shorttitle="Lorenzo-SuperScalping", overlay=true, pyramiding=3, initial_capital=100000, currency=currency.USD)

// === Input Parameters === //
trade_size = input.float(1.0, title="Trade Size (ETH)")
rsi_length = input.int(14, minval=1, title="RSI Length")
bb_length = input.int(20, minval=1, title="Bollinger Bands Length")
bb_mult = input.float(2.0, title="Bollinger Bands Multiplier")
macd_fast = input.int(12, minval=1, title="MACD Fast Length")
macd_slow = input.int(26, minval=1, title="MACD Slow Length")
macd_signal = input.int(9, minval=1, title="MACD Signal Length")

// === Indicators === //
// RSI
rsi = ta.rsi(close, rsi_length)

// Bollinger Bands
basis = ta.sma(close, bb_length)
dev = ta.stdev(close, bb_length) * bb_mult
upper_band = basis + dev
lower_band = basis - dev
plot(basis, color=color.blue, title="BB Basis")
plot(upper_band, color=color.red, title="BB Upper")
plot(lower_band, color=color.green, title="BB Lower")

// MACD
[macd_line, signal_line, _] = ta.macd(close, macd_fast, macd_slow, macd_signal)
macd_cross_up = ta.crossover(macd_line, signal_line)
macd_cross_down = ta.crossunder(macd_line, signal_line)

// === Signal Control Variables === //
var bool last_signal_buy = na
var int last_trade_bar = na

// === Buy Signal Condition === //
// - RSI below 45
// - Price near or below the lower Bollinger Band
// - MACD crossover
buy_signal = (rsi < 45 and close < lower_band * 1.02 and macd_cross_up)

// === Sell Signal Condition === //
// - RSI above 55
// - Price near or above the upper Bollinger Band
// - MACD crossunder
sell_signal = (rsi > 55 and close > upper_band * 0.98 and macd_cross_down)

// Ensure enough bars between trades
min_bars_between_trades = input.int(15, title="Minimum Bars Between Trades")
time_elapsed = na(last_trade_bar) or (bar_index - last_trade_bar) >= min_bars_between_trades

// === Execute Trades with Conditions === //
can_buy = buy_signal and (na(last_signal_buy) or not last_signal_buy) and time_elapsed
can_sell = sell_signal and (not na(last_signal_buy) and last_signal_buy) and time_elapsed

if (can_buy)
    // Close any existing short position before opening a long
    if strategy.position_size < 0
        strategy.close("Short")

    strategy.entry("Long", strategy.long, qty=trade_size)
    last_signal_buy := true
    last_trade_bar := bar_index

if (can_sell)
    // Close any existing long position and open a short position
    if strategy.position_size > 0
        strategy.close("Long")

    strategy.entry("Short", strategy.short, qty=trade_size)
    last_signal_buy := false
    last_trade_bar := bar_index

// === Plot Buy and Sell Signals === //
plotshape(series=can_buy, title="Buy Signal", location=location.belowbar, color=color.green, style=shape.labelup, text="BUY")
plotshape(series=can_sell, title="Sell Signal", location=location.abovebar, color=color.red, style=shape.labeldown, text="SELL")

// === RSI Levels for Visualization === //
hline(45, "RSI Buy Level", color=color.green, linewidth=1, linestyle=hline.style_dotted)
hline(55, "RSI Sell Level", color=color.red, linewidth=1, linestyle=hline.style_dotted)

// Plot the RSI for reference
plot(rsi, title="RSI", color=color.purple)
相关推荐