概述
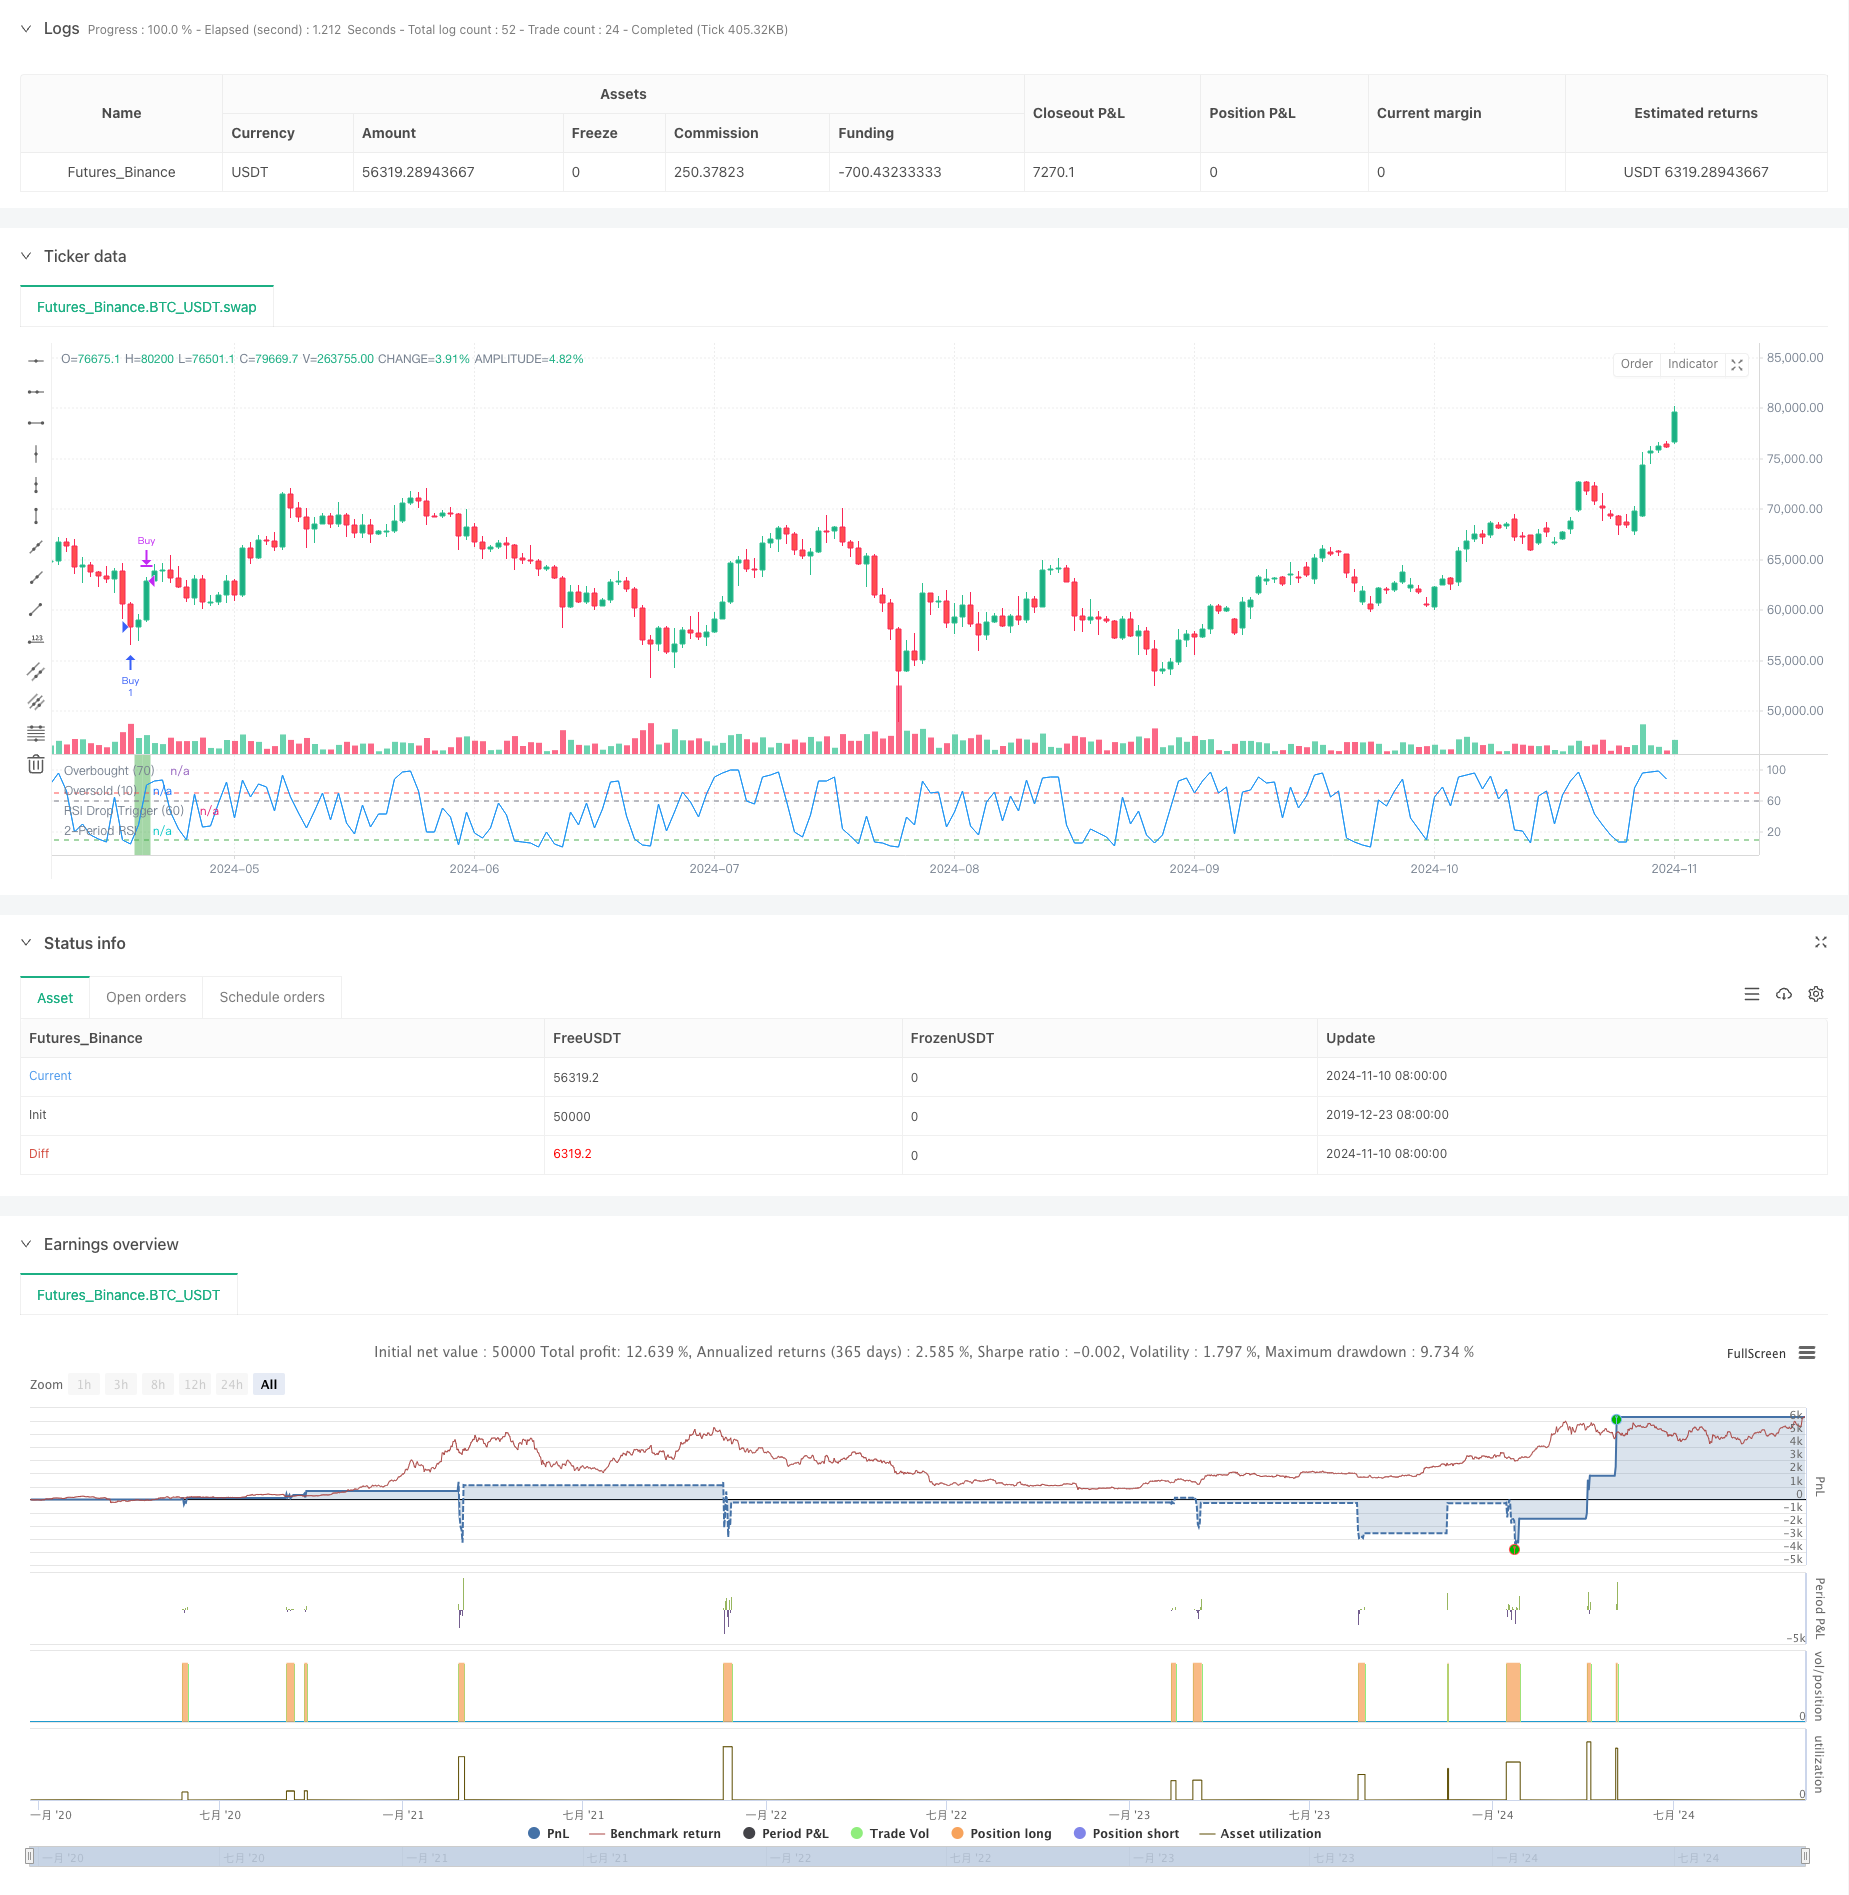
本策略是一个基于均值回归理论的短期交易策略,通过结合200日均线和2周期RSI指标进行交易。策略核心是在长期上升趋势中寻找超卖修正机会,通过三重验证机制确保交易信号的可靠性。
策略原理
策略采用三重验证机制来确认交易信号:首先要求价格位于200日均线之上,确认长期上升趋势;其次通过连续三天的RSI下跌形成短期超卖,且首次下跌需从RSI 60以上开始;最后要求RSI降至10以下形成极度超卖。当三重条件同时满足时,系统发出做多信号。当RSI回升至70以上时,认为已达到超买状态,系统自动平仓。
策略优势
- 三重验证机制显著提高了交易信号的可靠性
- 结合长短期指标,避免了单一指标可能带来的虚假信号
- 策略逻辑清晰,参数设置简单,易于理解和执行
- 通过均线过滤,确保交易方向与主趋势一致
- 采用极端超卖条件触发入场,提高了交易成功概率
策略风险
- 频繁交易可能带来较高的交易成本
- 在强势趋势市场中,可能错过持续上涨机会
- RSI指标在某些市场条件下可能产生滞后
- 市场波动剧烈时可能导致过多假信号 建议通过设置止损,控制持仓时间和优化交易频率来管理风险。
策略优化方向
- 可以考虑增加成交量指标作为辅助确认
- 优化RSI参数,测试不同周期的表现
- 引入自适应机制,根据市场波动调整参数
- 增加趋势强度过滤器,提高交易质量
- 考虑加入止损机制,优化风险控制
总结
该策略通过均线和RSI指标的巧妙组合,构建了一个稳健的交易系统。三重验证机制有效提高了交易的可靠性,但仍需注意风险管理和参数优化。策略整体设计合理,具有较好的实用价值和优化空间。
策略源码
/*backtest
start: 2019-12-23 08:00:00
end: 2024-11-11 00:00:00
period: 1d
basePeriod: 1d
exchanges: [{"eid":"Futures_Binance","currency":"BTC_USDT"}]
*/

//@version=5
strategy("Larry Connors RSI 3 Strategy", overlay=false)

// Define the moving averages and the RSI
sma200 = ta.sma(close, 200)
rsi2 = ta.rsi(close, 2)

// Conditions for the strategy
condition1 = close > sma200  // Close above the 200-day moving average

// RSI drops three days in a row and the first day’s drop is from above 60
rsi_drop_3_days = rsi2[2] > rsi2[1] and rsi2[1] > rsi2 and rsi2[2] > 60  // The 3-day RSI drop condition
condition2 = rsi_drop_3_days

// The 2-period RSI is below 10 today
condition3 = rsi2 < 10

// Combined buy condition
buyCondition = condition1 and condition2 and condition3

// Sell condition: The 2-period RSI is above 70
sellCondition = rsi2 > 70

// Execute the buy signal when all buy conditions are met
if buyCondition
    strategy.entry("Buy", strategy.long)

// Execute the sell signal when the sell condition is met
if sellCondition
    strategy.close("Buy")

// Plotting the RSI for visual confirmation
plot(rsi2, title="2-Period RSI", color=color.blue)
hline(70, "Overbought (70)", color=color.red)
hline(10, "Oversold (10)", color=color.green)
hline(60, "RSI Drop Trigger (60)", color=color.gray)

// Set background color when a position is open
bgcolor(strategy.opentrades > 0 ? color.new(color.green, 50) : na)
相关推荐