概述
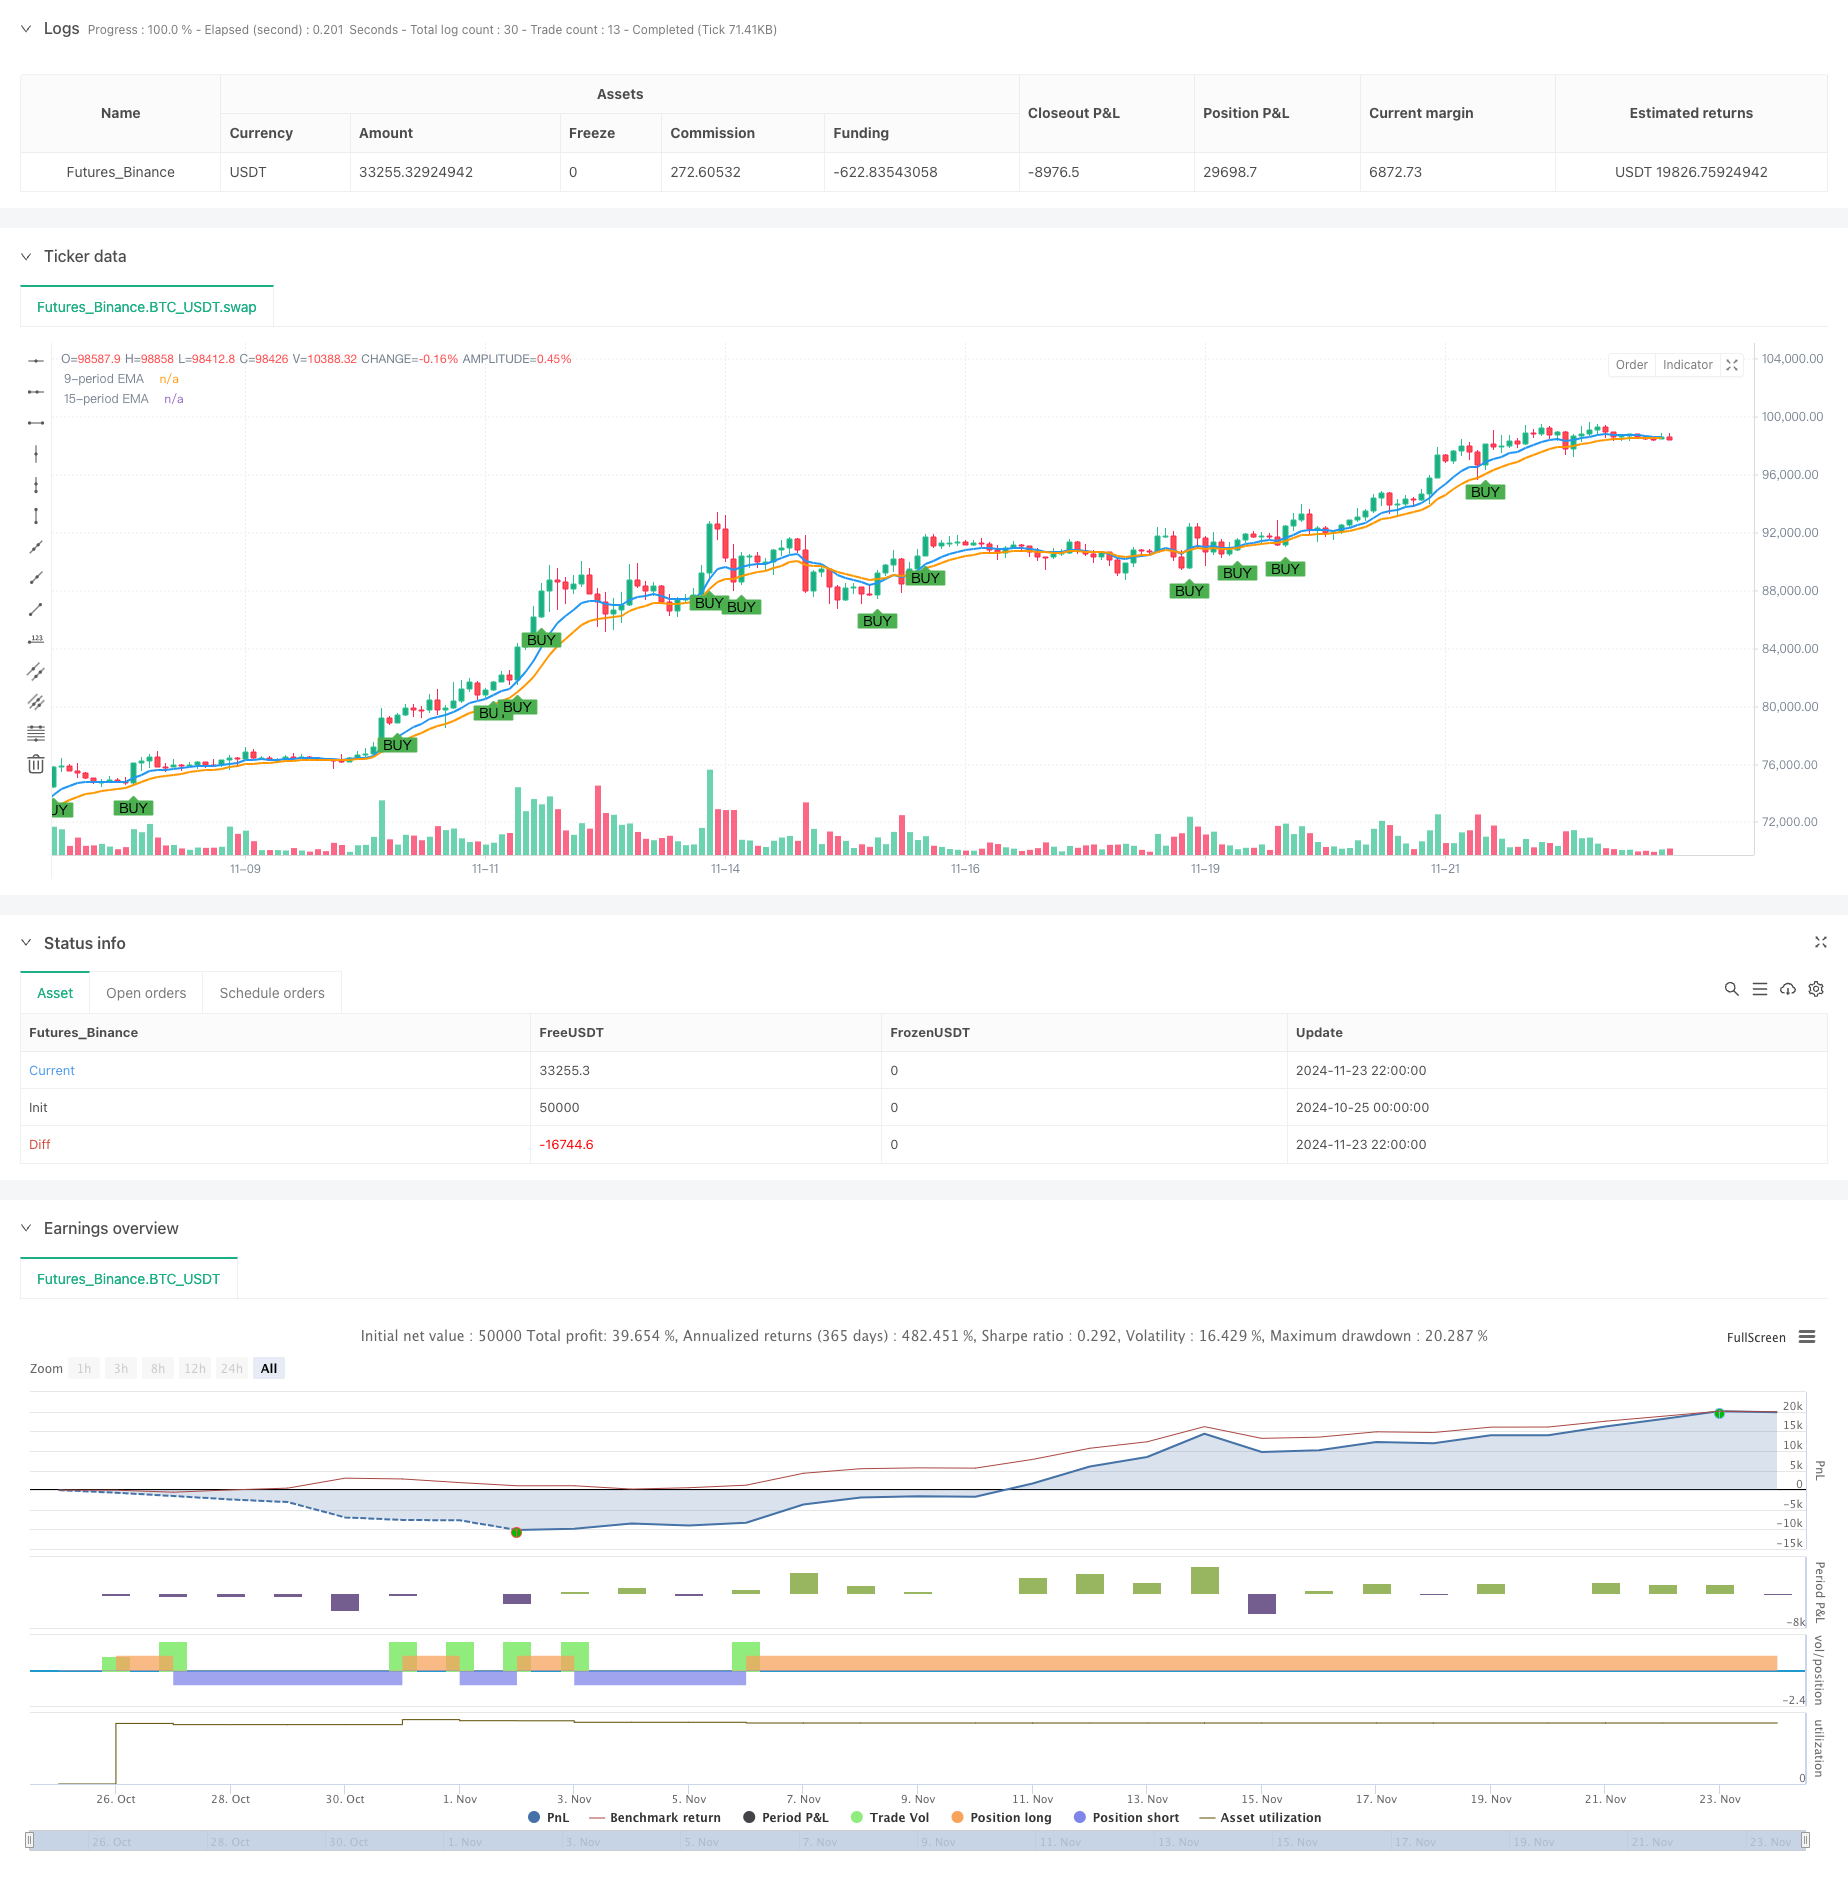
该策略是一个结合了技术分析和价格行为的趋势跟踪系统。策略核心是利用9周期和15周期指数移动平均线(EMA)作为趋势方向指标,同时结合满实体蜡烛图(Marubozu)作为动量确认信号,形成一个完整的交易决策系统。通过对均线的交叉以及价格走势的分析,策略能够捕捉市场的主要趋势变化,并在合适的时机进行交易。
策略原理
策略采用双重过滤机制来确认交易信号。首先,使用9周期和15周期的EMA来确定市场趋势方向。其次,通过识别满实体蜡烛图形态作为动量确认信号。当出现满实体多头蜡烛且收盘价位于两条EMA之上时,系统产生买入信号;当出现满实体空头蜡烛且收盘价位于两条EMA之下时,系统产生卖出信号。满实体蜡烛的判定标准为实体部分占整个蜡烛至少75%,这表明市场在该时期表现出强烈的单向移动。
策略优势
- 信号可靠性高:通过结合均线和满实体蜡烛两个维度的确认,显著提高了交易信号的可靠性
- 趋势把握准确:双均线系统能够有效识别市场趋势,避免在横盘市场频繁交易
- 执行标准明确:策略的进场和出场条件清晰,便于量化实现
- 风险控制完善:系统内置的反向信号平仓机制,有效控制了持仓风险
- 操作简单直观:策略逻辑简单,便于理解和执行,适合各类交易者使用
策略风险
- 滞后性风险:均线指标本身具有滞后性,可能导致入场时机略有延迟
- 假突破风险:市场可能出现假突破情况,导致错误信号
- 横盘市场风险:在市场震荡期间可能产生频繁的假信号
- 瞬间跳空风险:大幅跳空可能导致止损失效
- 参数优化风险:不同市场环境下最优参数可能存在差异
优化方向
- 引入波动率过滤器:可以添加ATR指标来过滤低波动率环境下的交易信号
- 优化均线周期:可根据不同市场特征调整均线周期参数
- 增加趋势强度确认:可以引入ADX等趋势强度指标作为辅助判断
- 完善止损机制:可以增加追踪止损功能,更好地保护利润
- 添加市场环境过滤:引入市场状态判断机制,在横盘市场自动降低交易频率
总结
该策略通过结合均线系统和满实体蜡烛信号,构建了一个稳健的趋势跟踪交易系统。策略设计充分考虑了趋势确认和动量确认两个维度,具有较好的可靠性和实用性。通过合理的优化和风险控制措施,策略可以在不同市场环境下保持稳定的表现。整体而言,这是一个逻辑严谨、实用性强的交易策略系统。
策略源码
/*backtest
start: 2024-10-25 00:00:00
end: 2024-11-24 00:00:00
period: 2h
basePeriod: 2h
exchanges: [{"eid":"Futures_Binance","currency":"BTC_USDT"}]
*/

//@version=5
strategy("9 & 15 EMA with Full Body Candle Strategy", overlay=true)

// Input parameters for EMAs
ema9Length = input.int(9, title="9-period EMA")
ema15Length = input.int(15, title="15-period EMA")

// Calculate the 9-period and 15-period EMAs
ema9 = ta.ema(close, ema9Length)
ema15 = ta.ema(close, ema15Length)

// Define full body (marubozu) candle conditions
fullBodyBullishCandle = (close > open) and (close - open >= (high - low) * 0.75)
fullBodyBearishCandle = (close < open) and (open - close >= (high - low) * 0.75)

// Buy condition: Full body candle closes above both EMAs
buySignal = fullBodyBullishCandle and close > ema9 and close > ema15

// Sell condition: Full body candle closes below both EMAs
sellSignal = fullBodyBearishCandle and close < ema9 and close < ema15

// Plot the EMAs on the chart
plot(ema9, color=color.blue, linewidth=2, title="9-period EMA")
plot(ema15, color=color.orange, linewidth=2, title="15-period EMA")

// Plot buy and sell signals
plotshape(series=buySignal, title="Buy Signal", location=location.belowbar, color=color.green, style=shape.labelup, text="BUY", size=size.small)
plotshape(series=sellSignal, title="Sell Signal", location=location.abovebar, color=color.red, style=shape.labeldown, text="SELL", size=size.small)

// Execute buy and sell strategy
if (buySignal)
    strategy.entry("Buy", strategy.long)

if (sellSignal)
    strategy.entry("Sell", strategy.short)

// Close buy position on sell signal
if (sellSignal)
    strategy.close("Buy")

// Close sell position on buy signal
if (buySignal)
    strategy.close("Sell")
相关推荐