概述
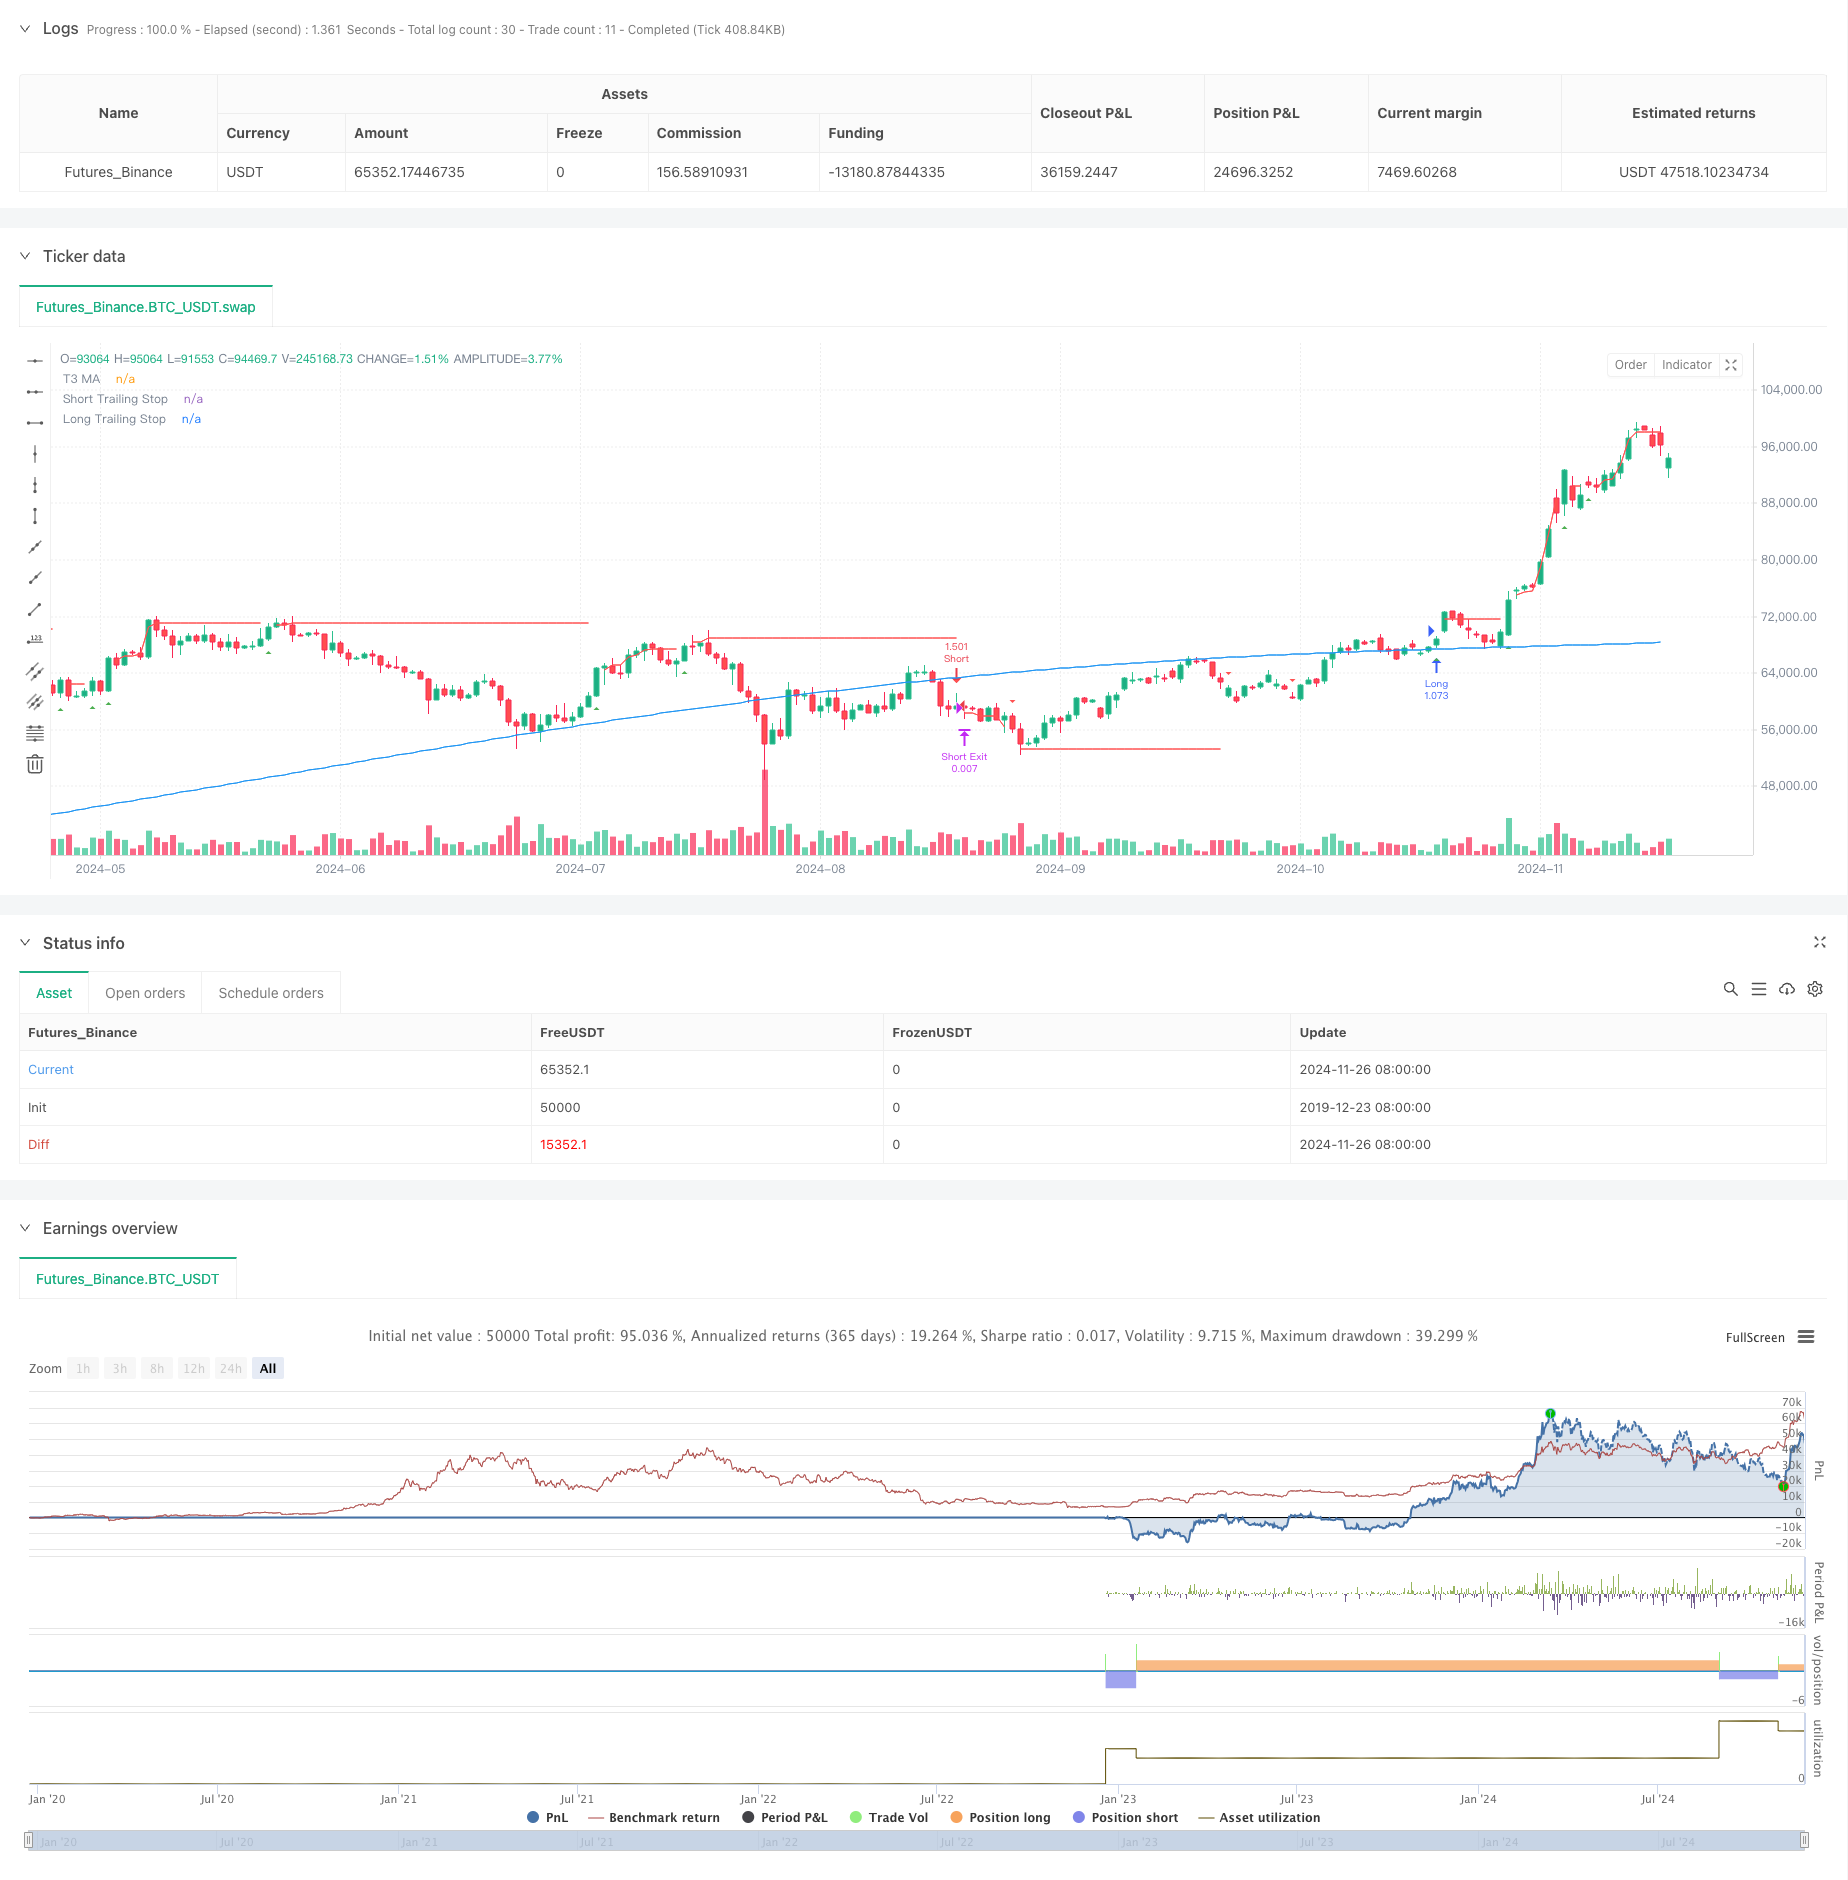
本策略是一个结合T3均线、趋势跟踪和移动止损机制的综合量化交易系统。策略通过T3移动平均线识别市场趋势方向,同时利用Lemon趋势指标和TDFI指标进行信号确认,并配合移动止损和固定止损相结合的风险管理体系,实现对趋势的把握和风险的有效控制。
策略原理
该策略的核心包含三个主要部分:趋势识别、信号确认和风险管理。首先,使用T3移动平均线作为主要趋势识别工具,T3均线通过六重指数移动平均计算,能够有效降低滞后性并保持平滑度。其次,通过Lemon趋势指标计算价格波动区间,结合TDFI指标进行信号过滤,只有当价格突破波动区间且TDFI指标确认时才会产生交易信号。最后,策略采用移动止损和固定止损相结合的方式进行风险管理,移动止损在价格达到激活阈值后开始跟踪,同时保留固定止损作为保护机制。
策略优势
- 多重信号确认机制提高了交易的准确性
- T3均线的使用降低了假突破的影响
- 灵活的风险管理系统,能够在保护利润的同时给予趋势足够的发展空间
- 支持部分仓位止盈,可以实现利润的分步兑现
- 参数可调节性强,便于根据不同市场环境进行优化
策略风险
- T3均线计算复杂,可能存在计算延迟
- 多重信号确认可能导致错过一些交易机会
- 移动止损可能在剧烈波动时被过早触发
- 需要较大的价格波动才能产生有效信号
- 在横盘市场可能产生频繁的假信号
策略优化方向
- 引入波动率指标调整移动止损参数
- 增加市场环境识别模块,在不同市场条件下使用不同的参数
- 优化TDFI指标的计算周期,提高信号的及时性
- 考虑加入成交量因素进行信号确认
- 研究自适应的部分止盈比例设置机制
总结
这是一个设计全面的趋势跟踪策略,通过多重技术指标的配合使用,既保证了交易信号的可靠性,又实现了有效的风险管理。策略的模块化设计使其具有良好的可扩展性和优化空间,适合作为中长期趋势跟踪系统的基础框架。在实际应用中,建议根据具体的交易品种和市场环境对参数进行优化调整。
策略源码
/*backtest
start: 2019-12-23 08:00:00
end: 2024-11-27 00:00:00
period: 1d
basePeriod: 1d
exchanges: [{"eid":"Futures_Binance","currency":"BTC_USDT"}]
*/

//@version=5
strategy("Lemon Trend Strategy", overlay=true, initial_capital=10000, default_qty_type=strategy.percent_of_equity, default_qty_value=100)

// Input parameters
lookbackPeriod = input.int(14, "Lookback Period")
t3Length = input.int(200, "T3 MA Length")
t3Factor = input.float(0.7, "T3 Factor", minval=0, maxval=1)

// 移动止损参数
trailingStopPct = input.float(1.5, "移动止损百分比", minval=0.1, step=0.1)
trailingStopActivationPct = input.float(1.0, "移动止损激活百分比", minval=0.1, step=0.1)

// === T3 Moving Average Function ===
t3(src, length, factor) =>
    // First EMA
    e1 = ta.ema(src, length)
    // Second EMA
    e2 = ta.ema(e1, length)
    // Third EMA
    e3 = ta.ema(e2, length)
    // Fourth EMA
    e4 = ta.ema(e3, length)
    // Fifth EMA
    e5 = ta.ema(e4, length)
    // Sixth EMA
    e6 = ta.ema(e5, length)

    c1 = -factor * factor * factor
    c2 = 3 * factor * factor + 3 * factor * factor * factor
    c3 = -6 * factor * factor - 3 * factor - 3 * factor * factor * factor
    c4 = 1 + 3 * factor + factor * factor * factor + 3 * factor * factor

    t3 = c1 * e6 + c2 * e5 + c3 * e4 + c4 * e3

// Calculate T3 MA
t3ma = t3(close, t3Length, t3Factor)
plot(t3ma, "T3 MA", color=color.blue)

// === Lemon Trend Indicator ===
highLowDiff = high - low
normalizedDiff = ta.sma(highLowDiff, lookbackPeriod)
upperBand = ta.highest(high, lookbackPeriod)
lowerBand = ta.lowest(low, lookbackPeriod)
buySignal = ta.crossover(close, upperBand - normalizedDiff)
sellSignal = ta.crossunder(close, lowerBand + normalizedDiff)

// === TDFI Indicator ===
tdfiLength = input.int(14, "TDFI Length")
tdfi = ta.ema(close - close[1], tdfiLength)
tdfiSignal = ta.ema(tdfi, 9)

// Plot signals
plotshape(buySignal and tdfi > tdfiSignal and close > t3ma, "Buy Signal", location=location.belowbar, color=color.green, style=shape.triangleup, size=size.small)
plotshape(sellSignal and tdfi < tdfiSignal and close < t3ma, "Sell Signal", location=location.abovebar, color=color.red, style=shape.triangledown, size=size.small)

// === Strategy Logic ===
longCondition = buySignal and tdfi > tdfiSignal and close > t3ma
shortCondition = sellSignal and tdfi < tdfiSignal and close < t3ma

// 计算移动止损价格
var float longTrailingStop = na
var float shortTrailingStop = na

// 更新移动止损价格
if (strategy.position_size > 0)
    threshold = strategy.position_avg_price * (1 + trailingStopActivationPct / 100)
    if (high > threshold)
        stopPrice = high * (1 - trailingStopPct / 100)
        if (na(longTrailingStop) or stopPrice > longTrailingStop)
            longTrailingStop := stopPrice

if (strategy.position_size < 0)
    threshold = strategy.position_avg_price * (1 - trailingStopActivationPct / 100)
    if (low < threshold)
        stopPrice = low * (1 + trailingStopPct / 100)
        if (na(shortTrailingStop) or stopPrice < shortTrailingStop)
            shortTrailingStop := stopPrice

// Entry orders
if (longCondition)
    strategy.entry("Long", strategy.long)
    longTrailingStop := na

if (shortCondition)
    strategy.entry("Short", strategy.short)
    shortTrailingStop := na

// Calculate stop loss and take profit levels
longStopLoss = ta.lowest(low, lookbackPeriod)
shortStopLoss = ta.highest(high, lookbackPeriod)

// Exit conditions with fixed R:R
fixedRR = input.float(1.8, "Fixed Risk:Reward Ratio")
partialExitPct = input.float(50.0, "Partial Exit Percentage", minval=0, maxval=100) / 100

// 综合移动止损和固定止损
if (strategy.position_size > 0)
    longTakeProfit = strategy.position_avg_price + (strategy.position_avg_price - longStopLoss) * fixedRR
    stopPrice = na(longTrailingStop) ? longStopLoss : math.max(longStopLoss, longTrailingStop)
    strategy.exit("Long Exit", "Long", qty_percent=partialExitPct, stop=stopPrice, limit=longTakeProfit)

if (strategy.position_size < 0)
    shortTakeProfit = strategy.position_avg_price - (shortStopLoss - strategy.position_avg_price) * fixedRR
    stopPrice = na(shortTrailingStop) ? shortStopLoss : math.min(shortStopLoss, shortTrailingStop)
    strategy.exit("Short Exit", "Short", qty_percent=partialExitPct, stop=stopPrice, limit=shortTakeProfit)

// 绘制移动止损线
plot(strategy.position_size > 0 ? longTrailingStop : na, "Long Trailing Stop", color=color.red, style=plot.style_linebr)
plot(strategy.position_size < 0 ? shortTrailingStop : na, "Short Trailing Stop", color=color.red, style=plot.style_linebr)
相关推荐