概述
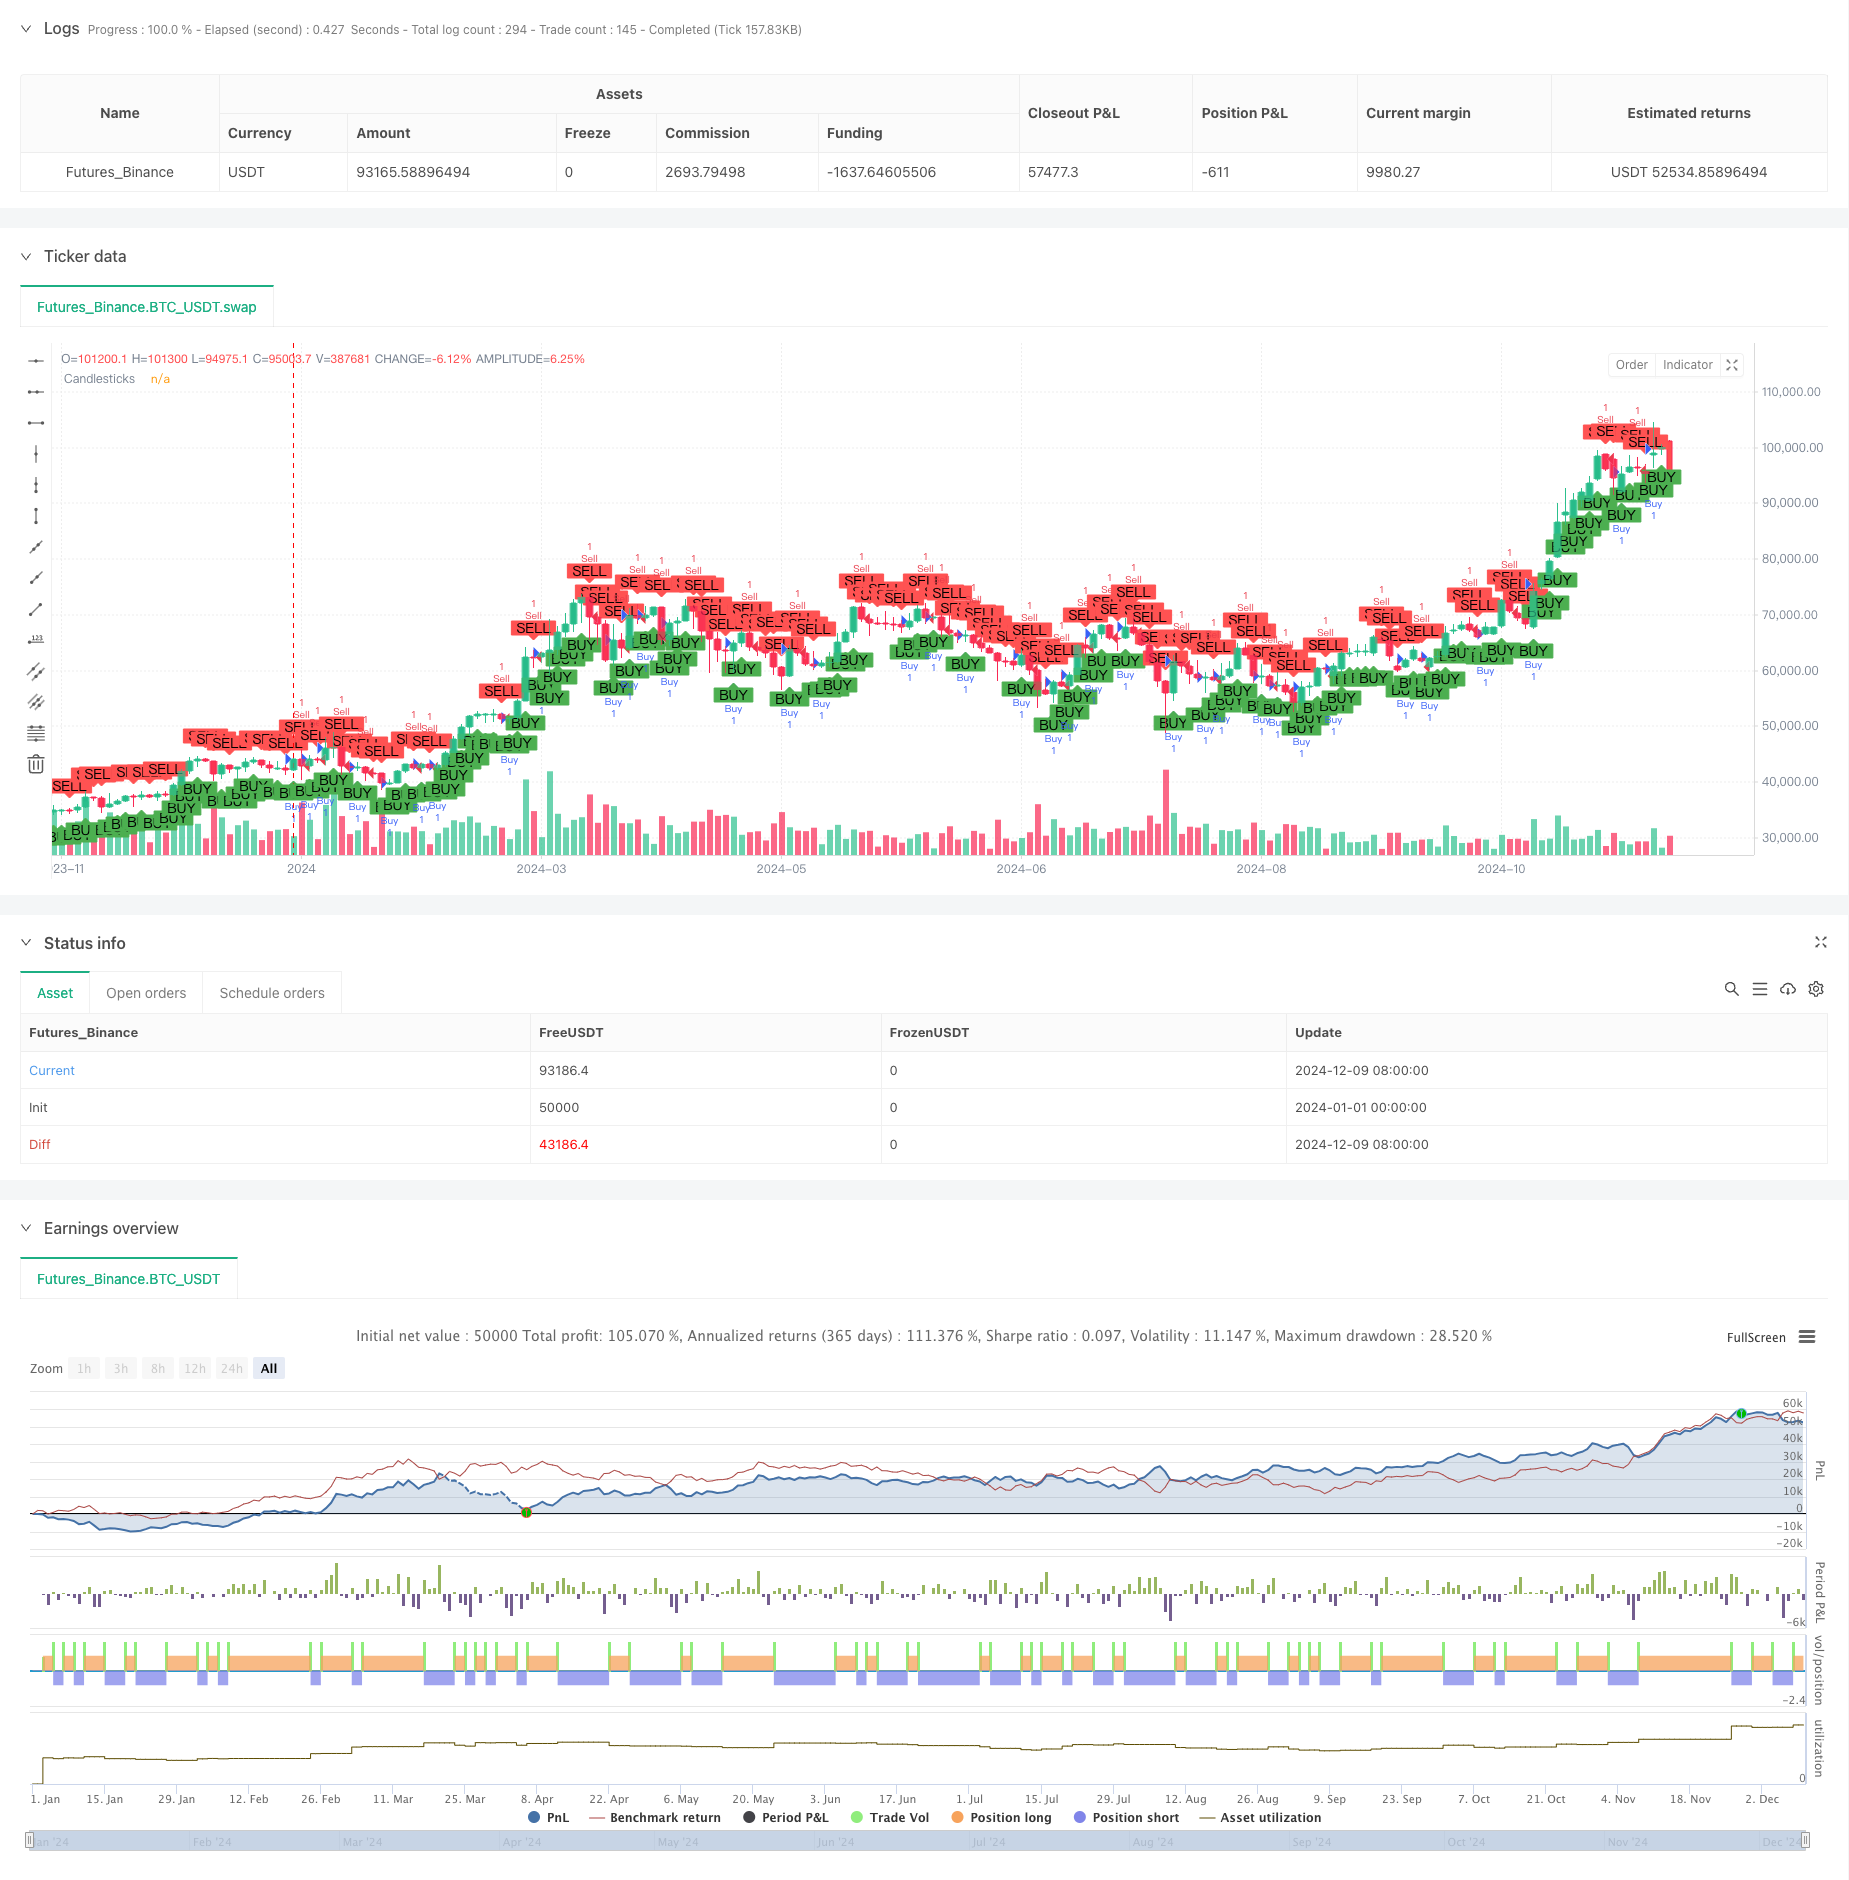
这是一个基于1分钟K线收盘方向进行高频交易的策略。策略通过判断K线的收盘价与开盘价的关系来确定市场走势,并在看涨K线形成后做多,看跌K线形成后做空。策略采用固定持仓时间,在下一根K线收盘时平仓,并对每日最大交易次数进行限制,以控制风险。
策略原理
策略的核心逻辑是通过K线收盘方向来判断短期市场趋势: 1. 当收盘价高于开盘价时,形成阳线,表明当前周期内买方力量占优,策略选择做多。 2. 当收盘价低于开盘价时,形成阴线,表明当前周期内卖方力量占优,策略选择做空。 3. 策略在开仓后的下一根K线收盘时平仓,实现快速获利或止损。 4. 每日交易次数限制在200次以内,防止过度交易。 5. 每次交易使用账户1%的资金量,实现风险控制。
策略优势
- 交易逻辑简单清晰,易于理解和实现
- 持仓时间短,减少了市场波动带来的风险
- 采用固定的持仓时间,避免了主观判断带来的偏差
- 设置了每日最大交易次数限制,有效控制风险
- 使用百分比风险管理,保护账户资金安全
- 通过可视化显示交易信号,便于策略监控和优化
策略风险
- 高频交易可能带来较高的交易成本 解决方案:选择点差较小的交易品种,优化交易时间段
- 在剧烈波动市场中可能遭受连续损失 解决方案:增加市场波动率过滤条件
- 策略可能受到假突破的影响 解决方案:增加成交量等辅助指标进行确认
- 固定持仓时间可能错过更大的盈利机会 解决方案:根据市场情况动态调整持仓时间
- 没有考虑更多的市场信息和技术指标 解决方案:结合其他技术指标优化入场条件
策略优化方向
- 引入成交量指标:通过成交量确认K线的有效性,提高交易信号的可靠性
- 添加趋势过滤:结合均线等趋势指标,在主趋势方向上进行交易
- 动态持仓时间:根据市场波动率动态调整持仓时间,提高策略适应性
- 优化资金管理:根据历史盈亏情况动态调整position size
- 增加市场波动率过滤:在波动率过大或过小的市场环境下暂停交易
- 添加时间过滤:避开高波动的市场开盘和收盘时段
总结
该策略是一个基于K线收盘方向的高频交易系统,通过简单的价格行为分析来捕捉短期市场机会。策略的优势在于逻辑简单、持仓时间短、风险可控,但同时也面临着交易成本高、假突破等挑战。通过引入更多的技术指标和优化方案,策略的稳定性和盈利能力有望得到进一步提升。对于追求短期交易机会的投资者来说,这是一个值得尝试和改进的交易策略。
策略源码
/*backtest
start: 2024-01-01 00:00:00
end: 2024-12-10 08:00:00
period: 2d
basePeriod: 2d
exchanges: [{"eid":"Futures_Binance","currency":"BTC_USDT"}]
*/

//@version=5
strategy("Candle Close Strategy", overlay=true)

// Define conditions for bullish and bearish candlesticks
isBullish = close > open
isBearish = close < open

// Track the number of bars since the trade was opened and the number of trades per day
var int barsSinceTrade = na
var int tradesToday = 0

// Define a fixed position size for testing
fixedPositionSize = 1

// Entry condition: buy after the close of a bullish candlestick
if (isBullish and tradesToday < 200)  // Limit to 200 trades per day
    strategy.entry("Buy", strategy.long, qty=fixedPositionSize)
    barsSinceTrade := 0
    tradesToday := tradesToday + 1

// Entry condition: sell after the close of a bearish candlestick
if (isBearish and tradesToday < 200)  // Limit to 200 trades per day
    strategy.entry("Sell", strategy.short, qty=fixedPositionSize)
    barsSinceTrade := 0
    tradesToday := tradesToday + 1

// Update barsSinceTrade if a trade is open
if (strategy.opentrades > 0)
    barsSinceTrade := nz(barsSinceTrade) + 1

// Reset tradesToday at the start of a new day
if (dayofmonth != dayofmonth[1])
    tradesToday := 0

// Exit condition: close the trade after the next candlestick closes
if (barsSinceTrade == 2)
    strategy.close("Buy")
    strategy.close("Sell")

// Plot bullish and bearish conditions
plotshape(series=isBullish, location=location.belowbar, color=color.green, style=shape.labelup, text="BUY")
plotshape(series=isBearish, location=location.abovebar, color=color.red, style=shape.labeldown, text="SELL")

// Plot the candlesticks
plotcandle(open, high, low, close, title="Candlesticks")
相关推荐