概述
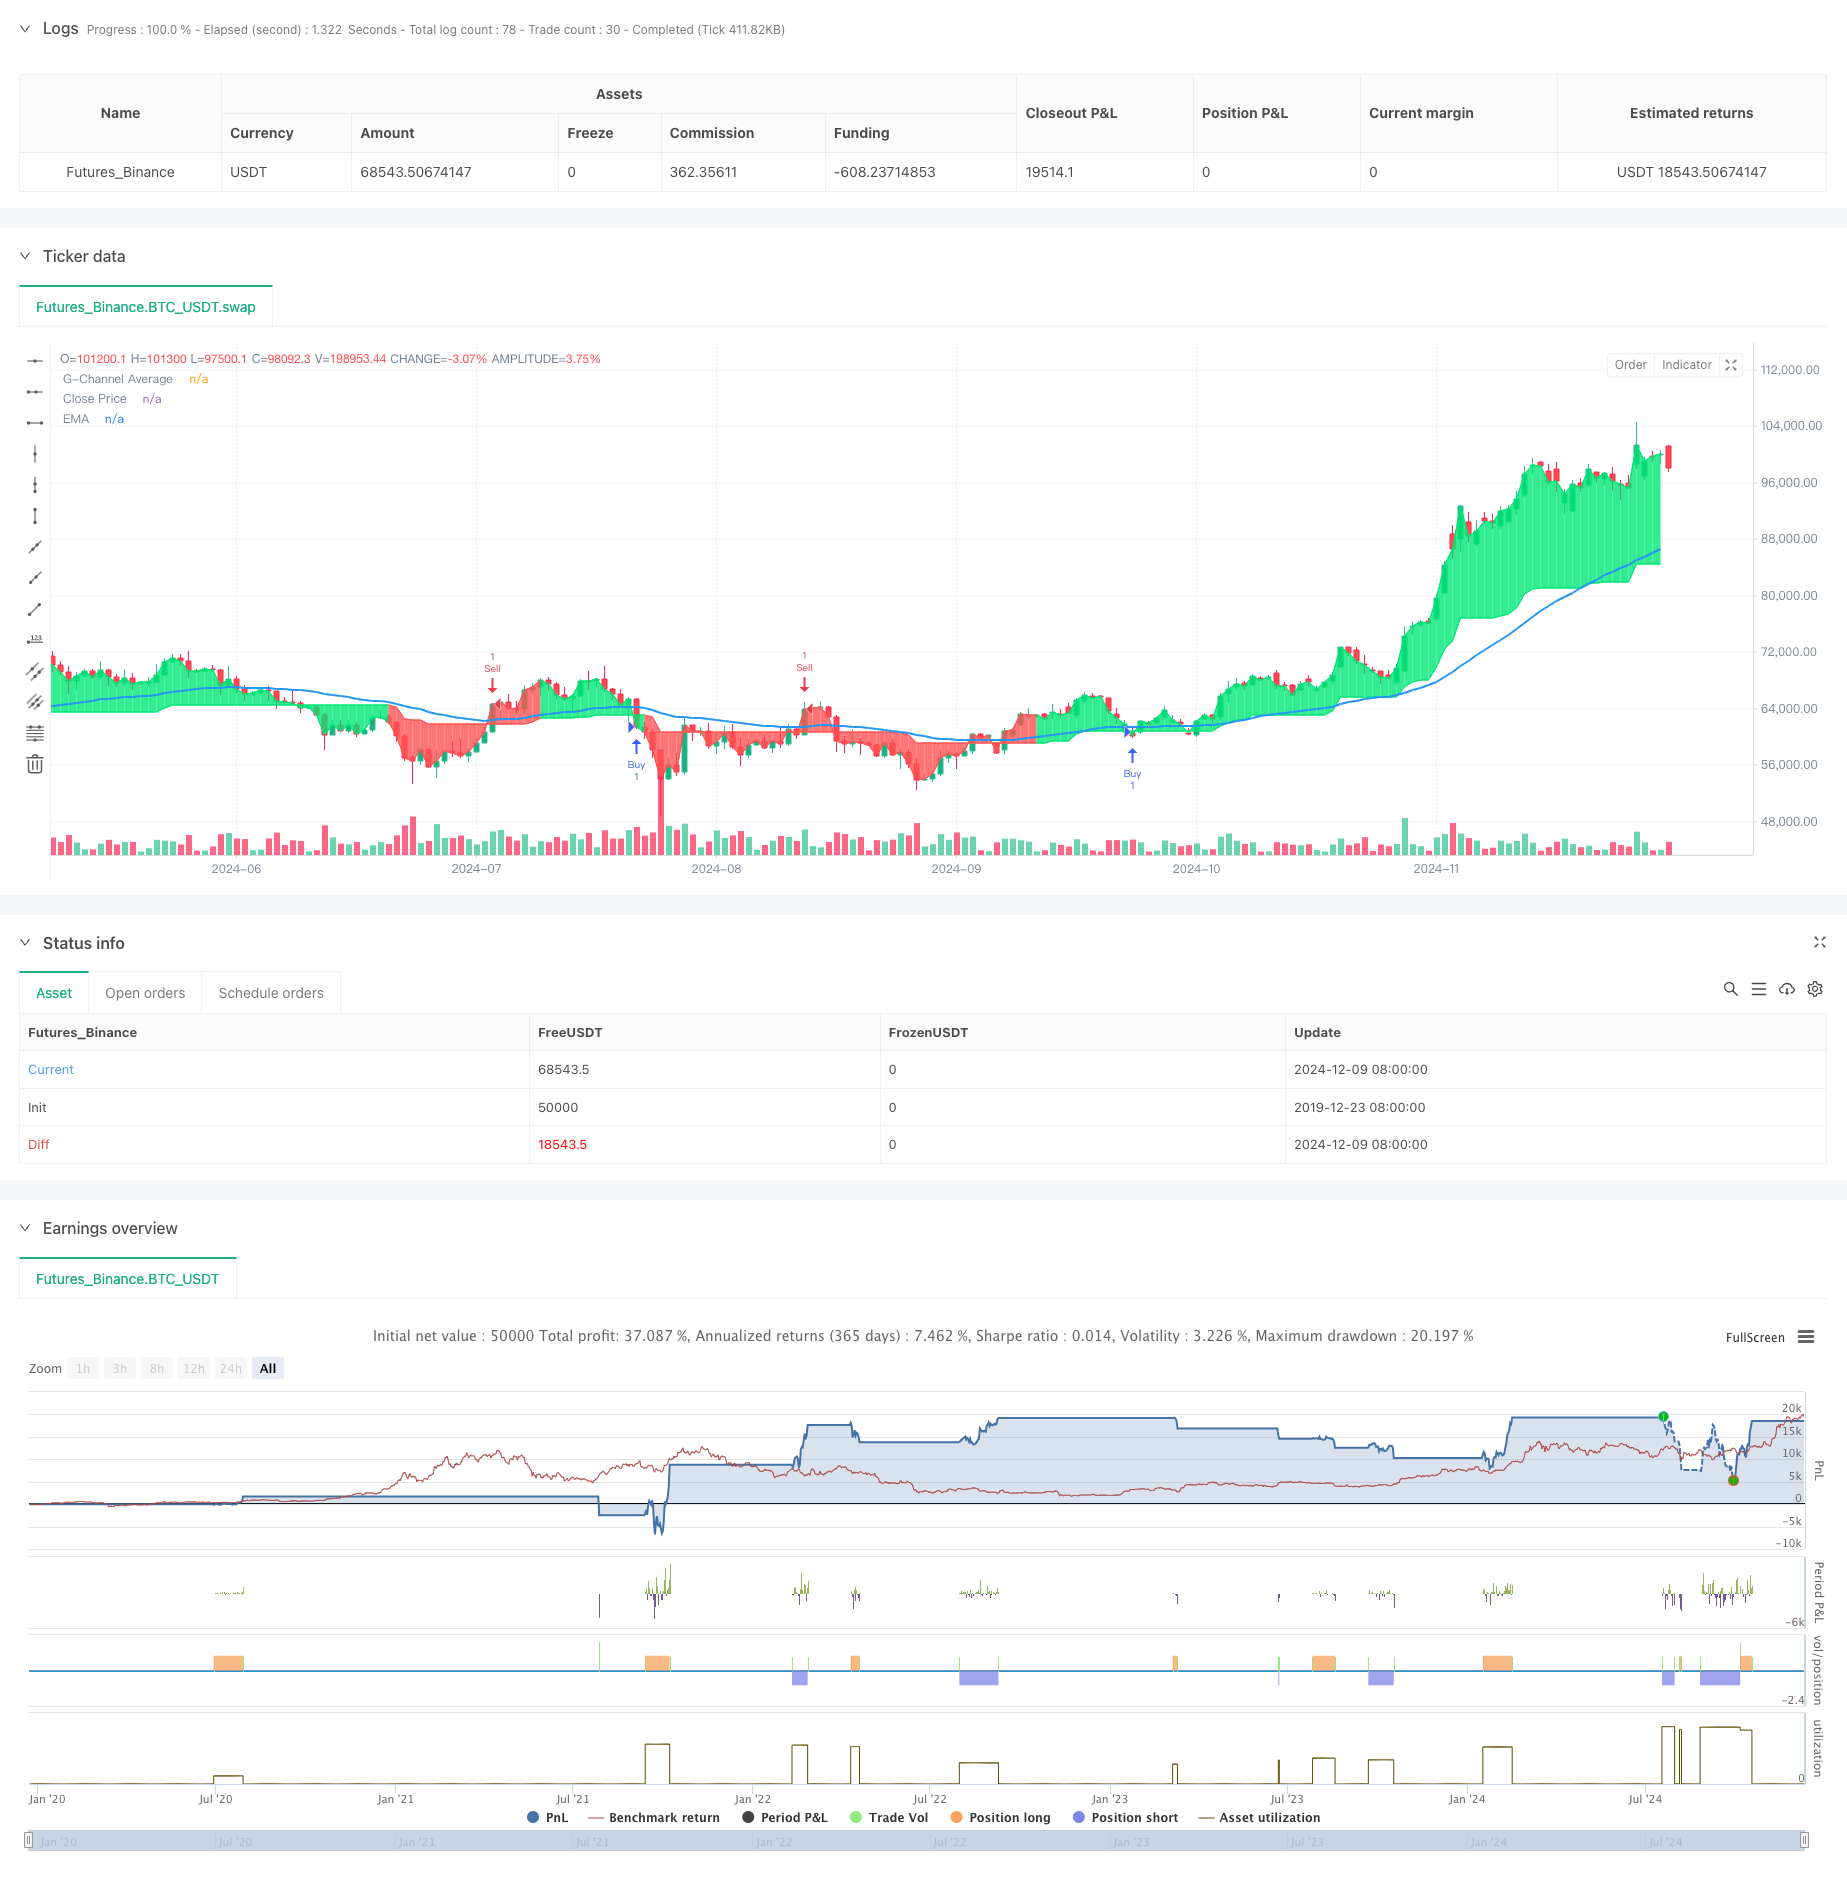
该策略是一个结合了G通道(G-Channel)、指数移动平均线(EMA)和真实波动幅度(ATR)的多指标交易系统。它通过动态支撑/阻力位和趋势确认来识别交易信号,并使用基于ATR的止损和止盈来管理风险。系统设计注重可靠性和风险控制,适合寻求稳健交易方法的交易者。
策略原理
策略的核心逻辑基于以下几个关键组成部分: 1. G通道计算动态支撑和阻力水平,通过数学公式不断调整上下轨 2. EMA用于确认整体趋势方向,价格与EMA的相对位置决定交易方向 3. 入场信号基于G通道的突破和EMA的位置确认 4. 使用ATR的倍数设置止损和止盈,止损为2倍ATR,止盈为4倍ATR 5. 通过状态跟踪避免连续出现重复信号
策略优势
- 多层次信号确认机制提高了交易的可靠性
- 动态调整的通道边界适应不同市场环境
- 基于波动率的风险管理更具适应性
- 避免重复信号降低了过度交易风险
- 视觉清晰的买卖标记便于分析和回测
策略风险
- 在横盘市场可能产生过多的假突破信号
- EMA作为滞后指标可能导致入场时机延迟
- 固定倍数的ATR止损可能在高波动期不够灵活
- 需要较长的历史数据计算各项指标
- 参数优化可能导致过度拟合
策略优化方向
- 引入成交量确认信号,提高突破的可靠性
- 动态调整ATR倍数以适应不同的市场波动状态
- 添加市场环境过滤器,在不利条件下避免交易
- 优化信号过滤逻辑,进一步减少假信号
- 考虑加入动态的仓位管理系统
总结
该策略通过组合多个成熟的技术指标,构建了一个完整的交易系统。系统的优势在于其多层次的信号确认机制和基于波动率的风险管理,但仍需要在实际应用中根据具体市场特征进行优化。通过建议的优化方向,可以进一步提高策略的稳定性和适应性。
策略源码
/*backtest
start: 2019-12-23 08:00:00
end: 2024-12-10 08:00:00
period: 1d
basePeriod: 1d
exchanges: [{"eid":"Futures_Binance","currency":"BTC_USDT"}]
*/

//@version=5
strategy("G-Channel with EMA Strategy and ATR SL/TP", shorttitle="G-EMA-ATR", overlay=true)

// Input parameters
length = input.int(100, title="G-Channel Length")
src = input.source(close, title="Source")
ema_length = input.int(50, title="EMA Length")  // EMA length
atr_length = input.int(14, title="ATR Length")  // ATR length

// G-Channel calculation
var float a = na
var float b = na
a := math.max(src, nz(a[1])) - nz(a[1] - b[1]) / length
b := math.min(src, nz(b[1])) + nz(a[1] - b[1]) / length
avg = (a + b) / 2

// G-Channel cross conditions
crossup = b[1] < close[1] and b > close
crossdn = a[1] < close[1] and a > close
bullish = ta.barssince(crossdn) <= ta.barssince(crossup)
c = bullish ? color.lime : color.red

// EMA calculation
ema_value = ta.ema(src, ema_length)

// ATR calculation
atr_value = ta.atr(atr_length)

// Plot G-Channel average and Close price
p1 = plot(avg, "G-Channel Average", color=c, linewidth=1, transp=90)
p2 = plot(close, "Close Price", color=c, linewidth=1, transp=100)
fill(p1, p2, color=c, transp=90)

// Plot EMA
plot(ema_value, color=color.blue, linewidth=2, title="EMA")

// Buy and Sell conditions
buy_condition = bullish and close < ema_value
sell_condition = not bullish and close > ema_value

// Track the last signal state
var bool last_was_buy = false
var bool last_was_sell = false

// ATR-based SL and TP calculations
long_sl = close - 2 * atr_value  // 2 ATR below the entry for SL
long_tp = close + 4 * atr_value  // 4 ATR above the entry for TP
short_sl = close + 2 * atr_value // 2 ATR above the entry for SL (short)
short_tp = close - 4 * atr_value // 4 ATR below the entry for TP (short)

// Generate Buy signal only if the last signal was not Buy
if (buy_condition and not last_was_buy)
    strategy.entry("Buy", strategy.long)
    strategy.exit("Exit Buy", from_entry="Buy", stop=long_sl, limit=long_tp)
    last_was_buy := true
    last_was_sell := false

// Generate Sell signal only if the last signal was not Sell
if (sell_condition and not last_was_sell)
    strategy.entry("Sell", strategy.short)
    strategy.exit("Exit Sell", from_entry="Sell", stop=short_sl, limit=short_tp)
    last_was_sell := true
    last_was_buy := false

// Plot shapes for Buy and Sell signals
plotshape(series=buy_condition and not last_was_buy, location=location.belowbar, style=shape.labelup, color=color.lime, size=size.small, text="Buy", textcolor=color.white)
plotshape(series=sell_condition and not last_was_sell, location=location.abovebar, style=shape.labeldown, color=color.red, size=size.small, text="Sell", textcolor=color.white)
相关推荐