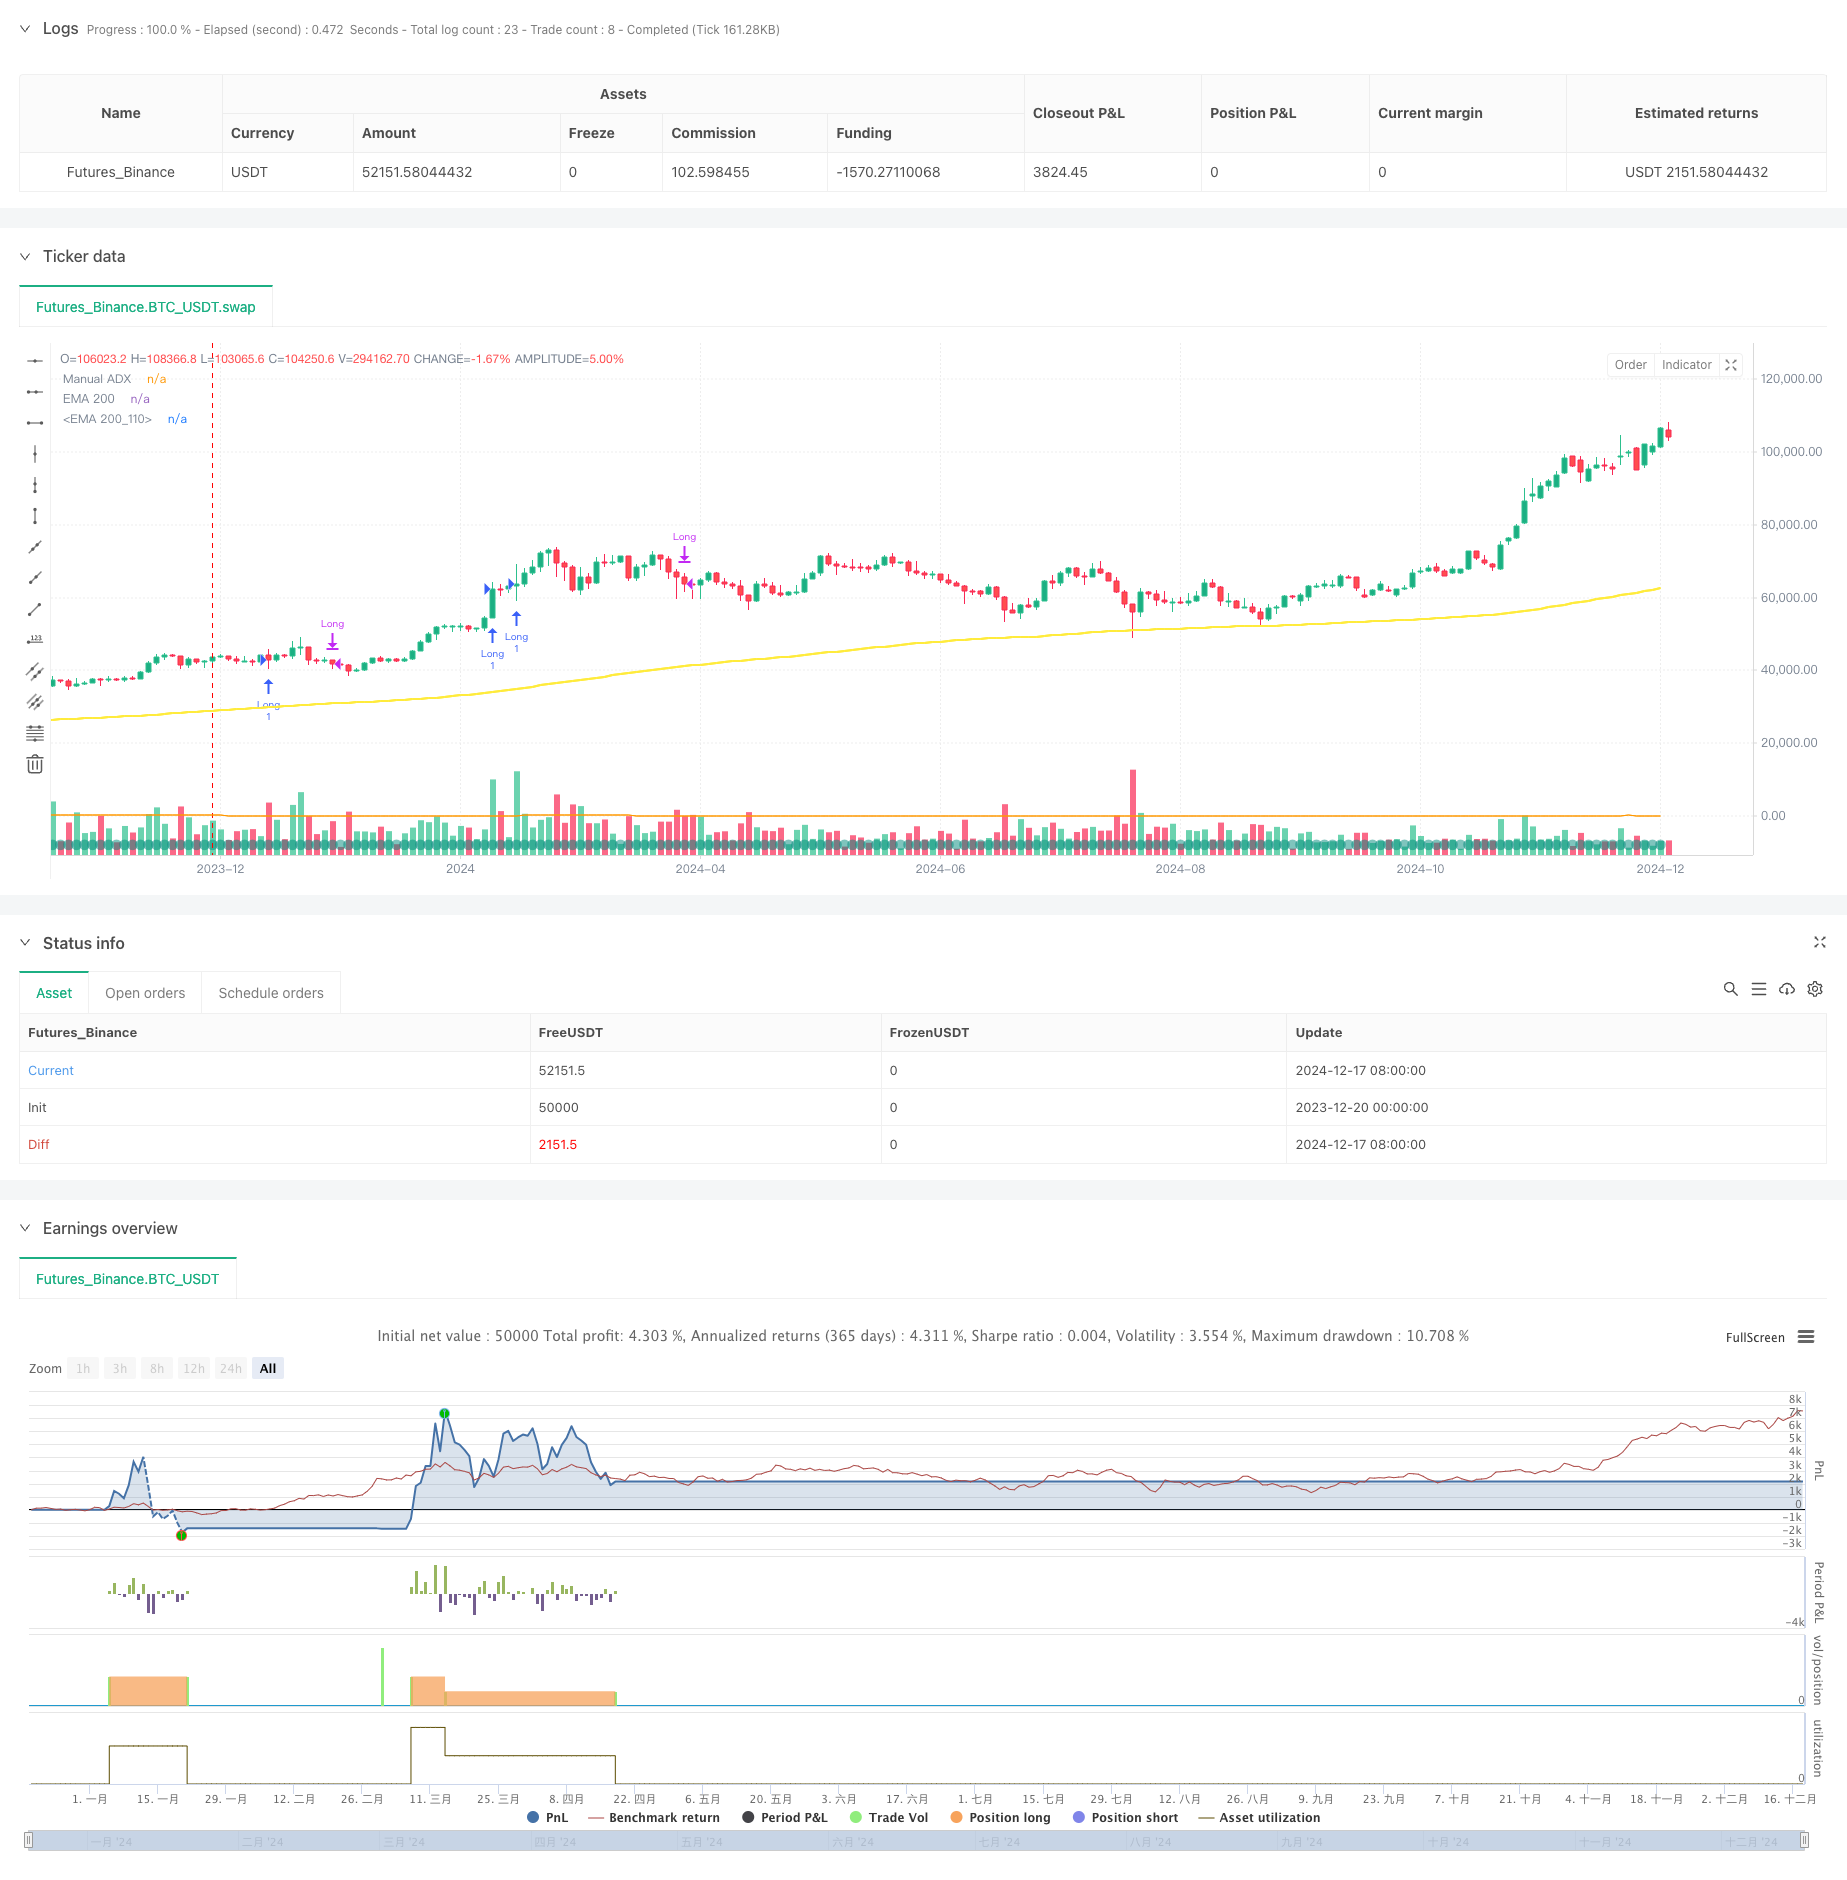
概述
本策略是一个结合趋势跟踪和震荡交易的混合策略系统,通过多重技术指标筛选和严格的资金管理来实现稳健的交易。策略采用分步止盈方式锁定利润,同时设置了最大回撤控制,在保证收益的同时也控制风险。系统使用RSI动量指标和ADX趋势强度指标作为主要的交易信号触发条件,并结合交易量、ATR和EMA等多重过滤器来确保交易的有效性。
策略原理
策略的核心逻辑包括以下几个关键要素: 1. 入场条件要求同时满足:交易量大于100万、ADX大于25表明趋势明显、RSI大于60显示强势动量、ATR大于2确保足够的波动空间、价格在200日均线上方保持上升趋势。 2. 分步止盈设计:首次止盈位于15%,平仓50%仓位;第二次止盈位于30%,平掉剩余仓位。这种设计既能及早锁定部分利润,又不会错过大趋势。 3. 止损控制:设置15%的止损位保护资金,同时当RSI低于50或价格跌破200均线时平仓出场。 4. 回撤管理:实时跟踪策略净值,当回撤超过30%时触发系统性风控,清空所有持仓。
策略优势
- 多重技术指标交叉验证,提高交易信号的可靠性
- 分步止盈设计兼顾了短期获利和把握大趋势的需求
- 完善的风险控制体系,包括个股止损和系统性风控
- 交易条件严格,能有效过滤虚假信号
- 策略逻辑清晰,便于根据市场情况调整参数
策略风险
- 多重指标过滤可能导致错过部分交易机会
- 在震荡市场中可能频繁触发止损
- 固定百分比的止损和止盈设置可能不适合所有市场环境
- 策略依赖技术指标,在基本面突发事件时可能反应不足
- 需要较大的资金规模来满足交易量要求
策略优化方向
- 引入自适应的止损止盈机制,根据市场波动度动态调整
- 增加市场环境判断模块,在不同市场条件下使用不同的参数设置
- 优化ADX计算方法,考虑使用自适应周期
- 加入交易成本考虑,优化仓位管理系统
- 开发基于机器学习的信号过滤机制
总结
该策略是一个全面的交易系统,通过多重技术指标和严格的资金管理来实现稳健的交易。策略的核心优势在于其完善的风险控制体系和分步止盈机制,但同时也需要注意在实际应用中根据市场情况适时调整参数设置。策略的进一步优化空间主要在于参数的动态自适应和信号筛选机制的改进。
策略源码
/*backtest
start: 2023-12-20 00:00:00
end: 2024-12-18 08:00:00
period: 2d
basePeriod: 2d
exchanges: [{"eid":"Futures_Binance","currency":"BTC_USDT"}]
*/

//@version=5
strategy(title="Swing Strategy (<30% DD)", shorttitle="SwingStratDD", overlay=true)

//-----------------------------------------------------
// Example Indicators and Logic
//-----------------------------------------------------
emaLen   = input.int(200, "EMA Length", minval=1)
emaValue = ta.ema(close, emaLen)

plot(emaValue, color=color.yellow, linewidth=2, title="EMA 200")


//-----------------------------------------------------
// User Inputs
//-----------------------------------------------------
adxLen           = input.int(14,  "ADX Length",      minval=1)
rsiLen           = input.int(14,  "RSI Length",      minval=1)
atrLen           = input.int(14,  "ATR Length",      minval=1)

rsiBuyThresh     = input.float(60, "RSI Buy Threshold",     minval=1, maxval=100)
adxThresh        = input.float(25, "ADX Threshold (Trend)", minval=1, maxval=100)
minVolume        = input.float(1e6,"Minimum Volume",         minval=1)
minATR           = input.float(2,  "Minimum ATR(14)",        minval=0.1, step=0.1)

stopLossPerc     = input.float(15, "Stop-Loss %",            minval=0.1, step=0.1)
// We’ll do two partial take-profit levels to aim for consistent cashflow:
takeProfit1Perc  = input.float(15, "Take-Profit1 %",         minval=0.1, step=0.1)
takeProfit2Perc  = input.float(30, "Take-Profit2 %",         minval=0.1, step=0.1)

ddLimit          = input.float(30, "Max Drawdown %",         minval=0.1, step=0.1)

//-----------------------------------------------------
// Indicators
//-----------------------------------------------------

rsiValue = ta.rsi(close, rsiLen)
atrValue = ta.atr(atrLen)

//--- Fully Manual ADX Calculation ---
upMove      = high - high[1]
downMove    = low[1] - low
plusDM      = (upMove > downMove and upMove > 0) ? upMove : 0.0
minusDM     = (downMove > upMove and downMove > 0) ? downMove : 0.0
smPlusDM    = ta.rma(plusDM, adxLen)
smMinusDM   = ta.rma(minusDM, adxLen)
smTR        = ta.rma(ta.tr, adxLen)
plusDI      = (smPlusDM / smTR) * 100
minusDI     = (smMinusDM / smTR) * 100
dx          = math.abs(plusDI - minusDI) / (plusDI + minusDI) * 100
adxValue    = ta.rma(dx, adxLen)

//-----------------------------------------------------
// Screener-Like Conditions (Technical Only)
//-----------------------------------------------------
volumeCondition   = volume > minVolume
adxCondition      = adxValue > adxThresh
rsiCondition      = rsiValue > rsiBuyThresh
atrCondition      = atrValue > minATR
aboveEmaCondition = close > emaValue

longCondition = volumeCondition and adxCondition and rsiCondition and atrCondition and aboveEmaCondition

//-----------------------------------------------------
// Strategy Entry / Exit Logic
//-----------------------------------------------------
var bool inTrade = false

// Entry
if longCondition and not inTrade
    strategy.entry("Long", strategy.long)

// Basic Exit Condition: RSI < 50 or Price < EMA
exitCondition = (rsiValue < 50) or (close < emaValue)
if inTrade and exitCondition
    strategy.close("Long")

// Update inTrade status
inTrade := strategy.position_size > 0

//-----------------------------------------------------
// Multi-Level Stop-Loss & Partial Profits
//-----------------------------------------------------
if inTrade
    float entryPrice = strategy.position_avg_price

    // Stop-Loss
    float stopPrice     = entryPrice * (1 - stopLossPerc / 100)

    // Two partial take-profit levels
    float tp1Price      = entryPrice * (1 + takeProfit1Perc / 100)
    float tp2Price      = entryPrice * (1 + takeProfit2Perc / 100)

    // Example approach: exit half at TP1, half at TP2
    strategy.exit("TP1/SL",     from_entry="Long", stop=stopPrice,    limit=tp1Price, qty_percent=50)
    strategy.exit("TP2",        from_entry="Long", limit=tp2Price,    qty_percent=50)

//-----------------------------------------------------
// Dynamic Drawdown Handling
//-----------------------------------------------------
var float peakEquity = strategy.equity
peakEquity := math.max(peakEquity, strategy.equity)

currentDrawdownPerc = (peakEquity - strategy.equity) / peakEquity * 100
if currentDrawdownPerc > ddLimit
    strategy.close_all("Max Drawdown Exceeded")

//-----------------------------------------------------
// Plotting
//-----------------------------------------------------
plot(emaValue, title="EMA 200", color=color.yellow, linewidth=2)
plotchar(rsiValue, title="RSI", char='●', location=location.bottom, color=color.new(color.teal, 50))
plot(adxValue, title="Manual ADX", color=color.orange)
相关推荐