概述
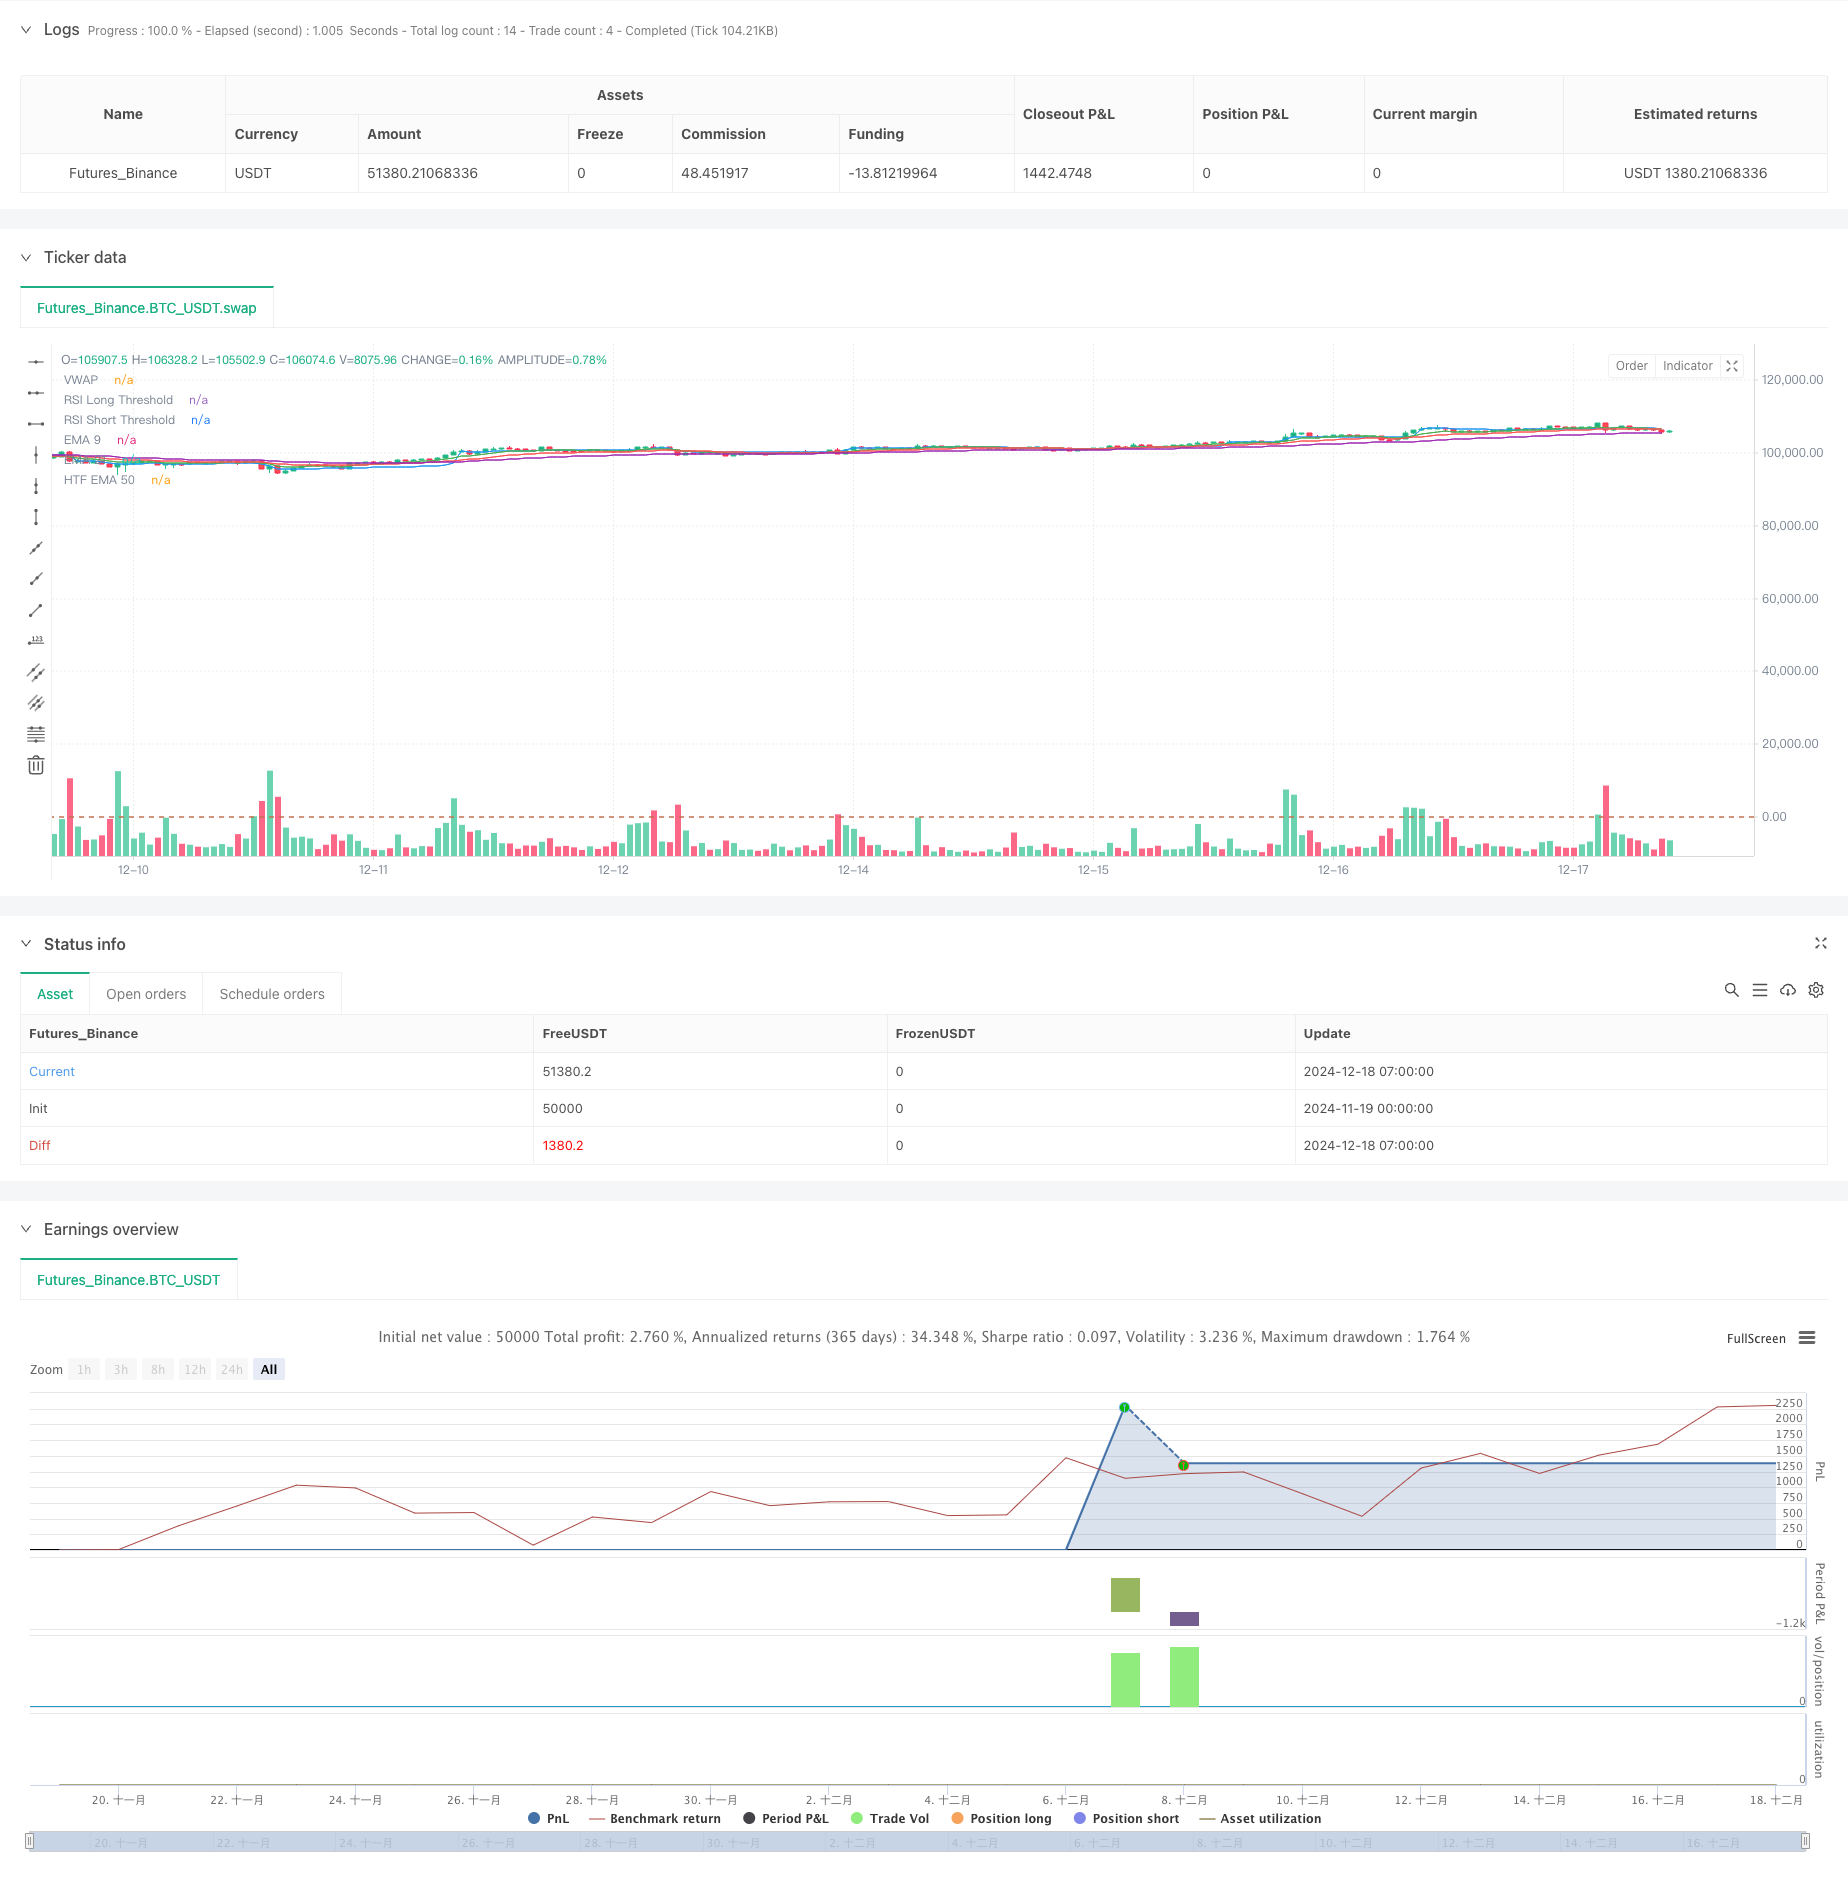
本策略是一个基于多重技术指标滤网的趋势突破交易系统。它综合运用了指数移动平均线(EMA)、成交量加权平均价格(VWAP)、相对强弱指数(RSI)、平均趋向指数(ADX)等多个技术指标,通过多重信号确认来过滤假突破,提高交易的准确性。该策略还结合了更高时间周期的趋势判断,并采用基于ATR的动态止损止盈方案,实现了风险的有效控制。
策略原理
策略的核心逻辑基于以下几个关键要素: 1. 趋势判断系统:使用9周期和21周期的EMA交叉来捕捉短期趋势变化,同时参考15分钟周期的50周期EMA来确认更大的趋势方向。 2. 价格动量确认:使用RSI指标进行动量确认,多头要求RSI>55,空头要求RSI<45。 3. 趋势强度验证:引入ADX指标判断趋势强度,要求ADX>25以确保趋势的有效性。 4. 价格位置验证:使用VWAP作为价格位置的参考,要求价格在正确的VWAP位置。 5. 成交量确认:要求交易量大于10周期平均成交量的1.5倍,确保市场有足够的参与度。 6. 风险管理:基于账户总值的固定比例和ATR动态计算持仓规模,使用1.5倍ATR作为止损,3倍ATR作为止盈。
策略优势
- 多重信号确认机制大大降低了虚假信号的干扰。
- 结合高低时间周期分析,提高了趋势判断的准确性。
- 动态的仓位管理和止损止盈设置,实现了对风险的良好控制。
- 利用成交量突破作为交易确认,提高了交易的可靠性。
- 策略参数可调节性强,便于根据不同市场情况进行优化。
策略风险
- 多重滤网可能导致错过一些有效的交易机会。
- 在震荡市场中可能产生频繁的交易信号。
- 参数优化可能导致过度拟合历史数据。
- 高波动性市场中ATR止损可能过大。
策略优化方向
- 引入自适应参数机制,根据市场状态动态调整各项参数。
- 增加市场环境识别模块,在不同市场环境下使用不同的参数组合。
- 加入交易时间过滤,避开波动较大的时段。
- 优化止损止盈比例,可考虑根据市场波动度动态调整。
- 增加趋势强度的分级判断,在不同强度下采用不同的仓位管理策略。
总结
该策略通过多重技术指标的协同配合,构建了一个相对完整的交易系统。其核心优势在于通过多维度的信号确认来提高交易的准确性,同时采用科学的风险管理方法来保护资金安全。虽然存在一定的局限性,但通过持续优化和改进,该策略有望在实际交易中取得稳定的收益。
策略源码
/*backtest
start: 2024-11-19 00:00:00
end: 2024-12-18 08:00:00
period: 1h
basePeriod: 1h
exchanges: [{"eid":"Futures_Binance","currency":"BTC_USDT"}]
*/

//@version=5
strategy("Trend-Filtered Scalping Strategy", overlay=true, shorttitle="TFSS")

// Inputs
emaShort     = input.int(9, title="EMA Short", minval=1)
emaLong      = input.int(21, title="EMA Long", minval=1)
rsiLength    = input.int(14, title="RSI Length", minval=1)
atrLength    = input.int(14, title="ATR Length", minval=1)
adxLength    = input.int(20, title="ADX Length", minval=1)
adxSmoothing = input.int(14, title="ADX Smoothing", minval=1)
volMultiplier = input.float(1.5, title="Volume Spike Multiplier", minval=1.0)
riskPercent  = input.float(1, title="Risk % of Equity", minval=0.1, step=0.1)

// Higher Time Frame for Trend Filter
htfTimeframe = input.timeframe("15", title="Higher Time Frame")
ema50HTF     = request.security(syminfo.tickerid, htfTimeframe, ta.ema(close, 50))

// Indicators
ema9  = ta.ema(close, emaShort)
ema21 = ta.ema(close, emaLong)
vwap  = ta.vwap(close)
rsi   = ta.rsi(close, rsiLength)
atr   = ta.atr(atrLength)
volAvg = ta.sma(volume, 10)

// ADX Calculation with Smoothing
[_, _, adx] = ta.dmi(adxLength, adxSmoothing)

// Entry Conditions
longCondition = (ta.crossover(ema9, ema21) and close > vwap and rsi > 55 and adx > 25 and close > ema50HTF and volume > volAvg * volMultiplier)
shortCondition = (ta.crossunder(ema9, ema21) and close < vwap and rsi < 45 and adx > 25 and close < ema50HTF and volume > volAvg * volMultiplier)

// Position Sizing Based on Risk %
capitalPerTrade = (strategy.equity * (riskPercent / 100)) / atr
longStop  = close - 1.5 * atr
longTarget = close + 3 * atr
shortStop = close + 1.5 * atr
shortTarget = close - 3 * atr

// Entry Logic
if longCondition and not strategy.opentrades
    strategy.entry("Long", strategy.long, qty=capitalPerTrade)
    strategy.exit("Exit Long", from_entry="Long", stop=longStop, limit=longTarget)

if shortCondition and not strategy.opentrades
    strategy.entry("Short", strategy.short, qty=capitalPerTrade)
    strategy.exit("Exit Short", from_entry="Short", stop=shortStop, limit=shortTarget)

// Alerts
alertcondition(longCondition, title="Long Entry Alert", message="Long Condition Triggered!")
alertcondition(shortCondition, title="Short Entry Alert", message="Short Condition Triggered!")

// Plot Indicators
plot(ema9, title="EMA 9", color=color.green)
plot(ema21, title="EMA 21", color=color.red)
plot(vwap, title="VWAP", color=color.blue)
plot(ema50HTF, title="HTF EMA 50", color=color.purple)
hline(55, "RSI Long Threshold", color=color.green)
hline(45, "RSI Short Threshold", color=color.red)
相关推荐