概述
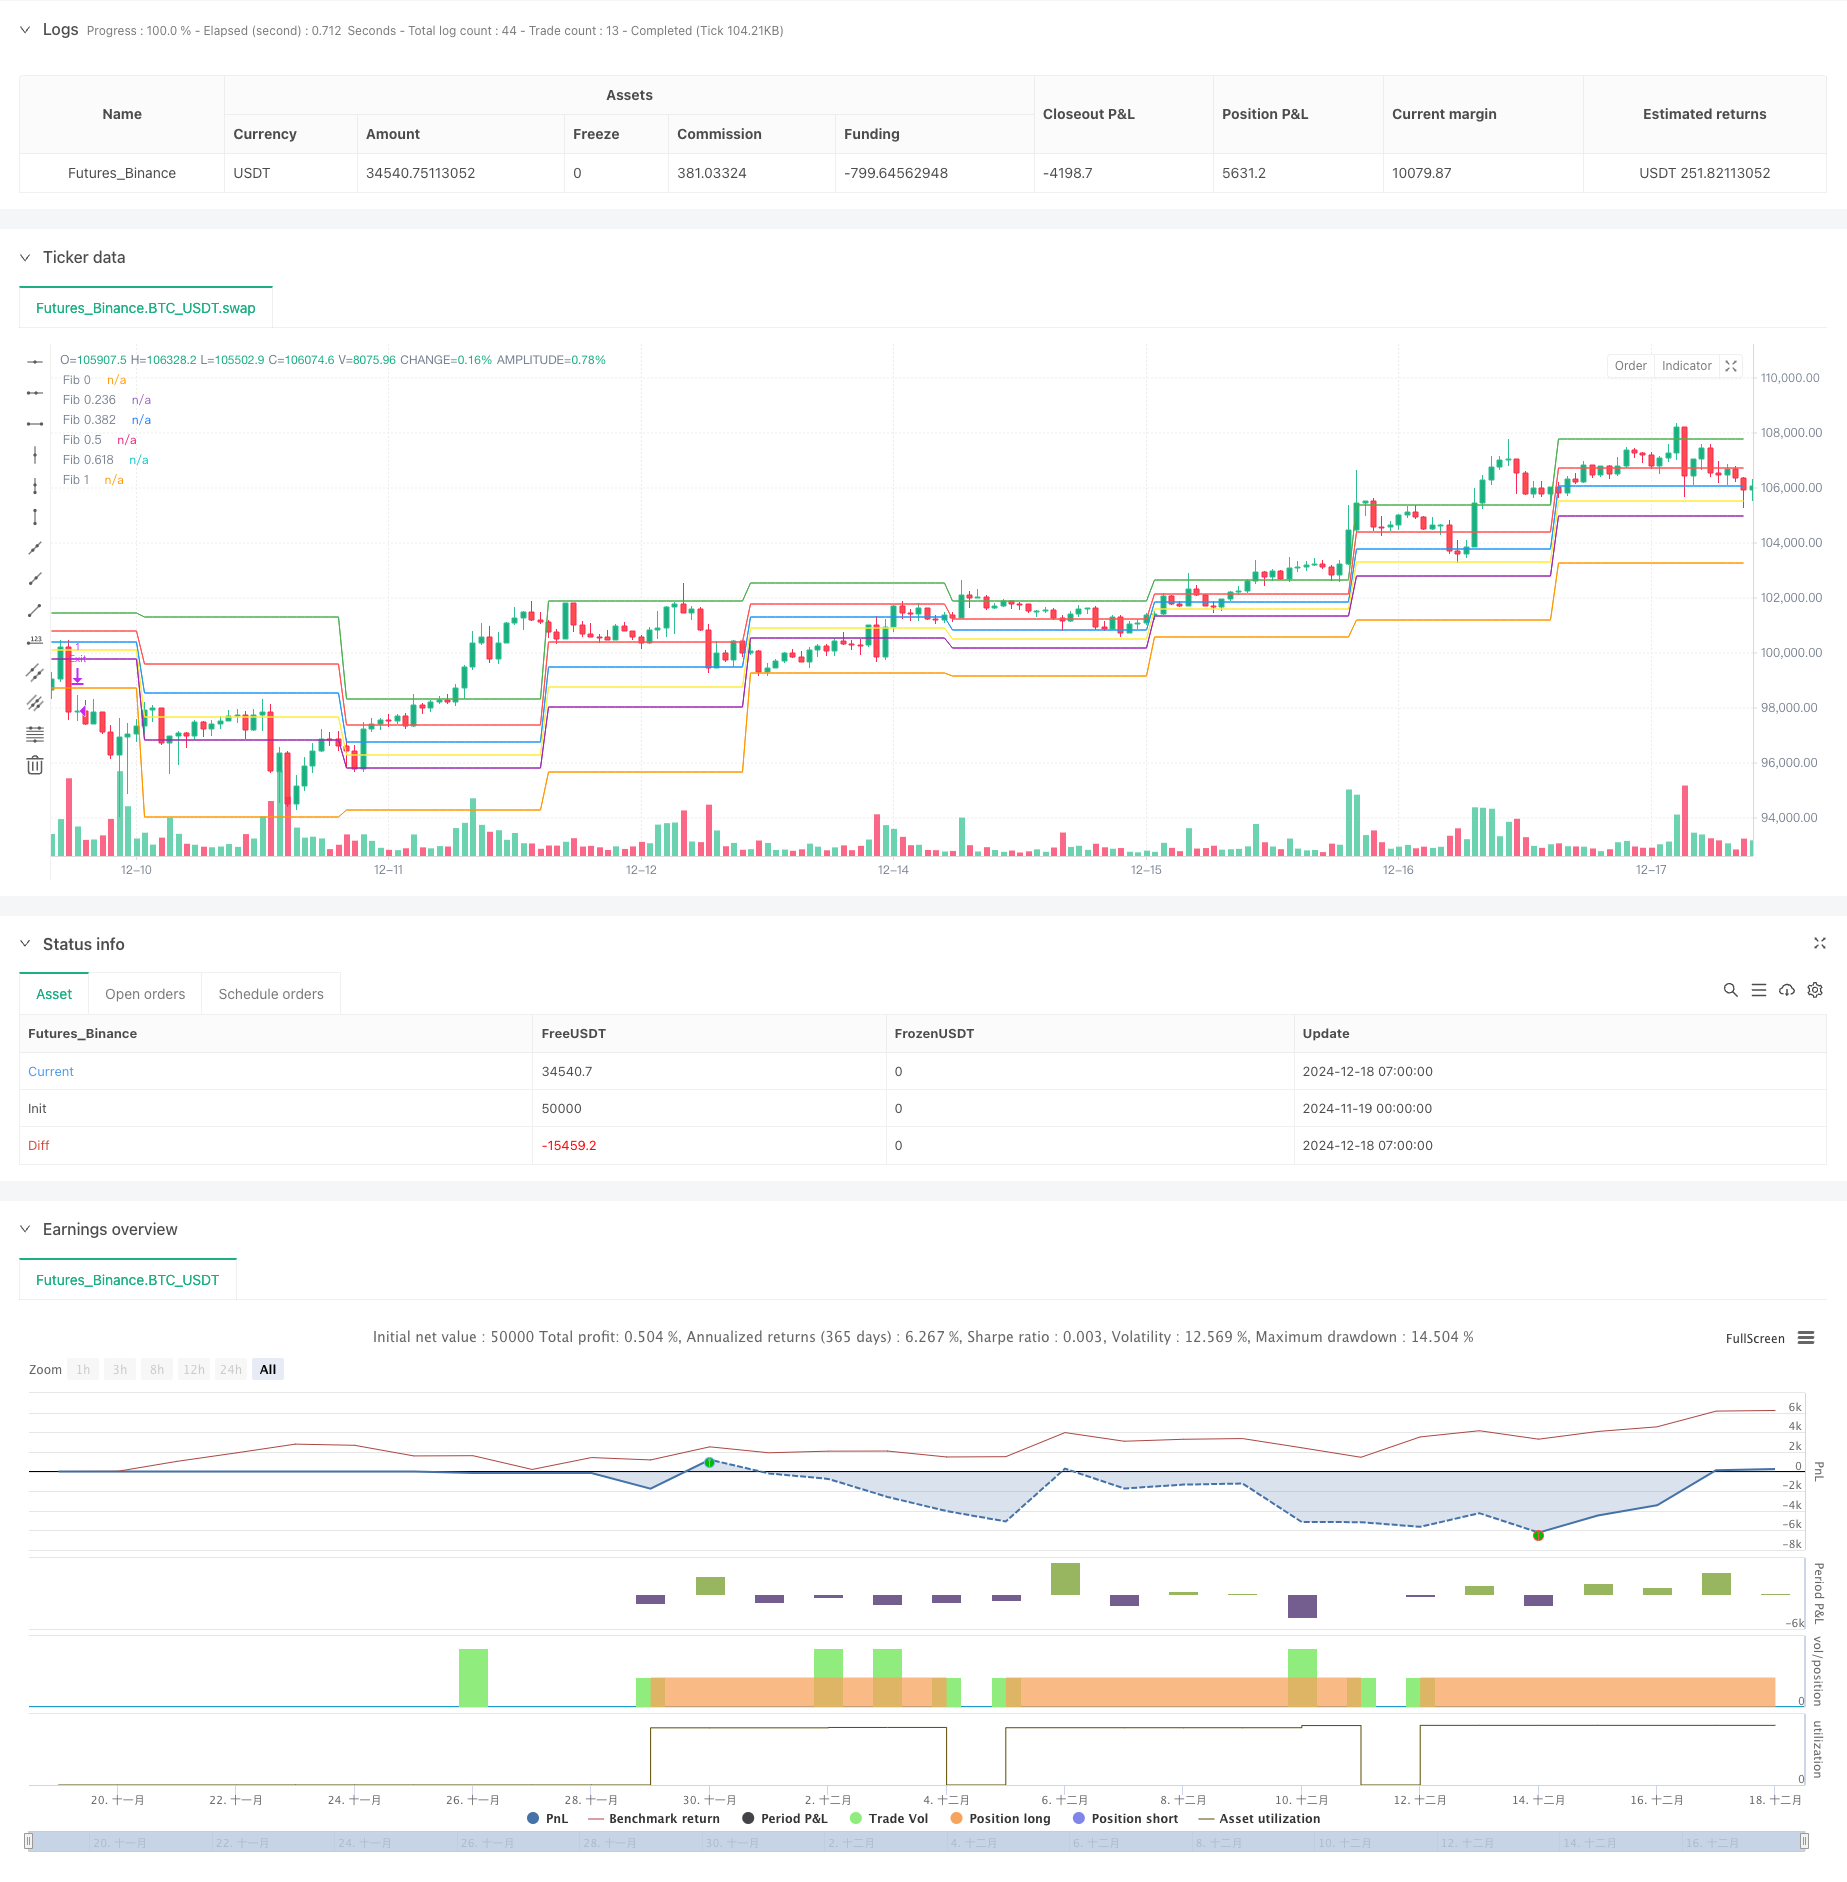
本策略是一个基于斐波那契回撤水平的趋势跟踪策略。策略主要利用前一交易日的最高价和最低价计算关键的斐波那契回撤水平,结合开盘价位置和时间窗口设置多个进场条件,并针对不同条件设置相应的止损位置,从而实现对趋势的把握和风险的控制。
策略原理
策略首先计算六个关键的斐波那契回撤水平(0、23.6%、38.2%、50%、61.8%和100%)。根据开盘价格相对这些水平的位置,将进场条件分为三种情况:1)开盘价在23.6%-50%之间;2)开盘价在61.8%且在指定时间窗口(9:15-9:30);3)开盘价低于23.6%且低于前日低点。针对这三种情况分别设置不同的止损位置:61.8%回撤位、61.8%-100%回撤中点、38.2%回撤位,形成了一个完整的交易系统。
策略优势
- 利用斐波那契回撤水平作为关键支撑阻力位,这些水平在市场中具有较强的指导意义。
- 结合时间窗口和价格位置的多重条件判断,提高了策略的准确性。
- 针对不同情况设置相应的止损位置,体现了风险管理的灵活性。
- 策略逻辑清晰,参数可调整性强,便于根据不同市场情况进行优化。
策略风险
- 斐波那契回撤水平的有效性可能受市场环境影响而降低。
- 固定时间窗口的设置可能错过其他时间段的良好机会。
- 止损位置的设置可能在剧烈波动时被轻易触及。
- 策略未考虑市场整体趋势,可能在横盘或震荡市场中频繁交易。
策略优化方向
- 引入趋势判断指标(如均线系统),在趋势明确时才执行交易。
- 增加波动率指标(如ATR),动态调整止损位置。
- 加入交易量分析,提高价格突破的可信度。
- 优化时间窗口的设置,可考虑根据历史数据分析最佳交易时间段。
- 增加利润目标,实现更完善的获利了结机制。
总结
该策略通过结合斐波那契回撤水平、时间窗口和多重条件判断,构建了一个较为完整的交易系统。策略的优势在于逻辑清晰、风险可控,但仍需要根据市场情况进行优化和改进。通过增加趋势判断、动态止损和交易量分析等方面的优化,可以进一步提高策略的稳定性和盈利能力。
策略源码
/*backtest
start: 2024-11-19 00:00:00
end: 2024-12-18 08:00:00
period: 1h
basePeriod: 1h
exchanges: [{"eid":"Futures_Binance","currency":"BTC_USDT"}]
*/

//@version=6
strategy("Fibonacci Retracement Strategy", overlay=true)

// Get the high and low of the previous day
previousHigh = request.security(syminfo.tickerid, "D", high[1])
previousLow = request.security(syminfo.tickerid, "D", low[1])

// Fibonacci levels for the previous day (from high to low)
fib0 = previousHigh
fib236 = previousHigh - (previousHigh - previousLow) * 0.236
fib382 = previousHigh - (previousHigh - previousLow) * 0.382
fib50 = previousHigh - (previousHigh - previousLow) * 0.5
fib618 = previousHigh - (previousHigh - previousLow) * 0.618
fib1 = previousHigh - (previousHigh - previousLow) * 1

// Current open price (for the current day)
openPrice = open

// Time for 9:15 AM check
timeStart = timestamp(year, month, dayofmonth, 9, 15)
timeClose = timestamp(year, month, dayofmonth, 9, 30) // Time window to allow for opening range

// Entry Conditions
buyCondition1 = openPrice >= fib236 and openPrice <= fib50
buyCondition2 = openPrice == fib618 and time >= timeStart and time <= timeClose
buyCondition3 = openPrice < fib236 and openPrice < previousLow

// Stop Loss based on conditions
stopLoss1 = fib618
stopLoss2 = fib618 - (fib618 - fib1) / 2
stopLoss3 = fib382

// Plot Fibonacci levels with calculated values
plot(fib0, color=color.green, linewidth=1, title="Fib 0")
plot(fib236, color=color.red, linewidth=1, title="Fib 0.236")
plot(fib382, color=color.blue, linewidth=1, title="Fib 0.382")
plot(fib50, color=color.yellow, linewidth=1, title="Fib 0.5")
plot(fib618, color=color.purple, linewidth=1, title="Fib 0.618")
plot(fib1, color=color.orange, linewidth=1, title="Fib 1")

// Plot labels for Fibonacci levels with actual values
label.new(x=bar_index, y=fib0, text="Fib 0: " + str.tostring(fib0), style=label.style_label_right, color=color.green, textcolor=color.white, size=size.small, yloc=yloc.abovebar)
label.new(x=bar_index, y=fib236, text="Fib 0.236: " + str.tostring(fib236), style=label.style_label_right, color=color.red, textcolor=color.white, size=size.small, yloc=yloc.abovebar)
label.new(x=bar_index, y=fib382, text="Fib 0.382: " + str.tostring(fib382), style=label.style_label_right, color=color.blue, textcolor=color.white, size=size.small, yloc=yloc.abovebar)
label.new(x=bar_index, y=fib50, text="Fib 0.5: " + str.tostring(fib50), style=label.style_label_right, color=color.yellow, textcolor=color.white, size=size.small, yloc=yloc.abovebar)
label.new(x=bar_index, y=fib618, text="Fib 0.618: " + str.tostring(fib618), style=label.style_label_right, color=color.purple, textcolor=color.white, size=size.small, yloc=yloc.abovebar)
label.new(x=bar_index, y=fib1, text="Fib 1: " + str.tostring(fib1), style=label.style_label_right, color=color.orange, textcolor=color.white, size=size.small, yloc=yloc.abovebar)

// Entry conditions and strategy execution
if (buyCondition1)
    strategy.entry("Buy", strategy.long, stop=stopLoss1)
    label.new(bar_index, low, "BUY", color=color.green, textcolor=color.white, style=label.style_label_up, size=size.small)

if (buyCondition2)
    strategy.entry("Buy", strategy.long, stop=stopLoss2)
    label.new(bar_index, low, "BUY", color=color.green, textcolor=color.white, style=label.style_label_up, size=size.small)

if (buyCondition3)
    strategy.entry("Buy", strategy.long, stop=stopLoss3)
    label.new(bar_index, low, "BUY", color=color.green, textcolor=color.white, style=label.style_label_up, size=size.small)

// Show exit signals and labels
if (buyCondition1)
    strategy.exit("Exit", from_entry="Buy", stop=stopLoss1)
    label.new(bar_index, high, "EXIT", color=color.red, textcolor=color.white, style=label.style_label_down, size=size.small)

if (buyCondition2)
    strategy.exit("Exit", from_entry="Buy", stop=stopLoss2)
    label.new(bar_index, high, "EXIT", color=color.red, textcolor=color.white, style=label.style_label_down, size=size.small)

if (buyCondition3)
    strategy.exit("Exit", from_entry="Buy", stop=stopLoss3)
    label.new(bar_index, high, "EXIT", color=color.red, textcolor=color.white, style=label.style_label_down, size=size.small)
相关推荐