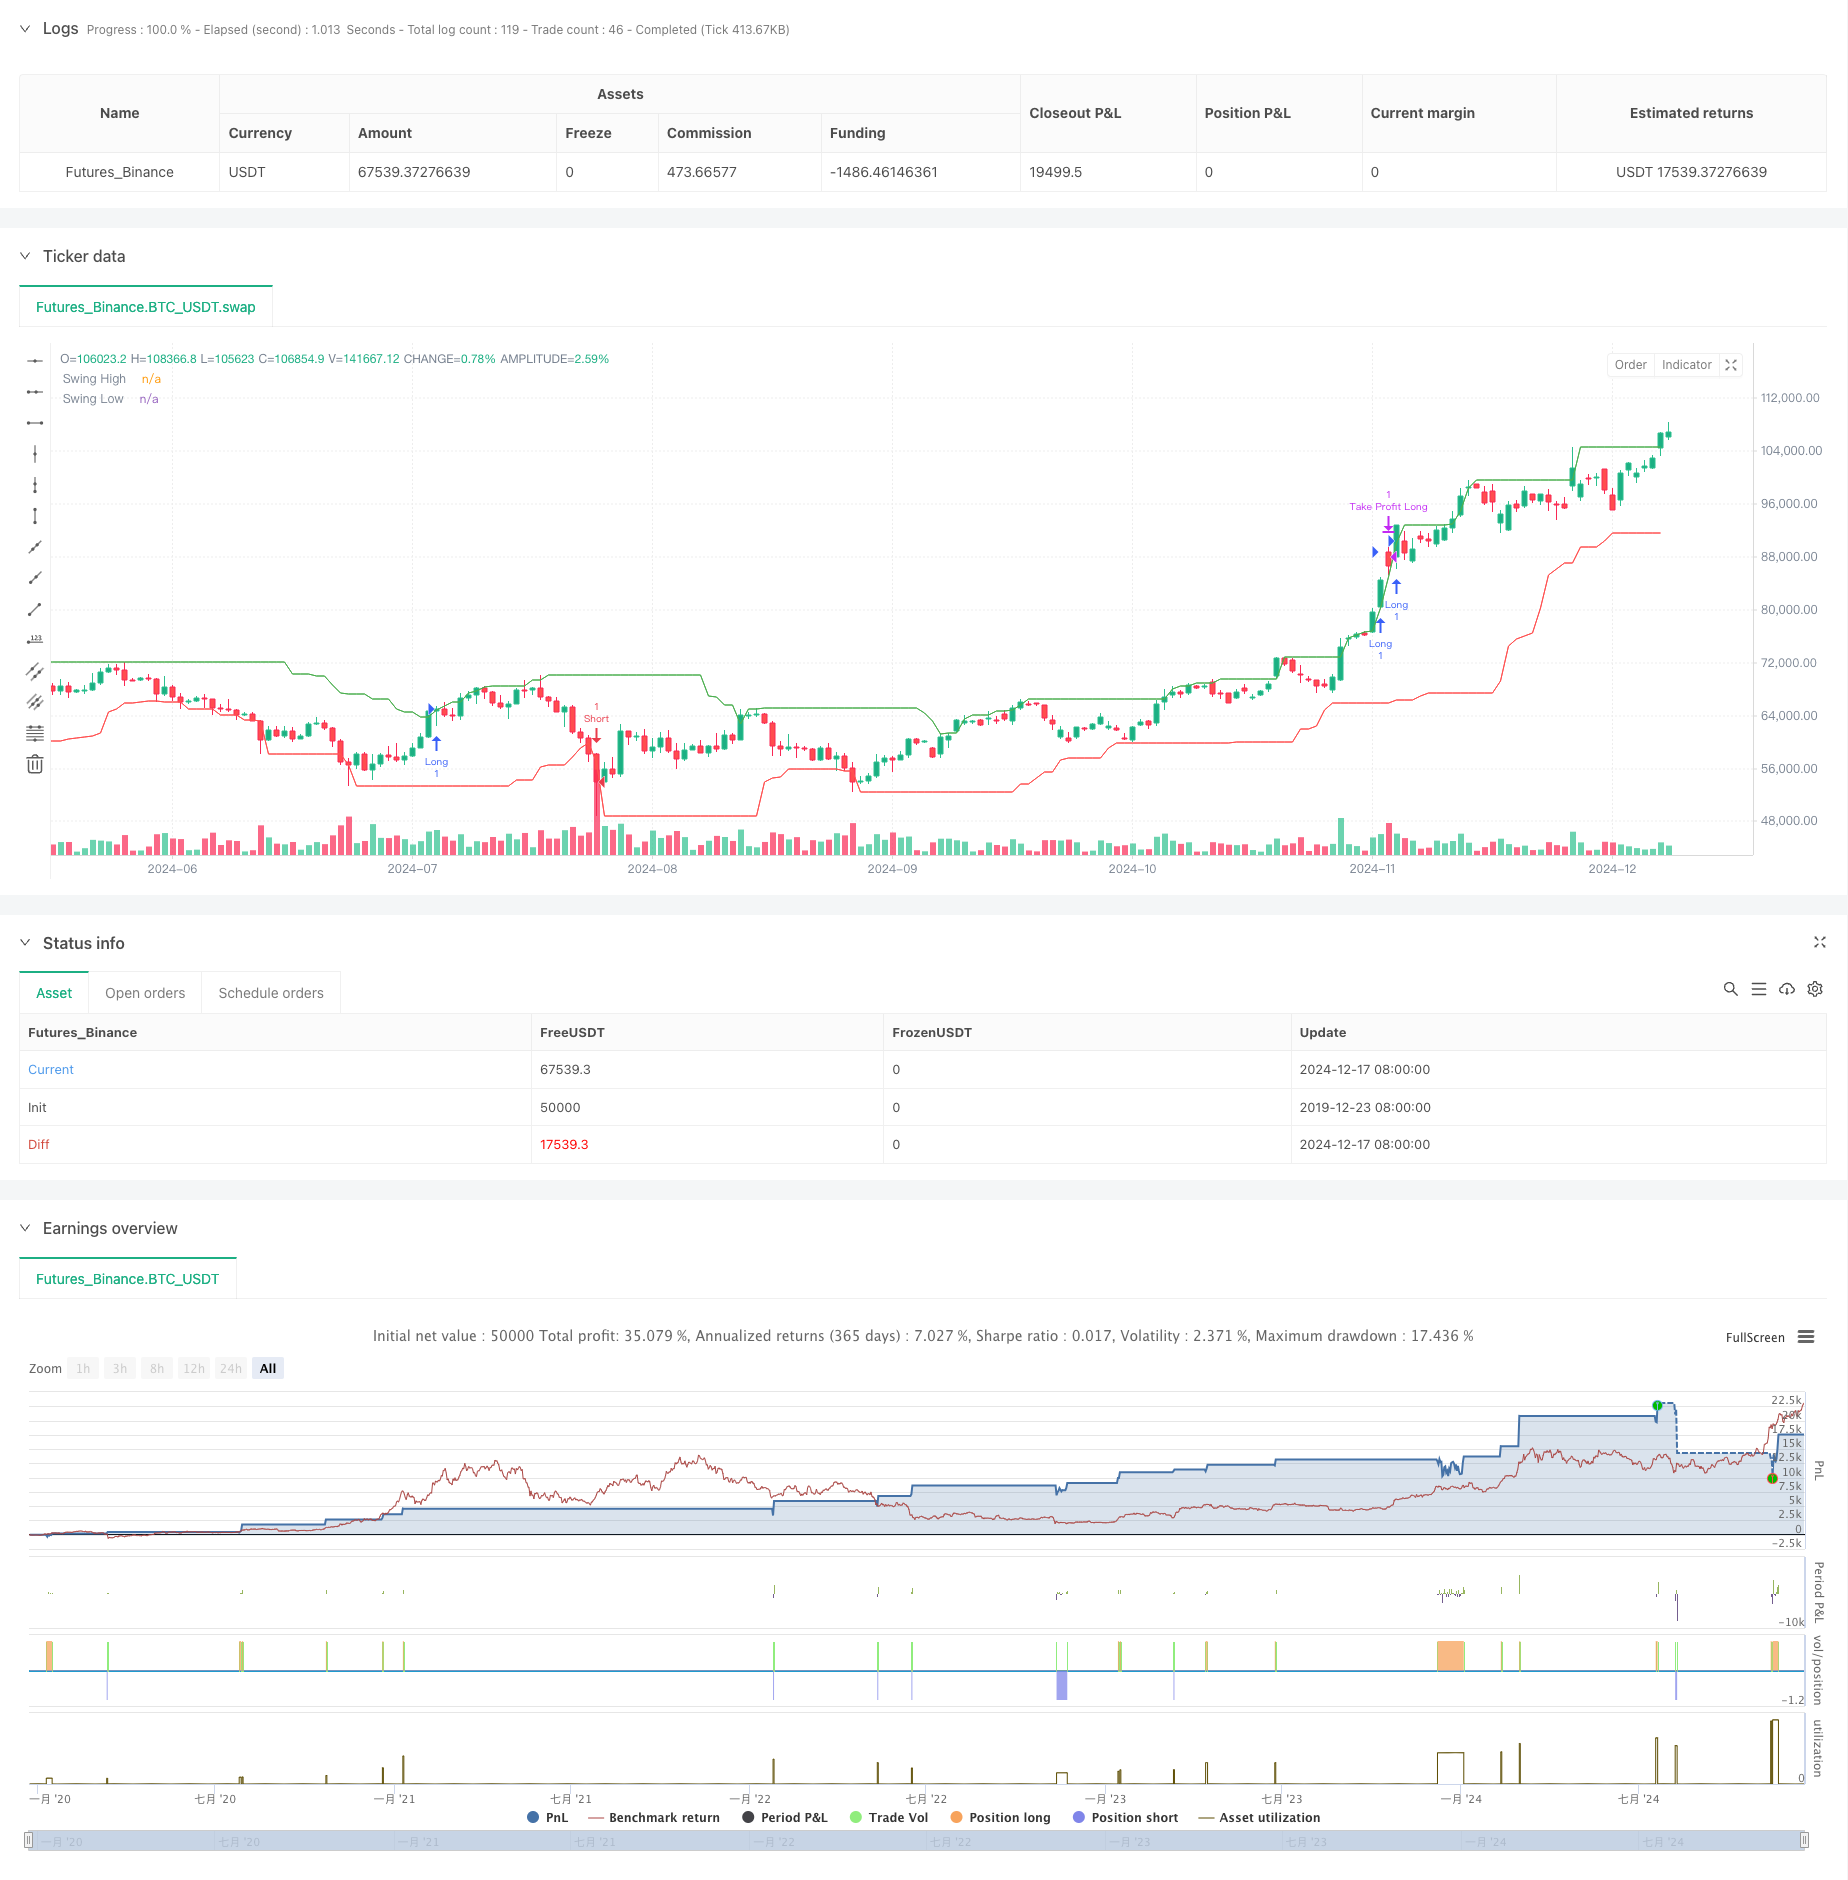
概述
这是一个基于突破结构(BOS)和成交量确认的智能交易策略。该策略通过监测价格突破前期高点或低点,并结合成交量放大确认,形成交易信号。策略采用了多重条件验证机制,包括连续确认次数要求和动态止盈止损设置,以提高交易的可靠性和风险控制能力。
策略原理
策略的核心逻辑包含以下几个关键要素: 1. 通过计算指定周期内的最高价和最低价来识别结构性高点和低点 2. 使用移动平均线计算成交量基准,判断当前成交量是否显著放大 3. 当价格突破前期高点且成交量放大时,累计多头确认次数 4. 当价格跌破前期低点且成交量放大时,累计空头确认次数 5. 只有在达到指定的确认次数后才会触发交易信号 6. 建仓后设置基于百分比的止盈止损价位
策略优势
- 多重条件验证机制提高了交易信号的可靠性
- 结合成交量指标,避免假突破带来的误判
- 使用连续确认机制,降低操作频率,提高胜率
- 采用动态止盈止损设置,根据入场价格自动调整退场位置
- 策略逻辑清晰,参数可调整性强,适应性好
策略风险
- 震荡市场可能频繁出现假突破,导致连续止损
- 剧烈波动行情下止损位可能不够及时
- 确认机制可能导致入场延迟,错过最佳价位
- 成交量判断标准固定,不能很好适应市场状态变化 解决方案:
- 引入市场波动率指标,动态调整参数
- 增加趋势过滤器,减少震荡市假信号
- 优化止损逻辑,提高止损的灵活性
- 设计自适应的成交量阈值计算方法
策略优化方向
- 增加趋势判断指标,如移动平均线系统,只在趋势方向交易
- 引入ATR指标动态调整止损距离,提高风控灵活性
- 设计波动率自适应的成交量阈值判断机制
- 加入时间过滤器,避开高风险时段
- 优化确认机制,在保证可靠性的同时提高入场时效性
总结
这是一个结合了技术分析经典理论和现代量化交易方法的策略系统。通过多重条件验证和严格的风险控制,策略具有较好的稳定性和可靠性。虽然存在一些需要优化的方面,但整体框架设计合理,具有良好的实战应用价值。通过建议的优化方向,策略的表现还可以进一步提升。
策略源码
/*backtest
start: 2019-12-23 08:00:00
end: 2024-12-18 08:00:00
period: 1d
basePeriod: 1d
exchanges: [{"eid":"Futures_Binance","currency":"BTC_USDT"}]
*/

//@version=5
strategy("BOS and Volume Strategy with Confirmation", overlay=true)

// Parameters
swingLength = input.int(20, title="Swing Length", minval=1)
volumeMultiplier = input.float(1.1, title="Volume Multiplier", step=0.1)
volumeSMA_length = input.int(10, title="Volume SMA Length", minval=1)
takeProfitPercentage = input.float(0.02, title="Take Profit Percentage", step=0.01)
stopLossPercentage = input.float(0.15, title="Stop Loss Percentage", step=0.01)  // New parameter for stop loss
atrLength = input.int(14, title="ATR Length")
confirmationBars = input.int(2, title="Confirmation Bars", minval=1)

// Calculate Swing Highs and Lows
swingHigh = ta.highest(high, swingLength)[1]
swingLow = ta.lowest(low, swingLength)[1]

// Calculate Volume Moving Average
volumeSMA = ta.sma(volume, volumeSMA_length)
highVolume = volume > (volumeSMA * volumeMultiplier)

// Break of Structure Detection with Confirmation
var int bullishCount = 0
var int bearishCount = 0

if (close > swingHigh and highVolume)
    bullishCount := bullishCount + 1
    bearishCount := 0
else if (close < swingLow and highVolume)
    bearishCount := bearishCount + 1
    bullishCount := 0
else
    bullishCount := 0
    bearishCount := 0

bullishBOSConfirmed = (bullishCount >= confirmationBars)
bearishBOSConfirmed = (bearishCount >= confirmationBars)

// Entry and Exit Conditions
var float entryPrice = na  // Declare entryPrice as a variable

if (bullishBOSConfirmed and strategy.position_size <= 0)
    entryPrice := close  // Use ':=' for assignment
    strategy.entry("Long", strategy.long)

if (strategy.position_size > 0)
    // Calculate stop loss price
    stopLossPrice = entryPrice * (1 - stopLossPercentage)
    strategy.exit("Take Profit Long", from_entry="Long", limit=entryPrice * (1 + takeProfitPercentage), stop=stopLossPrice)

if (bearishBOSConfirmed and strategy.position_size >= 0)
    entryPrice := close  // Use ':=' for assignment
    strategy.entry("Short", strategy.short)

if (strategy.position_size < 0)
    // Calculate stop loss price
    stopLossPrice = entryPrice * (1 + stopLossPercentage)
    strategy.exit("Take Profit Short", from_entry="Short", limit=entryPrice * (1 - takeProfitPercentage), stop=stopLossPrice)

// Plot Swing Highs and Lows for Visualization
plot(swingHigh, title="Swing High", color=color.green, linewidth=1)
plot(swingLow, title="Swing Low", color=color.red, linewidth=1)
相关推荐