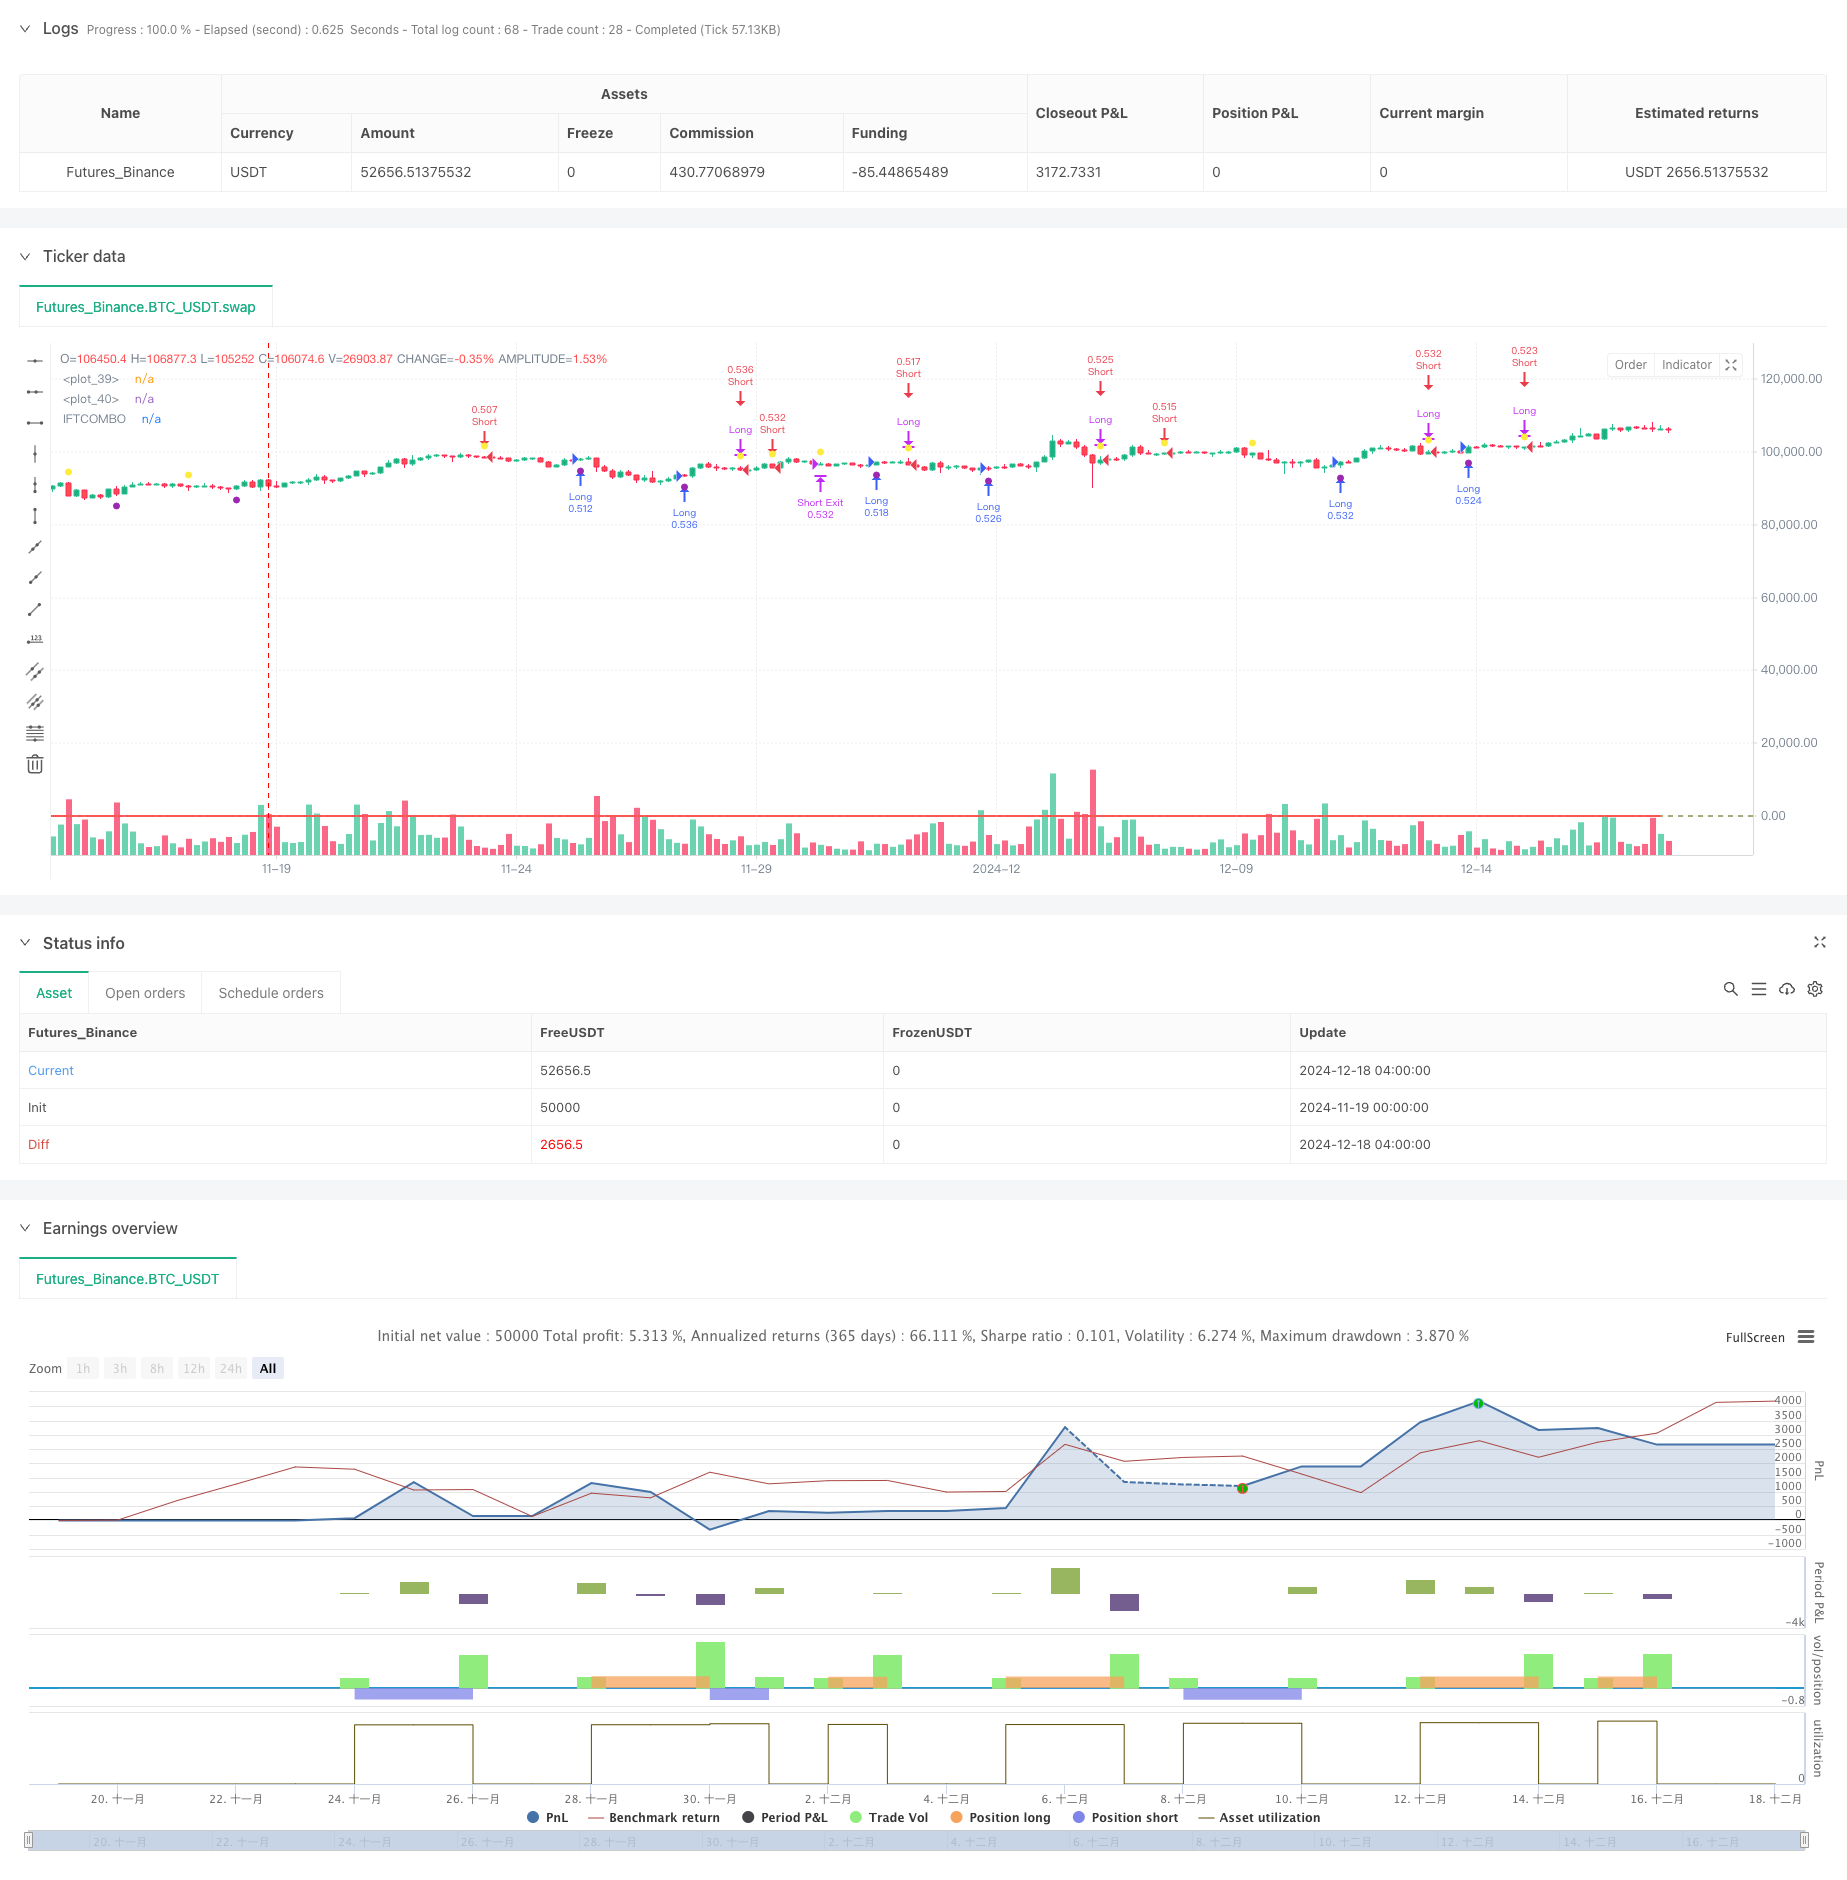
概述
该策略是一个基于多个技术指标组合的交易系统,通过整合CCI、RSI、随机指标(Stochastic)和MFI等四个主要指标,并结合指数平滑处理,构建了一个全面的市场分析框架。策略采用IFT(Inverse Fisher Transform)转换来规范化指标输出,最终通过信号综合产生交易决策。
策略原理
策略的核心是通过多指标融合来提供更可靠的交易信号。首先对各个指标进行标准化处理和WMA平滑,然后通过IFT转换将指标值映射到[-1,1]区间。具体包括: 1. 对CCI、RSI、Stochastic和MFI四个指标分别进行计算和归一化 2. 使用WMA对指标值进行平滑处理 3. 通过IFT转换将指标值转换到统一区间 4. 计算四个转换后指标的平均值作为最终信号 5. 当信号线突破-0.5时产生做多信号,突破0.5时产生做空信号 6. 设置0.5%止损和1%止盈来控制风险
策略优势
- 多指标融合提供了更全面的市场视角,降低了单一指标的局限性
- IFT转换确保了指标输出的一致性,便于信号合成
- WMA平滑处理有效降低了假信号
- 设置了合理的止损止盈,控制风险的同时保证盈利空间
- 信号生成机制清晰,便于调试和优化
策略风险
- 多指标可能在剧烈波动市场中产生滞后
- 固定的止损止盈参数可能不适应所有市场环境
- WMA平滑可能导致信号延迟
- 指标参数需要针对不同市场进行优化 建议:动态调整止损止盈参数,引入波动率指标,优化平滑参数
策略优化方向
- 引入自适应的止损止盈机制,根据市场波动动态调整
- 添加市场环境过滤机制,在不同趋势强度下使用不同参数
- 优化信号合成方式,可考虑加权平均替代简单平均
- 引入成交量加权和波动率调整机制
- 开发指标参数的自动优化系统
总结
该策略通过多指标融合和信号优化,构建了一个相对完整的交易系统。策略的优势在于信号的可靠性和风险控制的完整性,但仍需要在实际应用中根据市场特征进行参数优化。通过建议的优化方向,策略有望在不同市场环境下获得更好的表现。
策略源码
/*backtest
start: 2024-11-19 00:00:00
end: 2024-12-18 08:00:00
period: 4h
basePeriod: 4h
exchanges: [{"eid":"Futures_Binance","currency":"BTC_USDT"}]
*/

//@version=5
strategy('wombocombo', overlay=true, default_qty_type=strategy.percent_of_equity, default_qty_value=100)

// IFTCOMBO Hesaplamaları
ccilength = input.int(5, 'CCI Length')
wmalength = input.int(9, 'Smoothing Length')
rsilength = input.int(5, 'RSI Length')
stochlength = input.int(5, 'STOCH Length')
mfilength = input.int(5, 'MFI Length')

// CCI
v11 = 0.1 * (ta.cci(close, ccilength) / 4)
v21 = ta.wma(v11, wmalength)
INV1 = (math.exp(2 * v21) - 1) / (math.exp(2 * v21) + 1)

// RSI
v12 = 0.1 * (ta.rsi(close, rsilength) - 50)
v22 = ta.wma(v12, wmalength)
INV2 = (math.exp(2 * v22) - 1) / (math.exp(2 * v22) + 1)

// Stochastic
v1 = 0.1 * (ta.stoch(close, high, low, stochlength) - 50)
v2 = ta.wma(v1, wmalength)
INVLine = (math.exp(2 * v2) - 1) / (math.exp(2 * v2) + 1)

// MFI
source = hlc3
up = math.sum(volume * (ta.change(source) <= 0 ? 0 : source), mfilength)
lo = math.sum(volume * (ta.change(source) >= 0 ? 0 : source), mfilength)
mfi = 100.0 - 100.0 / (1.0 + up / lo)
v13 = 0.1 * (mfi - 50)
v23 = ta.wma(v13, wmalength)
INV3 = (math.exp(2 * v23) - 1) / (math.exp(2 * v23) + 1)

// Ortalama IFTCOMBO değeri
AVINV = (INV1 + INV2 + INVLine + INV3) / 4

// Sinyal çizgileri
hline(0.5, color=color.red, linestyle=hline.style_dashed)
hline(-0.5, color=color.green, linestyle=hline.style_dashed)

// IFTCOMBO çizgisi
plot(AVINV, color=color.red, linewidth=2, title='IFTCOMBO')

// Long Trading Sinyalleri
longCondition = ta.crossover(AVINV, -0.5)
longCloseCondition = ta.crossunder(AVINV, 0.5)

// Short Trading Sinyalleri
shortCondition = ta.crossunder(AVINV, 0.5)
shortCloseCondition = ta.crossover(AVINV, -0.5)

// Stop-loss seviyesi (%0.5 kayıp)
stopLoss = strategy.position_avg_price * (1 - 0.005) // Long için
takeProfit = strategy.position_avg_price * (1 + 0.01) // Long için


// Long Strateji Kuralları
if longCondition
    strategy.entry('Long', strategy.long)
    strategy.exit('Long Exit', 'Long', stop=stopLoss, limit=takeProfit) // Stop-loss eklendi


if longCloseCondition
    strategy.close('Long')

// Stop-loss seviyesi (%0.5 kayıp)
stopLossShort = strategy.position_avg_price * (1 + 0.005) // Short için
takeProfitShort = strategy.position_avg_price * (1 - 0.01) // Short için

// Short Strateji Kuralları
if shortCondition
    strategy.entry('Short', strategy.short)
    strategy.exit('Short Exit', 'Short', stop=stopLossShort, limit=takeProfitShort) // Stop-loss eklendi


if shortCloseCondition
    strategy.close('Short')

// Sinyal noktalarını plotlama
plotshape(longCondition, title='Long Signal', location=location.belowbar, color=color.purple, size=size.small)
plotshape(shortCondition, title='Short Signal', location=location.abovebar, color=color.yellow, size=size.small)
相关推荐