概述
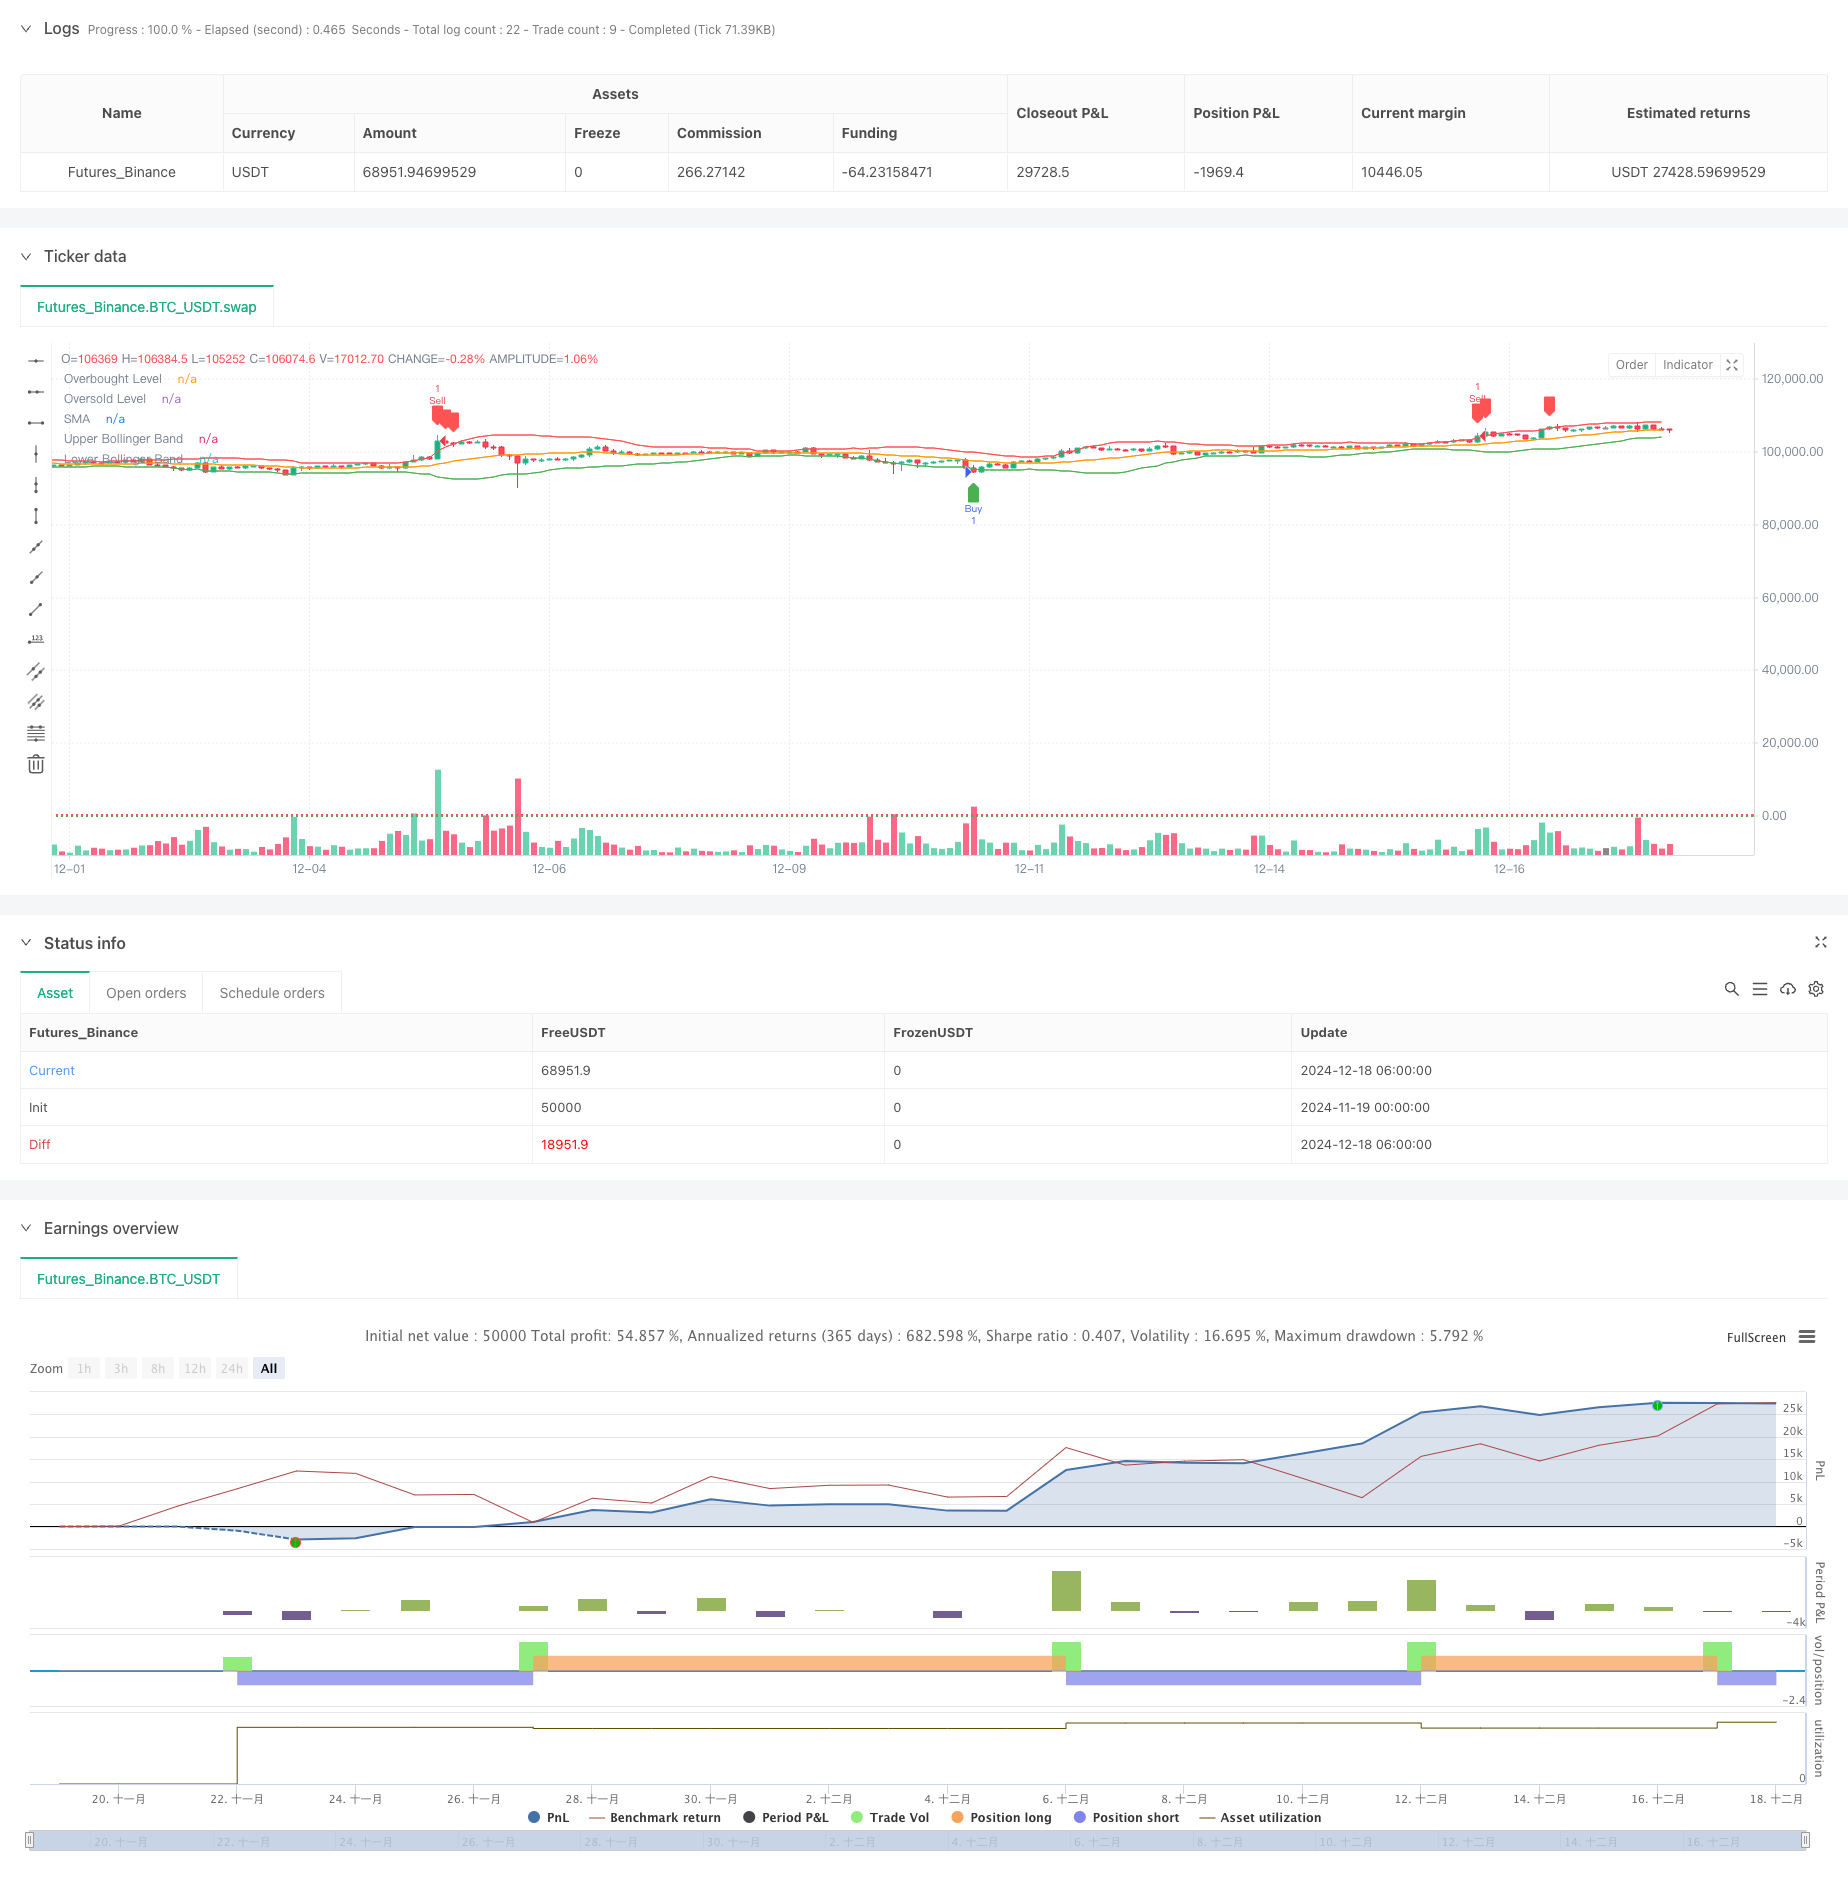
该策略是一个结合了布林带(Bollinger Bands)和相对强弱指标(RSI)的均值回归交易系统。策略通过识别价格偏离均值的极端情况,并结合RSI超买超卖信号来确定交易时机。当价格突破布林带下轨且RSI处于超卖区域时产生做多信号,当价格突破布林带上轨且RSI处于超买区域时产生做空信号。
策略原理
策略的核心逻辑基于金融市场的均值回归特性。具体实现上,使用20日简单移动平均线(SMA)作为均值参考,标准差乘数为2.0计算布林带宽度。同时引入14日RSI作为辅助指标,设定70和30作为超买超卖阈值。策略在价格突破布林带且RSI达到极值时才触发交易信号,这种双重确认机制提高了策略的可靠性。
策略优势
- 结合多重技术指标,提供更可靠的交易信号
- 通过RSI配合布林带,有效过滤假突破
- 参数可调整性强,适应不同市场环境
- 策略逻辑清晰,易于理解和实施
- 具有完善的风险控制机制
- 代码实现简洁高效,便于维护和优化
策略风险
- 在趋势市场中可能频繁提前平仓,影响收益
- 参数选择不当可能导致信号滞后
- 市场剧烈波动时可能造成较大回撤
- 需要考虑交易成本对策略收益的影响
- 不同市场环境下策略表现差异较大
策略优化方向
- 引入自适应布林带宽度,根据市场波动性动态调整
- 增加趋势过滤器,在强趋势市场中降低交易频率
- 优化RSI参数,考虑使用自适应周期
- 加入止损止盈机制,提高风险收益比
- 考虑引入成交量指标,提高信号可靠性
- 开发参数优化模块,实现策略自动调优
总结
该策略通过布林带和RSI的协同作用,构建了一个稳健的均值回归交易系统。策略设计合理,具有良好的可扩展性和适应性。通过持续优化和完善,可以进一步提升策略的稳定性和盈利能力。建议在实盘交易前进行充分的回测验证,并根据具体市场特征调整参数设置。
策略源码
/*backtest
start: 2024-11-19 00:00:00
end: 2024-12-18 08:00:00
period: 2h
basePeriod: 2h
exchanges: [{"eid":"Futures_Binance","currency":"BTC_USDT"}]
*/

//@version=5
strategy("Mean Reversion Strategy", overlay=true)

// User Inputs
length = input.int(20, title="SMA Length")  // Moving Average length
stdDev = input.float(2.0, title="Standard Deviation Multiplier")  // Bollinger Band deviation
rsiLength = input.int(14, title="RSI Length")  // RSI calculation length
rsiOverbought = input.int(70, title="RSI Overbought Level")  // RSI overbought threshold
rsiOversold = input.int(30, title="RSI Oversold Level")  // RSI oversold threshold

// Bollinger Bands
sma = ta.sma(close, length)  // Calculate the SMA
stdDevValue = ta.stdev(close, length)  // Calculate Standard Deviation
upperBand = sma + stdDev * stdDevValue  // Upper Bollinger Band
lowerBand = sma - stdDev * stdDevValue  // Lower Bollinger Band

// RSI
rsi = ta.rsi(close, rsiLength)  // Calculate RSI

// Plot Bollinger Bands
plot(sma, color=color.orange, title="SMA")  // Plot SMA
plot(upperBand, color=color.red, title="Upper Bollinger Band")  // Plot Upper Band
plot(lowerBand, color=color.green, title="Lower Bollinger Band")  // Plot Lower Band

// Plot RSI Levels (Optional)
hline(rsiOverbought, "Overbought Level", color=color.red, linestyle=hline.style_dotted)
hline(rsiOversold, "Oversold Level", color=color.green, linestyle=hline.style_dotted)

// Buy and Sell Conditions
buyCondition = (close < lowerBand) and (rsi < rsiOversold)  // Price below Lower Band and RSI Oversold
sellCondition = (close > upperBand) and (rsi > rsiOverbought)  // Price above Upper Band and RSI Overbought

// Execute Strategy
if (buyCondition)
    strategy.entry("Buy", strategy.long)
if (sellCondition)
    strategy.entry("Sell", strategy.short)

// Optional: Plot Buy/Sell Signals
plotshape(series=buyCondition, location=location.belowbar, color=color.green, style=shape.labelup, title="Buy Signal")
plotshape(series=sellCondition, location=location.abovebar, color=color.red, style=shape.labeldown, title="Sell Signal")
相关推荐