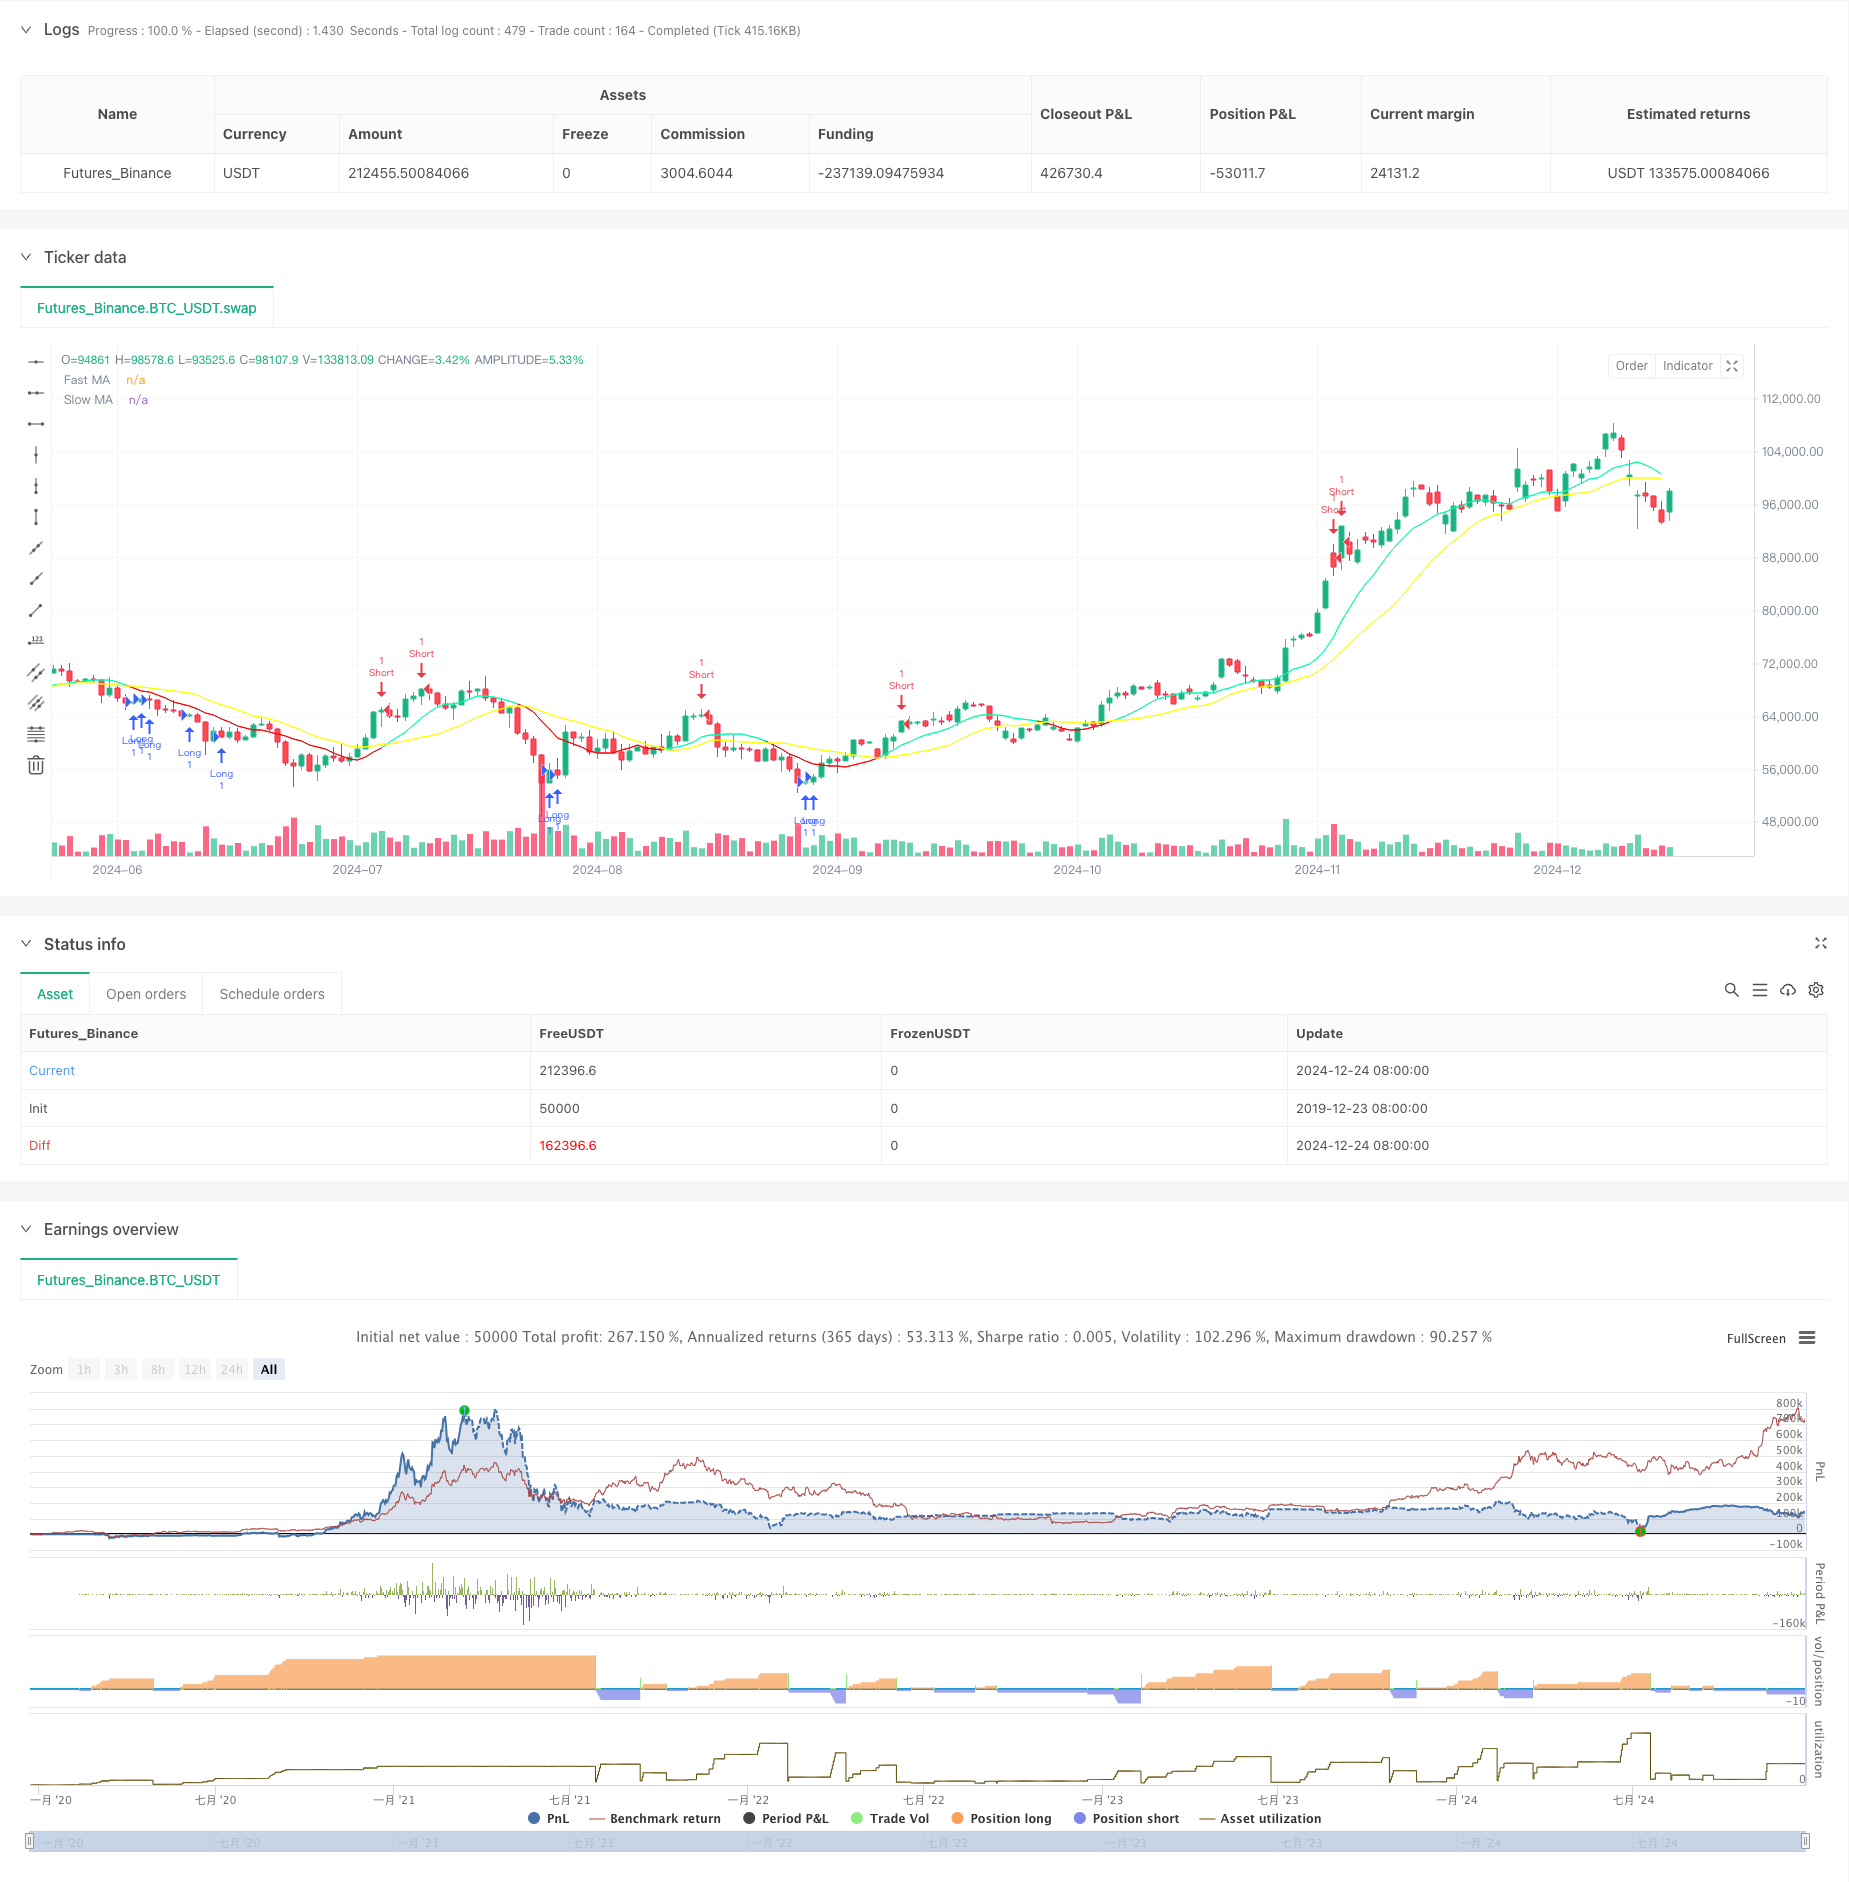
概述
本策略是一个结合了随机相对强弱指标(Stochastic RSI)和移动平均线(Moving Average)的趋势跟踪交易系统。策略通过分析这两个技术指标的交叉信号来确定市场趋势的转折点,从而捕捉潜在的交易机会。该策略采用多重指标交叉验证的方式,有效降低了假信号的干扰,提高了交易的准确性。
策略原理
策略的核心逻辑基于两个主要指标系统: 1. 随机相对强弱指标(Stochastic RSI): - RSI周期设置为17,随机指标周期设置为20 - K线和D线的交叉作为主要信号 - 当K值小于17且D值小于23,同时K线上穿D线时,触发做多信号 - 当K值大于99且D值大于90,同时K线下穿D线时,触发做空信号
- 双均线系统:
- 快速均线周期为10,慢速均线周期为20
- 均线的位置关系用于确认趋势方向
- 快线与慢线的交叉提供趋势转换的辅助判断
策略优势
- 多重指标验证:结合了动量指标和趋势指标,提供了更可靠的交易信号
- 参数优化:经过优化的指标参数设置,能够更好地适应市场波动
- 风险控制:使用严格的信号触发条件,有效降低虚假信号
- 自动化执行:策略可以通过编程实现自动化交易,减少人为干预
- 灵活性强:可以根据不同市场条件调整参数设置
策略风险
- 滞后性风险:移动平均线本身具有滞后性,可能导致入场点不够理想
- 震荡市风险:在横盘震荡市场中可能产生频繁的假信号
- 参数敏感性:策略效果对参数设置较为敏感,需要定期优化
- 市场环境依赖:在强趋势市场表现较好,但在其他市场环境下可能表现欠佳
策略优化方向
- 引入波动率过滤器:
- 添加ATR指标来评估市场波动性
- 根据波动率大小动态调整仓位规模
- 优化信号确认机制:
- 增加成交量指标验证
- 添加趋势强度确认指标
- 完善风险管理系统:
- 设置动态止损止盈
- 实现仓位管理优化
总结
该策略通过结合随机相对强弱指标和移动平均线系统,构建了一个相对完整的趋势跟踪交易系统。策略的优势在于多重指标的交叉验证机制,能够有效降低虚假信号的干扰。但同时也需要注意控制风险,特别是在震荡市场中的表现。通过持续优化和完善,该策略有望在实际交易中取得更好的表现。
策略源码
/*backtest
start: 2019-12-23 08:00:00
end: 2024-12-25 08:00:00
period: 1d
basePeriod: 1d
exchanges: [{"eid":"Futures_Binance","currency":"BTC_USDT"}]
*/

// This Pine Script™ code is subject to the terms of the Mozilla Public License 2.0 at https://mozilla.org/MPL/2.0/
// © Quantuan_Research

//@version=6
version=6
strategy("Quantuan Research - Alpha", overlay=true, pyramiding=200, default_qty_value=1)


// Define Stochastic RSI settings
lengthRSI = input(17, title="RSI Length")
lengthStoch = input(20, title="Stochastic Length")
src = input(close, title="Source")
rsi = ta.rsi(src, lengthRSI)
k = ta.stoch(rsi, rsi, rsi, lengthStoch)
d = ta.sma(k, 3)

// Define MA settings
fastMALength = input(10, title="Fast MA Length")
slowMALength = input(20, title="Slow MA Length")
fastMA = ta.sma(close, fastMALength)
slowMA = ta.sma(close, slowMALength)

// Define long and short conditions
longCondition = k < 17 and d < 23 and k > d
shortCondition = k > 99 and d > 90 and k < d

// Create long and short signals
if longCondition//@
    strategy.entry("Long", strategy.long)

if shortCondition
    strategy.entry("Short", strategy.short)

// Add alerts for long and short signals
alertcondition(longCondition, title="Long Signal", message="Long signal generated")
alertcondition(shortCondition, title="Short Signal", message="Short signal generated")

// Plot Moving Averages with color based on trend
plot(fastMA, color = fastMA > slowMA ? color.new(color.rgb(0, 255, 170), 0) : color.new(color.rgb(255, 0, 0), 0), title = 'Fast MA')
plot(slowMA, color = color.new(color.rgb(255, 255, 0), 0), title = 'Slow MA')
相关推荐