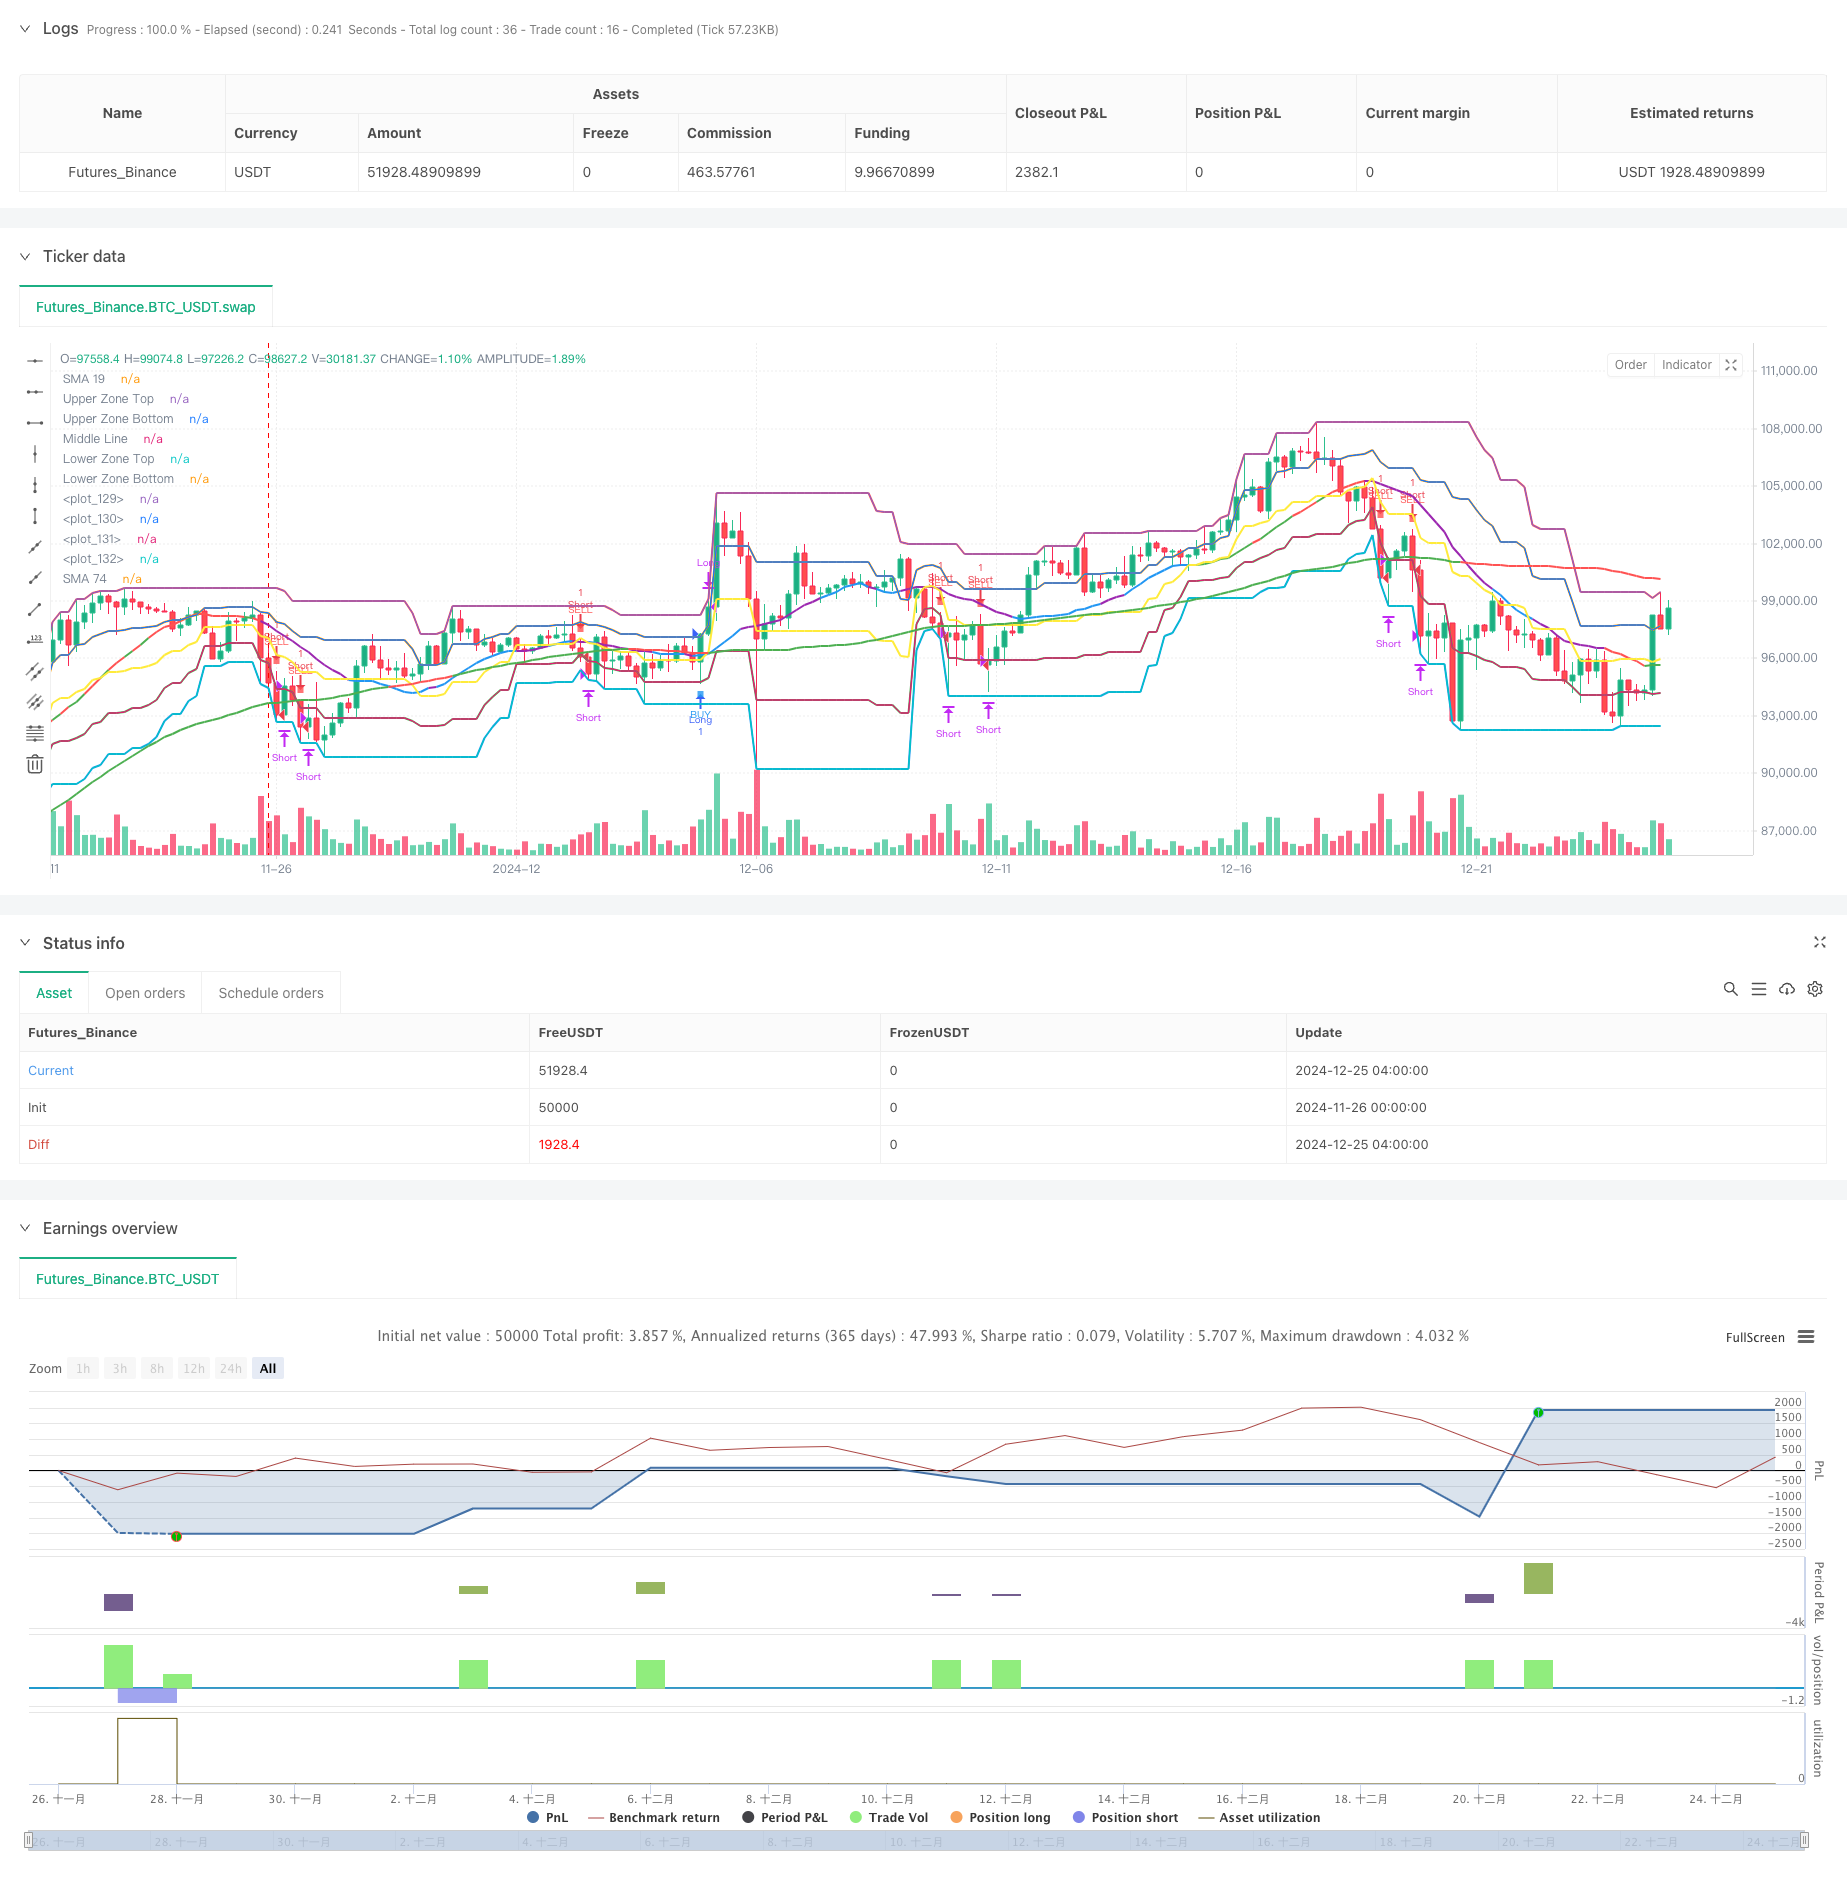
概述
该策略是一个结合了多重移动平均线(SMA)和随机指标(KDJ)的趋势跟踪交易系统。通过设定价格区间和趋势判断条件,在市场趋势明确时进行交易。策略采用了动态止损机制,根据市场走势调整持仓管理,既保护既有利润又不会过早离场。
策略原理
策略主要基于以下几个核心组件: 1. 双均线系统:使用19周期和74周期SMA作为趋势判断工具 2. 价格区间:将价格区间分为5个等级,用于判断市场强弱 3. 随机指标:使用60周期的随机指标进行超买超卖判断 4. 趋势确认:通过连续3根K线的走势判断趋势的持续性 5. 入场条件:价格突破74周期SMA且位于相应价格区间时入场 6. 止损机制:采用跟踪止损,在趋势改变时及时离场
策略优势
- 系统完整性:结合了趋势跟踪和动量指标,提供了全面的市场分析
- 风险管理:采用多重止损机制,包括硬性止损和跟踪止损
- 适应性强:通过参数调整可以适应不同市场环境
- 趋势把握:能够有效捕捉中长期趋势,避免虚假信号
- 持仓管理:根据市场状态动态调整持仓,提高资金使用效率
策略风险
- 震荡市场风险:在横盘市场可能产生频繁交易
- 滑点风险:在快速行情中可能面临较大滑点
- 参数敏感性:不同参数组合可能导致策略表现差异较大
- 市场环境依赖:策略在趋势明显的市场中表现更好
- 资金管理风险:全仓操作可能带来较大回撤风险
策略优化方向
- 引入波动率指标:考虑添加ATR指标来动态调整止损位置
- 优化入场时机:可以增加成交量确认来提高入场准确性
- 完善资金管理:建议添加仓位管理模块,根据风险动态调整仓位
- 增加市场环境判断:可以添加趋势强度指标来过滤交易信号
- 改进止损机制:可以考虑使用百分比跟踪止损来提高灵活性
总结
该策略通过结合多重技术指标构建了一个完整的交易系统,具有良好的趋势跟踪能力和风险管理机制。虽然在某些市场环境下可能面临挑战,但通过持续优化和完善,策略有望在不同市场环境下都能保持稳定表现。建议交易者在实盘使用时注意控制仓位,合理设置止损,并根据市场情况适时调整参数。
策略源码
/*backtest
start: 2024-11-26 00:00:00
end: 2024-12-25 08:00:00
period: 4h
basePeriod: 4h
exchanges: [{"eid":"Futures_Binance","currency":"BTC_USDT"}]
*/

//@version=5
strategy("Purple SMA Strategy", overlay=true)

// === INPUTS ===
zoneLength = input.int(20, "Price Zone Length", minval=5)
tickSize = input.float(1.0, "Tick Size for Hard Stop")
hardStopTicks = input.int(50, "Hard Stop Loss in Ticks")

// === CALCULATE ZONES ===
h = ta.highest(high, zoneLength)
l = ta.lowest(low, zoneLength)
priceRange = h - l
lvl5 = h
lvl4 = l + (priceRange * 0.75)  // Orange line
lvl3 = l + (priceRange * 0.50)  // Yellow line
lvl2 = l + (priceRange * 0.25)  // Green line
lvl1 = l

// === INDICATORS ===
sma19 = ta.sma(close, 19)
sma74 = ta.sma(close, 74)

// === CANDLE COLOR CONDITIONS ===
isGreenCandle = close > open
isRedCandle = close < open

// === CONTINUOUS TREND DETECTION ===
isThreeGreenCandles = close > open and close[1] > open[1] and close[2] > open[2]
isThreeRedCandles = close < open and close[1] < open[1] and close[2] < open[2]

var bool inGreenTrend = false
var bool inRedTrend = false

// Update trends
if isThreeGreenCandles
    inGreenTrend := true
    inRedTrend := false
if isThreeRedCandles
    inRedTrend := true
    inGreenTrend := false
if (inGreenTrend and isRedCandle) or (inRedTrend and isGreenCandle)
    inGreenTrend := false
    inRedTrend := false

// === STOCHASTIC CONDITIONS ===
k = ta.stoch(close, high, low, 60)
d = ta.sma(k, 10)
isOverbought = d >= 80
isOversold = d <= 20
stochUp = d > d[1]
stochDown = d < d[1]

// === SMA COLOR LOGIC ===
sma19Color = if isOverbought and stochUp
    color.green
else if isOverbought and stochDown
    color.red
else if isOversold and stochUp
    color.green
else if isOversold and stochDown
    color.red
else if stochUp
    color.blue
else if stochDown
    color.purple
else
    color.gray

sma74Color = sma74 < sma19 ? color.green : color.red

// === CROSSING CONDITIONS ===
crossUpSMA = ta.crossover(close, sma74)
crossDownSMA = ta.crossunder(close, sma74)

// === ENTRY CONDITIONS ===
buyCondition = crossUpSMA and close > lvl4
sellCondition = crossDownSMA and close < lvl2

// === POSITION MANAGEMENT ===
var float stopLevel = na
var bool xMode = false

// Entry and Stop Loss
if buyCondition
    strategy.entry(id="Long", direction=strategy.long)
    stopLevel := close - (hardStopTicks * tickSize)
    xMode := false

if sellCondition
    strategy.entry(id="Short", direction=strategy.short)
    stopLevel := close + (hardStopTicks * tickSize)
    xMode := false

// Update stops based on X's
if strategy.position_size != 0 and (inGreenTrend or inRedTrend)
    xMode := true
    if strategy.position_size > 0  // Long position
        stopLevel := low
    else  // Short position
        stopLevel := high

// Exit logic
if strategy.position_size > 0  // Long position
    if low <= stopLevel
        strategy.close(id="Long")
    else if xMode and not (inGreenTrend or inRedTrend)
        strategy.close(id="Long")

if strategy.position_size < 0  // Short position
    if high >= stopLevel
        strategy.close(id="Short")
    else if xMode and not (inGreenTrend or inRedTrend)
        strategy.close(id="Short")

// === PLOTTING ===
plot(sma19, "SMA 19", color=sma19Color, linewidth=2)
plot(sma74, "SMA 74", color=sma74Color, linewidth=2)
plot(lvl5, "Upper Zone Top", color=color.red, linewidth=2)
plot(lvl4, "Upper Zone Bottom", color=color.orange, linewidth=2)
plot(lvl3, "Middle Line", color=color.yellow, linewidth=2)
plot(lvl2, "Lower Zone Top", color=color.green, linewidth=2)
plot(lvl1, "Lower Zone Bottom", color=color.blue, linewidth=2)

// Plot X signals
plotshape(inGreenTrend, title="Bullish Line", style=shape.xcross, location=location.belowbar, color=color.white, size=size.tiny)
plotshape(inRedTrend, title="Bearish Line", style=shape.xcross, location=location.abovebar, color=color.white, size=size.tiny)

// Zone fills
var p1 = plot(lvl5, display=display.none)
var p2 = plot(lvl4, display=display.none)
var p3 = plot(lvl2, display=display.none)
var p4 = plot(lvl1, display=display.none)
fill(p1, p2, color=color.new(color.red, 90))
fill(p3, p4, color=color.new(color.green, 90))

// Plot entry signals
plotshape(buyCondition, title="Buy", style=shape.square, location=location.belowbar, color=color.new(color.blue, 20), size=size.tiny, text="BUY", textcolor=color.blue)
plotshape(sellCondition, title="Sell", style=shape.square, location=location.abovebar, color=color.new(color.red, 20), size=size.tiny, text="SELL", textcolor=color.red)
相关推荐