概述
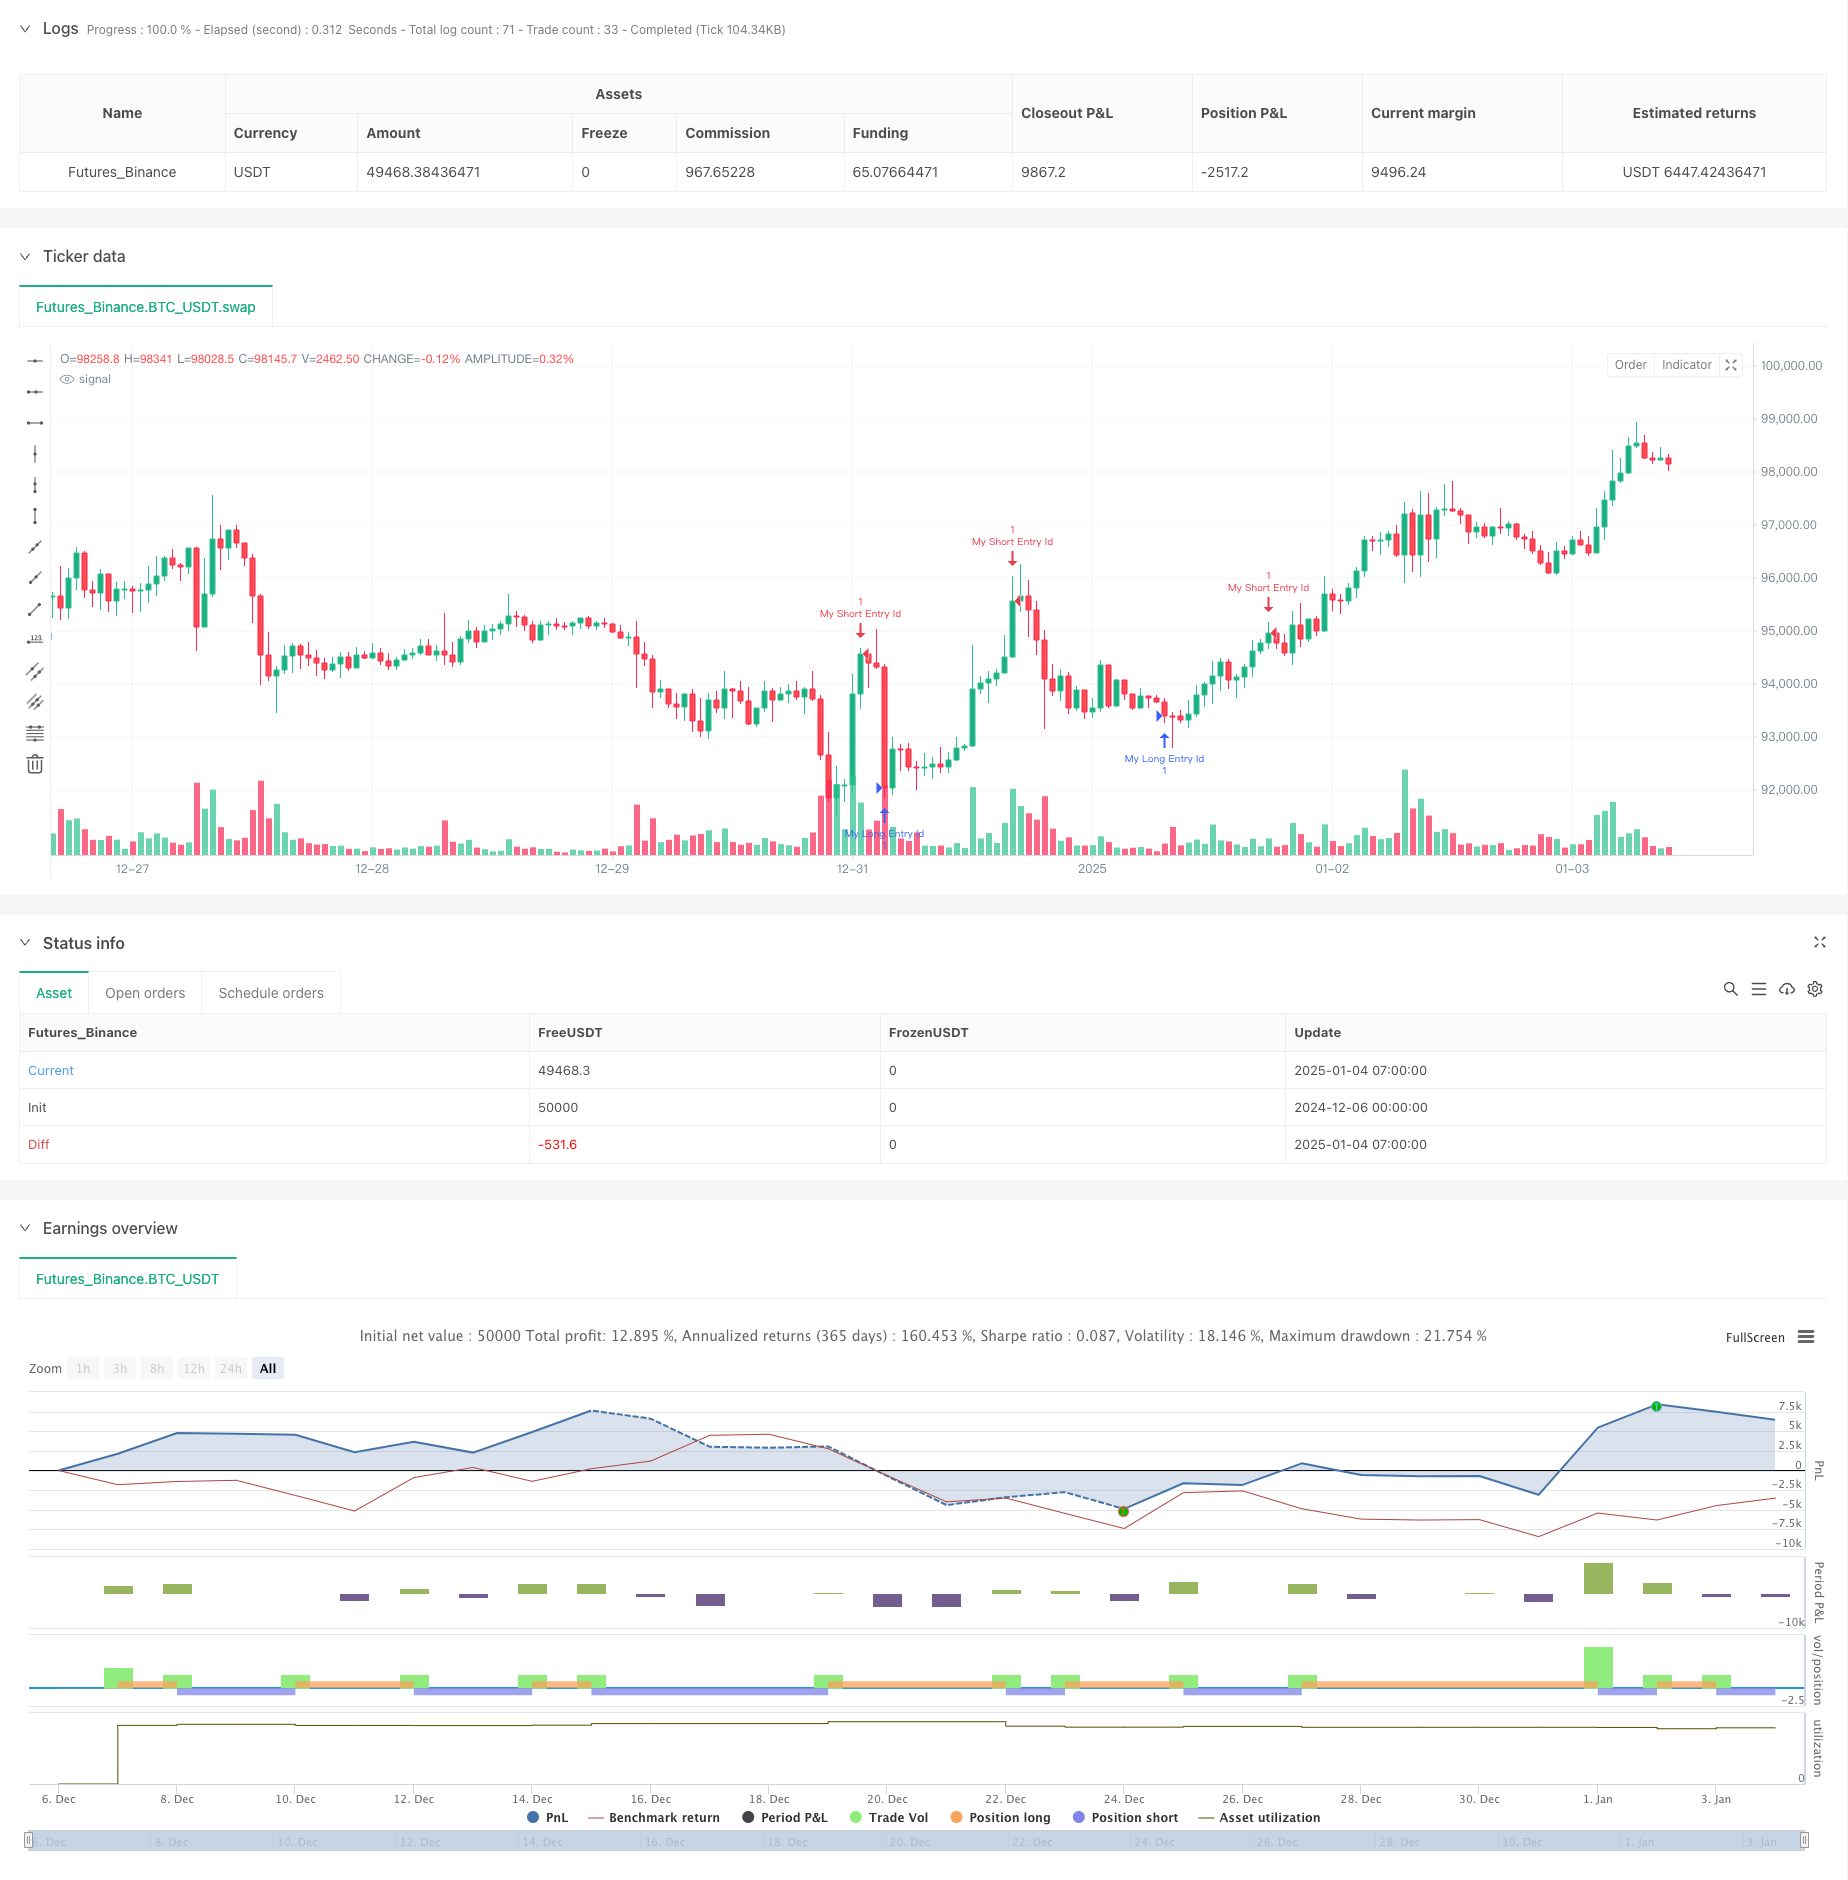
该策略是一个基于Supertrend指标的高级趋势跟踪交易系统,结合了多重信号确认机制和动态持仓管理。策略核心是通过ATR(真实波幅均值)来计算Supertrend线,并结合价格走势和持仓时间窗口来生成交易信号,实现对市场趋势的智能捕捉。
策略原理
策略采用了三层信号过滤机制: 1. 基础趋势判断:使用Supertrend指标(参数:ATR周期10,因子3.0)识别主要趋势方向 2. 方向确认系统:通过direction变量跟踪趋势变化,在趋势转向时生成交易信号 3. 信号强化机制:在基本入场信号后的15-19个周期内,通过连续3根K线的走势来确认趋势的可靠性
策略在资金管理方面采用账户权益的15%作为单次交易量,这种保守的仓位控制有助于风险管理。
策略优势
- 多重信号确认:通过Supertrend指标和价格行为分析的结合,显著降低假信号
- 动态持仓控制:基于时间窗口的信号确认机制,避免过度交易
- 风险管理完善:采用百分比持仓策略,有效控制每笔交易的风险敞口
- 趋势适应性强:策略能够在不同市场环境下自适应调整,提高盈利稳定性
策略风险
- 趋势反转风险:在震荡市场中可能产生假信号,导致连续止损
- 参数敏感性:ATR周期和因子的设置对策略表现影响较大
- 滑点影响:在市场流动性不足时可能面临较大滑点
- 信号滞后:多重确认机制可能导致入场时机略有延迟
策略优化方向
- 引入波动率过滤:建议添加ATR标准差指标,在高波动率期间调整交易参数
- 优化信号确认机制:可考虑引入成交量作为辅助指标,提高信号可靠性
- 完善止损机制:建议增加追踪止损功能,更好地锁定利润
- 市场环境分类:可添加市场环境识别模块,在不同市场状态下使用不同的参数组合
总结
这是一个结构完善、逻辑严谨的趋势跟踪策略,通过多重信号确认机制和完善的风险管理体系,具有较好的实战应用价值。策略的可扩展性强,通过建议的优化方向可进一步提升其稳定性和盈利能力。
策略源码
/*backtest
start: 2024-12-06 00:00:00
end: 2025-01-04 08:00:00
period: 1h
basePeriod: 1h
exchanges: [{"eid":"Futures_Binance","currency":"BTC_USDT"}]
*/

//@version=5
strategy("Supertrend Strategy", overlay=true)
atrPeriod = input(10, "ATR Length")
factor = input.float(3.0, "Factor", step=0.01)

// Compute supertrend values
[supertrendValue, supertrendDirection] = ta.supertrend(factor, atrPeriod)
var float direction = na
if not na(supertrendDirection[1]) and supertrendDirection[1] != supertrendDirection
    direction := supertrendDirection > 0 ? 1 : -1

// Variables to track conditions
var int lastShortTime = na
var int lastLongTime = na

// Detecting short and long entries
if direction == -1
    strategy.entry("My Short Entry Id", strategy.short)
    lastShortTime := bar_index

if direction == 1
    strategy.entry("My Long Entry Id", strategy.long)
    lastLongTime := bar_index

// Custom signal logic
bool bullishSignal = false
bool bearishSignal = false

// Define bullish signal conditions
if not na(lastShortTime) and (bar_index - lastShortTime >= 15 and bar_index - lastShortTime <= 19)
    if close > open and close[1] > open[1] and close[2] > open[2]
        bullishSignal := true

// Define bearish signal conditions
if not na(lastLongTime) and (bar_index - lastLongTime >= 15 and bar_index - lastLongTime <= 19)
    if close < open and close[1] < open[1] and close[2] < open[2]
        bearishSignal := true

// Plot signals
if bullishSignal
    strategy.entry("Bullish Upward Signal", strategy.long)
    label.new(bar_index, close, text="Bullish", style=label.style_circle, color=color.green, textcolor=color.white)

if bearishSignal
    strategy.entry("Bearish Downward Signal", strategy.short)
    label.new(bar_index, close, text="Bearish", style=label.style_circle, color=color.red, textcolor=color.white)

// Optionally plot the strategy equity
//plot(strategy.equity, title="Equity", color=color.red, linewidth=2, style=plot.style_areabr)
相关推荐