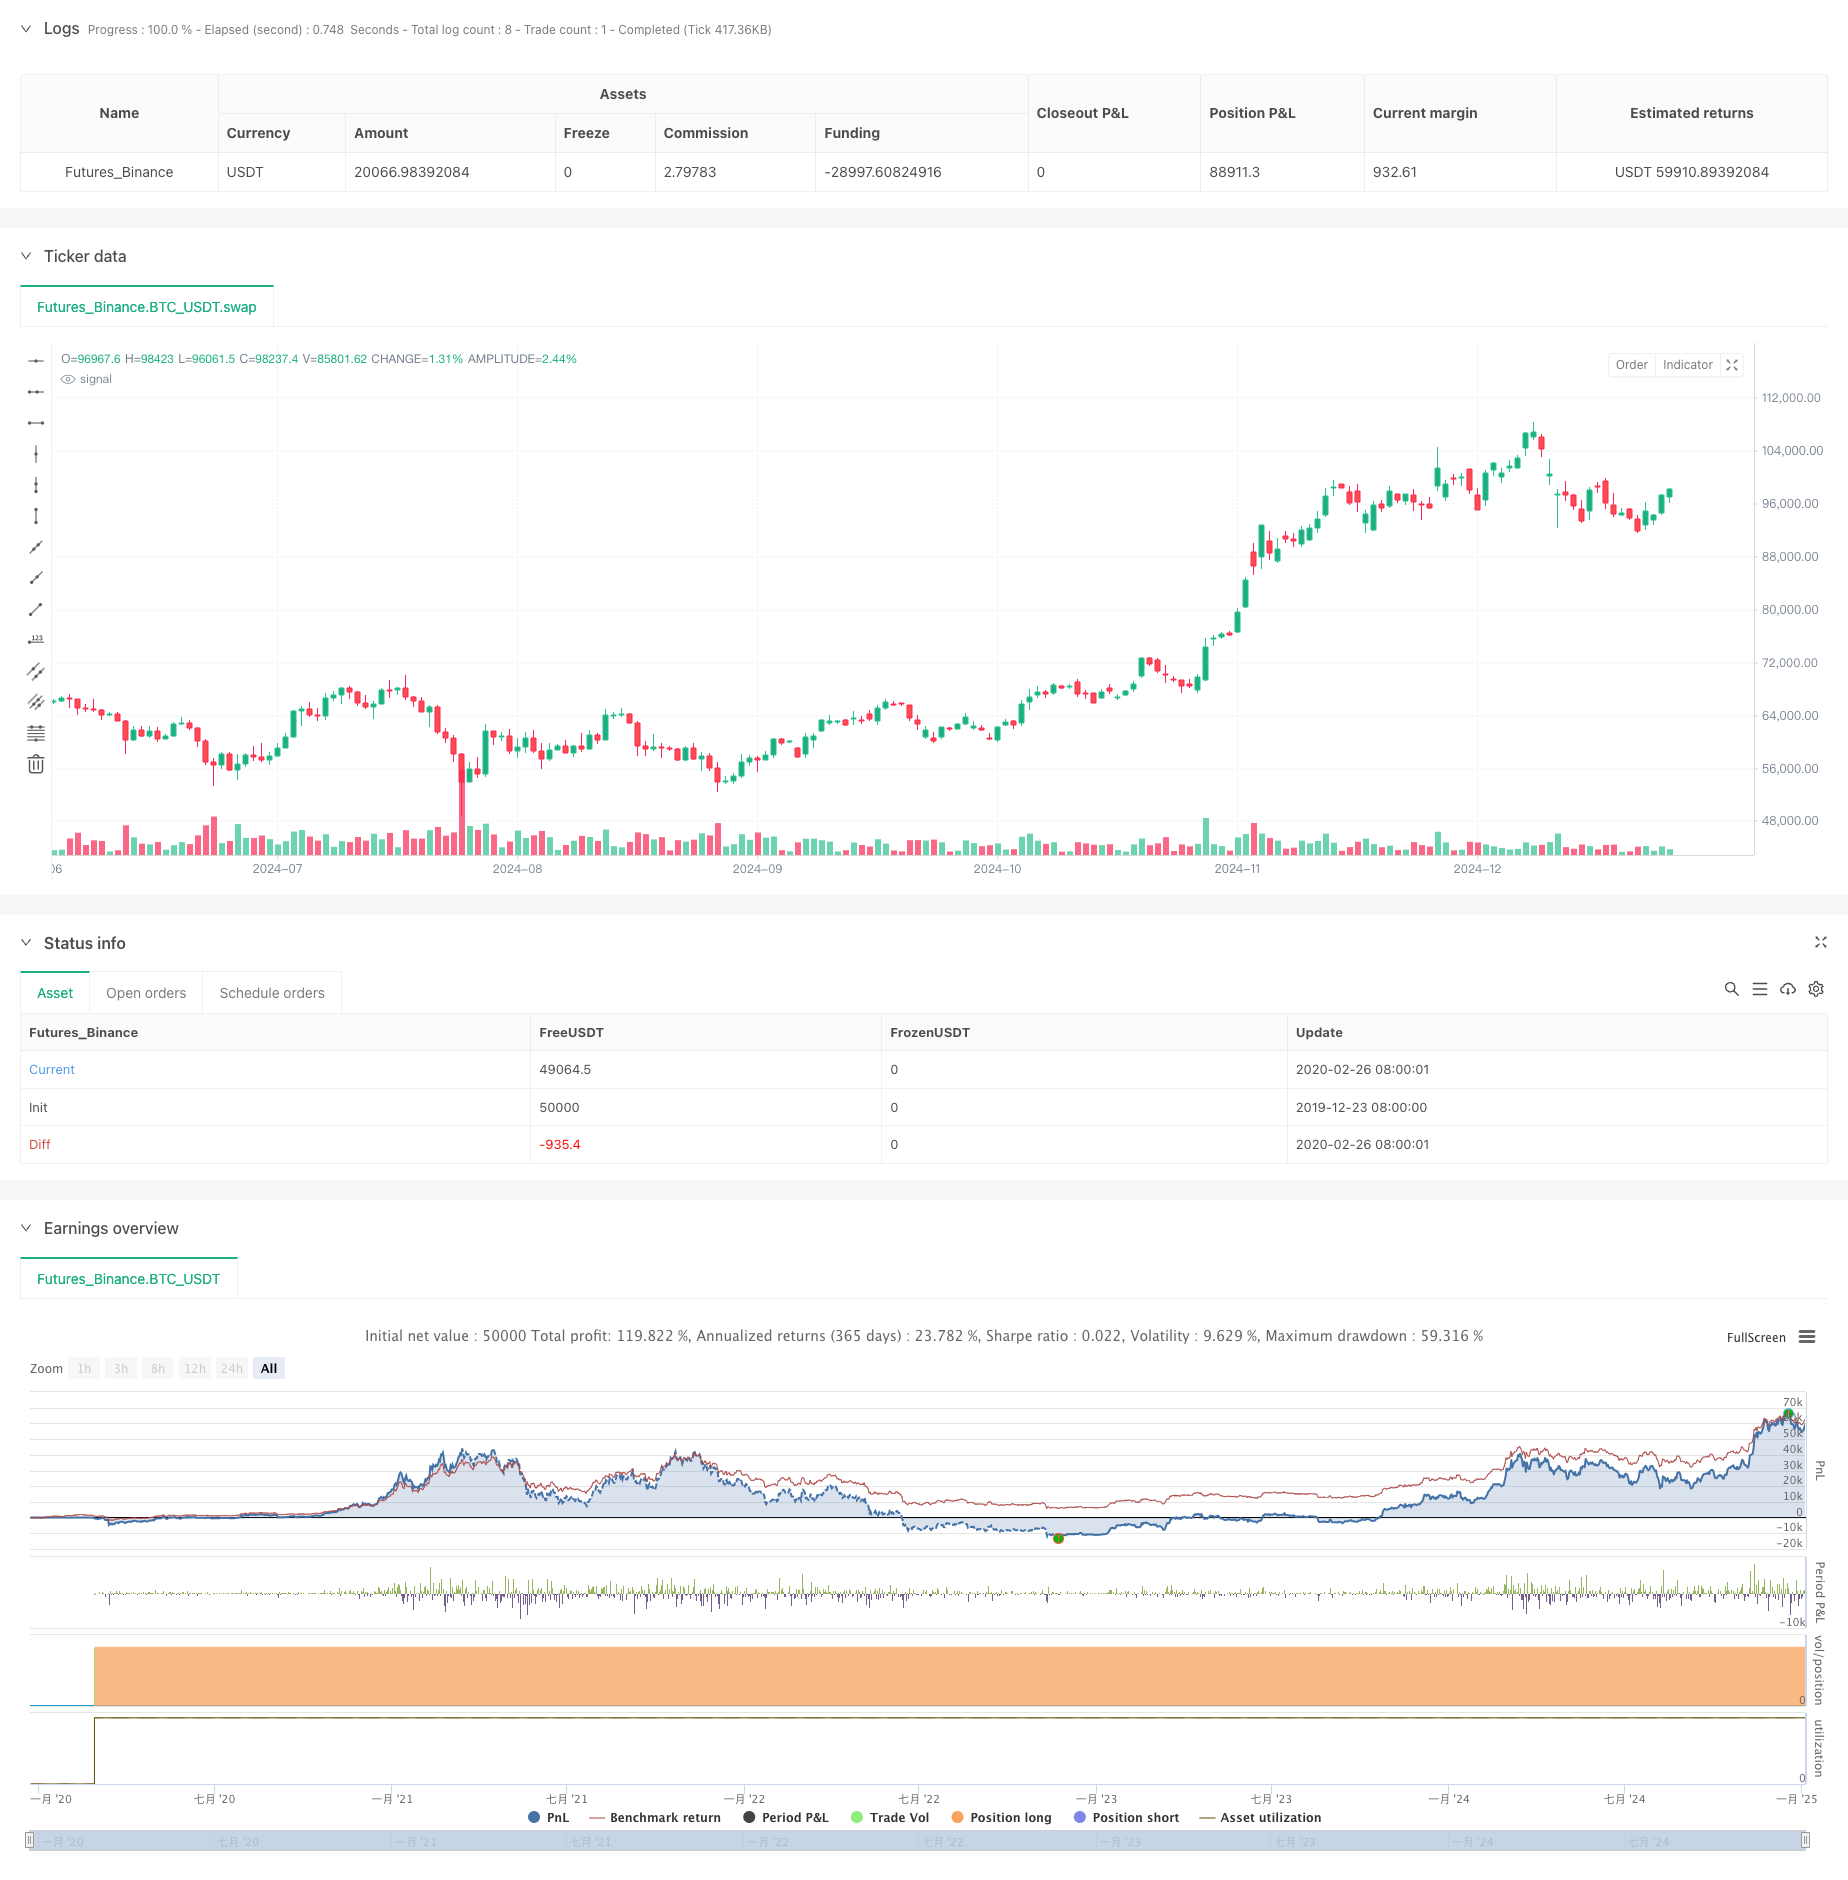
概述
该策略是一个基于支撑位和阻力位的高级交易系统,结合了动态趋势通道和风险管理功能。策略通过分析价格波动在特定回溯期内的最高点和最低点来识别关键支撑和阻力水平,并利用通道宽度参数构建动态交易区间,为交易者提供清晰的市场结构视角和精确的交易信号。
策略原理
策略的核心逻辑包含以下几个关键要素: 1. 支撑位和阻力位的计算基于用户定义的回溯期内的最低价和最高价 2. 通过百分比参数设置动态通道宽度,在支撑位和阻力位基础上构建上下通道 3. 当价格接近支撑位(与支撑位的距离在1%以内)时触发买入信号 4. 系统自动根据用户设定的百分比计算止损和止盈水平 5. 交易仅在指定的回测时间范围内执行 6. 实时计算并显示风险收益比,帮助交易者评估每笔交易的潜在收益与风险
策略优势
- 自适应性强:支撑位和阻力位会随着市场变化动态调整,适应不同市场环境
- 风险管理完善:集成了止损、止盈和风险收益比的计算与可视化显示
- 交易信号明确:提供清晰的入场信号,降低主观判断的影响
- 可视化效果优秀:通过不同颜色的线条和标签直观显示各类价格水平
- 参数灵活可调:允许用户根据个人交易风格和市场特征调整各项参数
策略风险
- 市场波动风险:在高波动市场中可能触发过多交易信号
- 假突破风险:价格临近支撑位可能出现假突破,导致错误信号
- 参数敏感性:回溯期和通道宽度的设置对策略表现影响较大
- 单向交易限制:目前策略仅支持做多交易,可能错过做空机会
- 时间依赖性:策略效果受限于指定的回测时间范围
策略优化方向
- 增加趋势过滤器:引入均线或动量指标,过滤掉逆势信号
- 完善交易方向:添加做空交易逻辑,提升策略全面性
- 优化信号生成:结合成交量指标验证价格突破的有效性
- 动态止损设置:基于ATR或波动率动态调整止损距离
- 增加仓位管理:根据风险收益比和市场波动性动态调整仓位大小
总结
该策略通过结合技术分析中的关键概念—支撑阻力位和趋势通道,构建了一个逻辑严谨、风险可控的交易系统。策略的优势在于其自适应性和完善的风险管理,但仍需要交易者根据市场条件和个人风险承受能力谨慎调整参数。通过建议的优化方向,策略还有进一步提升的空间,可以发展成为一个更全面和稳健的交易系统。
策略源码
/*backtest
start: 2019-12-23 08:00:00
end: 2025-01-04 08:00:00
period: 1d
basePeriod: 1d
exchanges: [{"eid":"Futures_Binance","currency":"BTC_USDT"}]
*/

//@version=5
strategy("Support and Resistance with Trend Lines and Channels", overlay=true)

// Inputs
lookback = input.int(20, title="Lookback Period for Support/Resistance", minval=1)
channelWidth = input.float(0.01, title="Channel Width (%)", minval=0.001) / 100
startDate = input(timestamp("2023-01-01 00:00"), title="Backtesting Start Date")
endDate = input(timestamp("2023-12-31 23:59"), title="Backtesting End Date")

// Check if the current bar is within the testing range
inTestingRange = true

// Support and Resistance Levels
supportLevel = ta.lowest(low, lookback)  // Swing low (support)
resistanceLevel = ta.highest(high, lookback)  // Swing high (resistance)

// Trend Lines and Channels
var line supportLine = na
var line resistanceLine = na
var line upperChannelLine = na
var line lowerChannelLine = na

// Calculate channel levels
upperChannel = resistanceLevel * (1 + channelWidth)  // Upper edge of channel
lowerChannel = supportLevel * (1 - channelWidth)  // Lower edge of channel

// Create or update the support trend line
// if na(supportLine)
//     supportLine := line.new(bar_index, supportLevel, bar_index + 1, supportLevel, color=color.green, width=2, extend=extend.right)
// else
//     line.set_y1(supportLine, supportLevel)
//     line.set_y2(supportLine, supportLevel)

// // Create or update the resistance trend line
// if na(resistanceLine)
//     resistanceLine := line.new(bar_index, resistanceLevel, bar_index + 1, resistanceLevel, color=color.red, width=2, extend=extend.right)
// else
//     line.set_y1(resistanceLine, resistanceLevel)
//     line.set_y2(resistanceLine, resistanceLevel)

// // Create or update the upper channel line
// if na(upperChannelLine)
//     upperChannelLine := line.new(bar_index, upperChannel, bar_index + 1, upperChannel, color=color.blue, width=1, style=line.style_dashed, extend=extend.right)
// else
//     line.set_y1(upperChannelLine, upperChannel)
//     line.set_y2(upperChannelLine, upperChannel)

// // Create or update the lower channel line
// if na(lowerChannelLine)
//     lowerChannelLine := line.new(bar_index, lowerChannel, bar_index + 1, lowerChannel, color=color.purple, width=1, style=line.style_dashed, extend=extend.right)
// else
//     line.set_y1(lowerChannelLine, lowerChannel)
//     line.set_y2(lowerChannelLine, lowerChannel)

// Buy Condition: When price is near support level
buyCondition = close <= supportLevel * 1.01 and inTestingRange
if buyCondition
    strategy.entry("Buy", strategy.long)

// Stop Loss and Take Profit
stopLossPercentage = input.float(1.5, title="Stop Loss Percentage", minval=0.0) / 100
takeProfitPercentage = input.float(3.0, title="Take Profit Percentage", minval=0.0) / 100

var float longStopLoss = na
var float longTakeProfit = na
if strategy.position_size > 0
    longStopLoss := strategy.position_avg_price * (1 - stopLossPercentage)
    longTakeProfit := strategy.position_avg_price * (1 + takeProfitPercentage)
    strategy.exit("Exit Buy", "Buy", stop=longStopLoss, limit=longTakeProfit)

// Visualize Entry, Stop Loss, and Take Profit Levels
var float entryPrice = na
if buyCondition
    entryPrice := close
if not na(entryPrice)
    label.new(bar_index, entryPrice, text="Entry: " + str.tostring(entryPrice, "#.##"), style=label.style_label_up, color=color.green, textcolor=color.white)

if strategy.position_size > 0
    line.new(bar_index, longStopLoss, bar_index + 1, longStopLoss, color=color.red, width=1, extend=extend.right)
    line.new(bar_index, longTakeProfit, bar_index + 1, longTakeProfit, color=color.blue, width=1, extend=extend.right)

// Risk-to-Reward Ratio (Optional)
if not na(entryPrice) and not na(longStopLoss) and not na(longTakeProfit)
    riskToReward = (longTakeProfit - entryPrice) / (entryPrice - longStopLoss)
    label.new(bar_index, entryPrice, text="R:R " + str.tostring(riskToReward, "#.##"), style=label.style_label_up, color=color.yellow, textcolor=color.black, size=size.small)
相关推荐