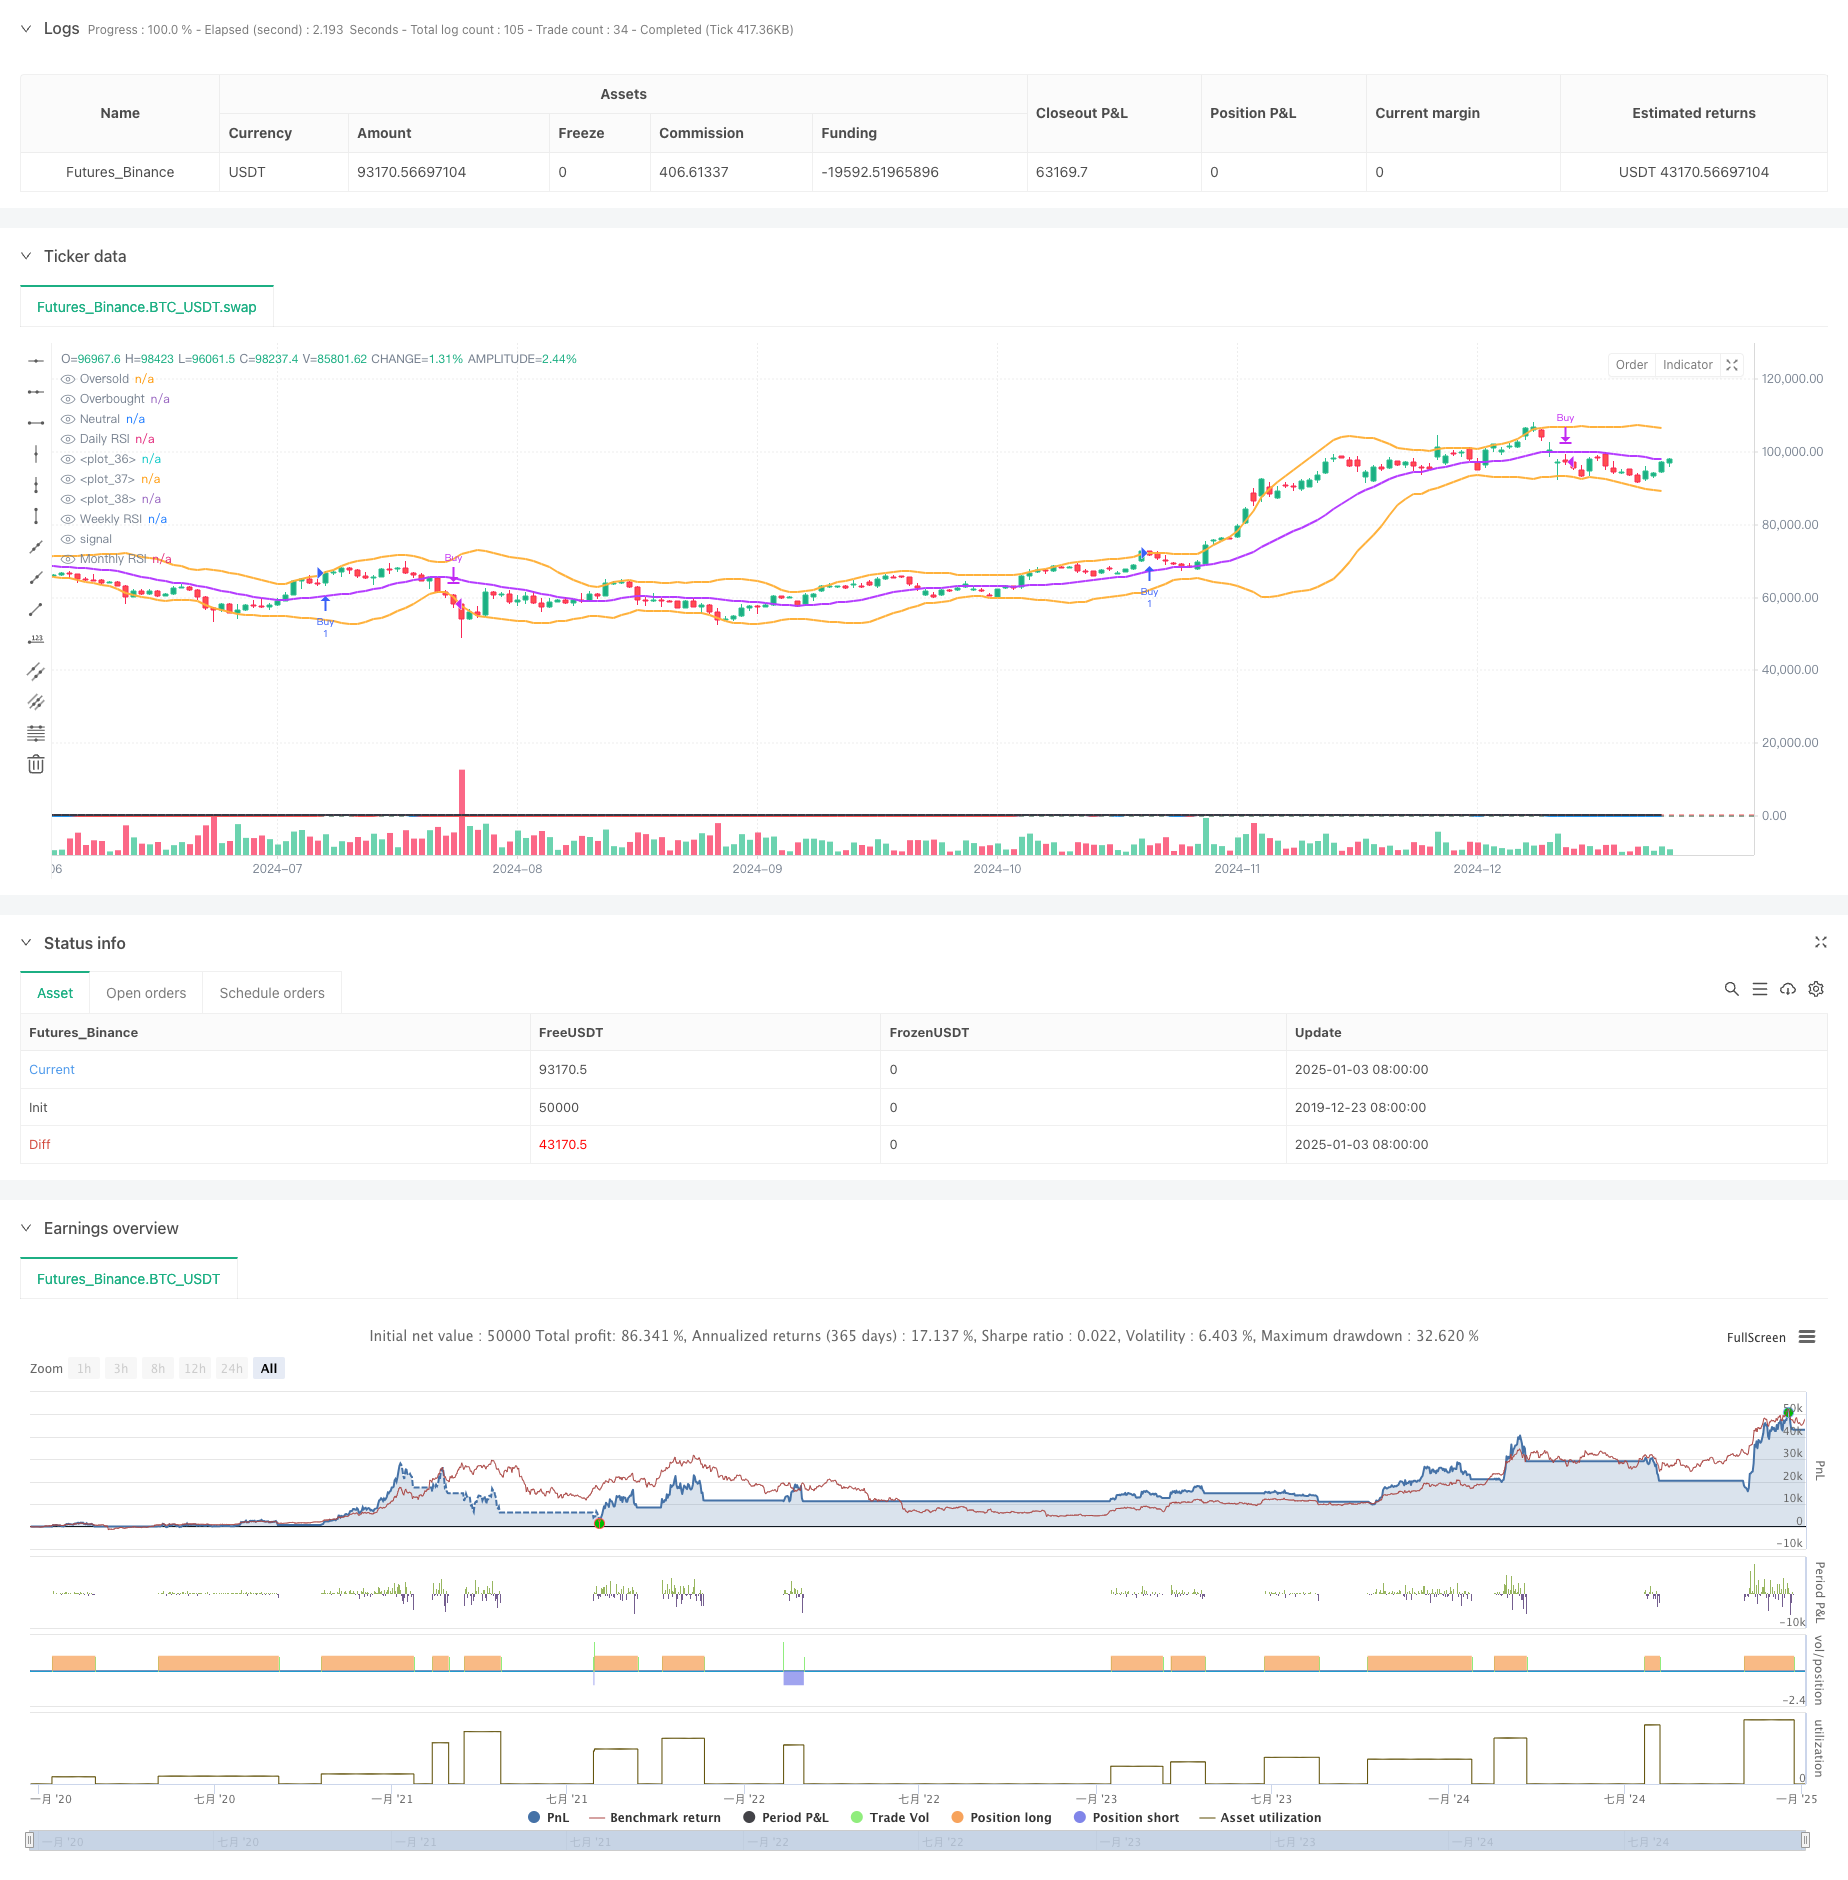
概述
该策略是一个结合了多重指标的复合型交易系统,主要基于指数移动平均线(EMA)、超级趋势指标(Supertrend)、布林带(Bollinger Bands)和相对强弱指标(RSI)的综合分析。策略核心逻辑围绕EMA和Supertrend构建交易信号,同时结合布林带和RSI提供市场波动性和动量的辅助判断。交易系统采用多周期RSI分析法,包含日线、周线和月线周期,为交易决策提供更全面的市场视角。
策略原理
策略运用了多层技术指标组合来捕捉市场趋势和波动机会: 1. 使用三重EMA(13,34,100)建立趋势跟踪系统,通过均线交叉和位置关系判断趋势方向 2. 整合Supertrend指标作为趋势确认和止损参考 3. 利用ADX指标筛选强趋势行情,设定25作为趋势强度临界值 4. 采用布林带(20,2)监测价格波动区间 5. 运用三周期RSI(14)分析市场超买超卖状态
交易信号的触发条件: - 多头入场:Supertrend转多 + EMA13上穿EMA34 + 价格站上EMA100 + ADX>25 - 空头入场:Supertrend转多 + EMA13下穿EMA34 + 价格跌破EMA100 + ADX>25 - 平仓信号:价格与Supertrend交叉时退出相应方向的持仓
策略优势
- 多重技术指标的整合提供了更可靠的交易信号,有效降低虚假信号
- 三重EMA系统能够全面把握不同周期的趋势特征
- ADX指标的引入确保只在强趋势市场中交易
- 多周期RSI分析提供了更全面的市场动能评估
- Supertrend指标提供了客观的止损位置参考
- 布林带的整合帮助判断市场波动状态和潜在的突破机会
策略风险
- 多重指标系统可能导致信号滞后,影响入场时机
- 在震荡市场中可能产生频繁的假突破信号
- 固定的ADX阈值可能在不同市场环境下表现不一致
- 快速剧烈的市场波动可能导致止损位置不合理 风险控制建议:
- 根据不同市场特征动态调整ADX阈值
- 引入波动率自适应的止损机制
- 增加交易量分析作为信号确认
策略优化方向
- 指标参数优化
- 考虑引入自适应型EMA周期
- 根据波动率动态调整Supertrend系数
- 优化布林带参数以适应不同市场阶段
- 信号系统增强
- 整合成交量因素验证交易信号
- 添加市场结构分析
- 引入波动率过滤器
- 风险管理完善
- 设计动态止损机制
- 建立仓位管理系统
- 增加交易时间过滤器
总结
该策略通过多重技术指标的有机结合,构建了一个相对完整的交易系统。EMA和Supertrend的配合提供主要交易信号,ADX的筛选确保交易发生在强趋势环境,布林带和RSI的辅助分析提供了额外的市场视角。策略的主要优势在于信号的可靠性和系统的完整性,但同时也面临信号滞后和参数优化的挑战。通过提出的优化方向,策略有望在保持稳定性的同时提升盈利能力。
策略源码
/*backtest
start: 2019-12-23 08:00:00
end: 2025-01-04 08:00:00
period: 1d
basePeriod: 1d
exchanges: [{"eid":"Futures_Binance","currency":"BTC_USDT"}]
*/

//made by Chinmay

//@version=6
strategy("CJ - Multi1", overlay=true)

// Input for RSI length
rsi_length = input.int(14, title="RSI Length")

// Calculate Daily RSI
daily_rsi = ta.rsi(close, rsi_length)

// Calculate Weekly RSI (using security function to get weekly data)
weekly_rsi = request.security(syminfo.tickerid, "W", ta.rsi(close, rsi_length))

// Calculate Monthly RSI (using security function to get weekly data)
monthly_rsi = request.security(syminfo.tickerid, "M", ta.rsi(close, rsi_length))

// Plot the RSIs
plot(daily_rsi, color=color.blue, title="Daily RSI", linewidth=2)
plot(weekly_rsi, color=color.red, title="Weekly RSI", linewidth=2)
plot(monthly_rsi, color=color.black, title="Monthly RSI", linewidth=2)

// Create horizontal lines at 30, 50, and 70 for RSI reference
hline(30, "Oversold", color=color.green)
hline(70, "Overbought", color=color.red)
hline(50, "Neutral", color=color.gray)

// Bollinger Bands Calculation
bb_length = 20
bb_mult = 2
bb_stddev = ta.stdev(close, bb_length)
bb_average = ta.sma(close, bb_length)
bb_upper = bb_average + bb_mult * bb_stddev
bb_lower = bb_average - bb_mult * bb_stddev

plot(bb_upper, color=color.new(#ffb13b, 0), linewidth=2)
plot(bb_average, color=color.new(#b43bff, 0), linewidth=2)
plot(bb_lower, color=color.new(#ffb13b, 0), linewidth=2)

// Inputs for EMA
ema_L1 = input.int(defval=13, title="EMA Length 1")
ema_L2 = input.int(defval=34, title="EMA Length 2")
ema_L3 = input.int(defval=100, title="EMA Length 3")
adx_level = input.int(defval=25, title="ADX Level")

// Inputs for Supertrend
atr_l = input.int(defval=10, title="ATR Length")
factor = input.float(defval=3.0, title="Supertrend Multiplier")

// Calculate EMA
ema1 = ta.ema(close, ema_L1)
ema2 = ta.ema(close, ema_L2)
ema3 = ta.ema(close, ema_L3)

// Calculate Supertrend
[supertrend, direction] = ta.supertrend(factor, atr_l)

// Calculate ADX and DI
[diplus, diminus, adx] = ta.dmi(14,14)

// Buy and Sell Conditions
buy = direction == -1 and ema1 > ema2 and close > ta.ema(close, 100) and adx > adx_level
short = direction == -1 and ema1 < ema2 and close < ta.ema(close, 100) and adx > adx_level

sell = ta.crossunder(close, supertrend)
cover = ta.crossover(close, supertrend)

// Strategy Logic
if buy
    strategy.entry("Buy", strategy.long, comment="Long Entry")

if sell
    strategy.close("Buy", comment="Sell Exit")

// Uncomment for Short Strategy
if short
    strategy.entry("Short", strategy.short, comment="Short Entry")

if cover
    strategy.close("Short", comment="Cover Exit")
相关推荐