概述
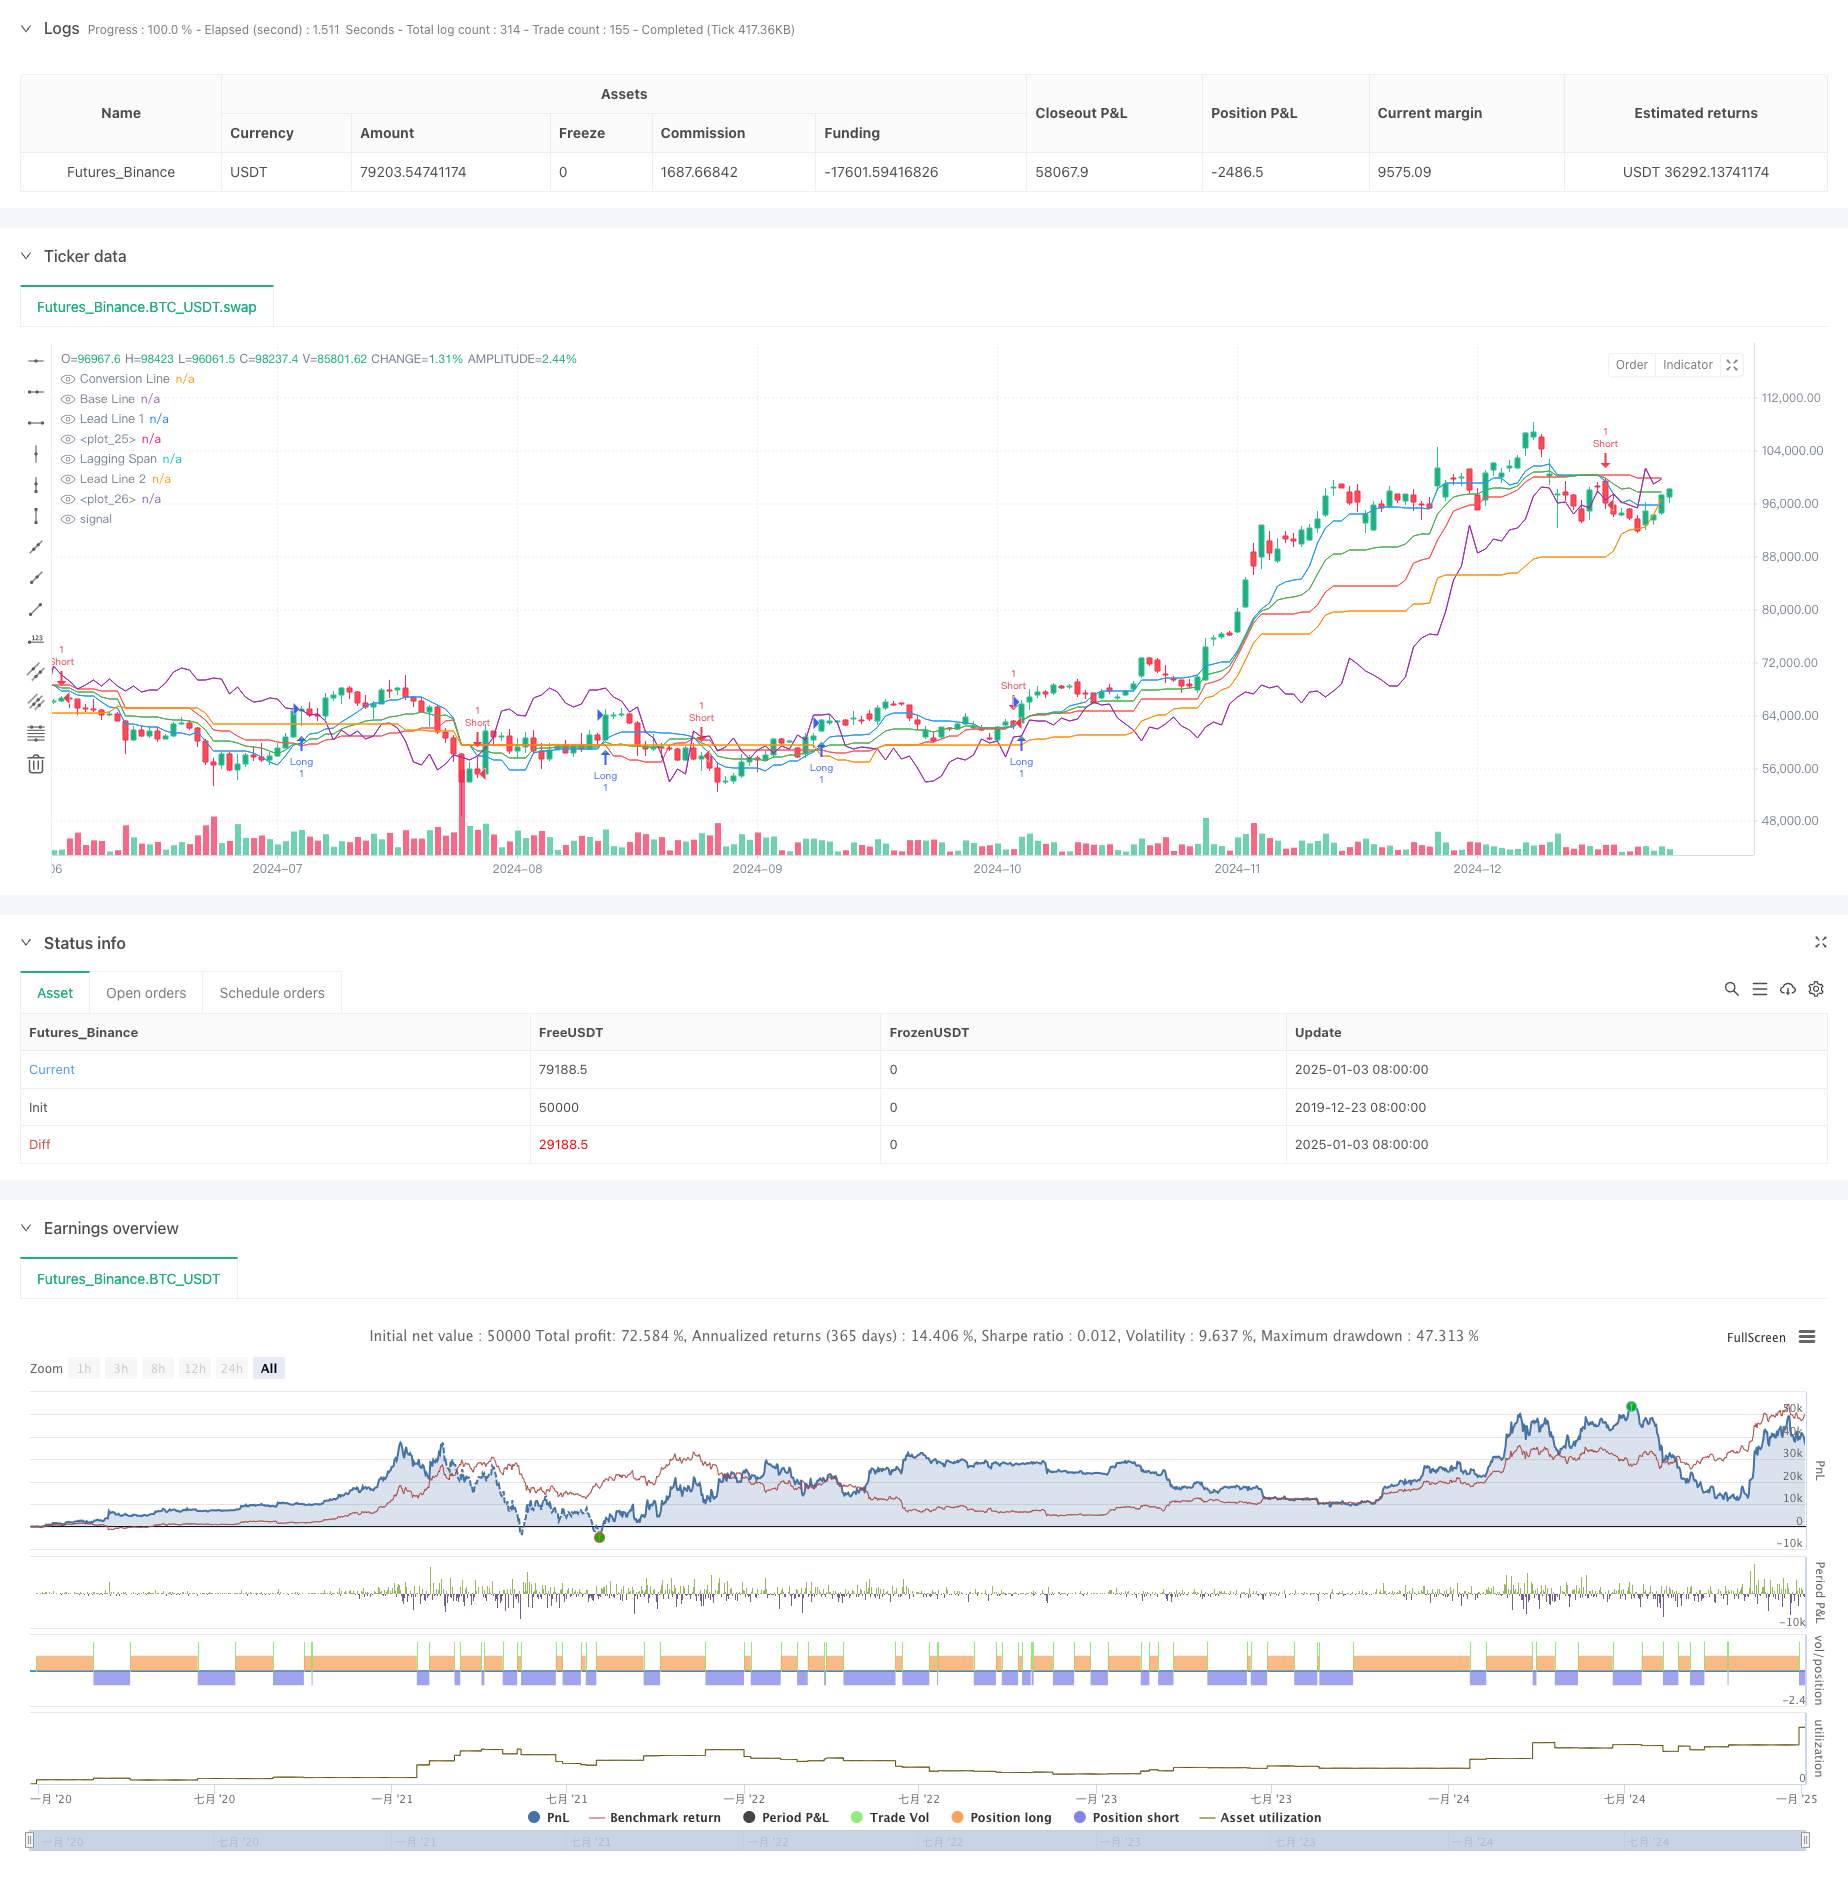
本策略是一个基于一目均衡图(Ichimoku Cloud)指标的趋势跟踪交易系统。该策略利用转换线(Conversion Line)与基准线(Base Line)的交叉来产生交易信号,同时结合云图(Cloud)的支撑与阻力区域来确认趋势方向,从而实现对市场趋势的把握和交易时机的捕捉。策略的核心思想是通过多周期移动平均线的动态交叉来识别趋势的转换点,并在趋势确立时进行相应的交易。
策略原理
策略主要基于以下几个关键组件: 1. 转换线(9周期):反映短期价格动量 2. 基准线(26周期):反映中期价格趋势 3. 先行带1和2:构成云图区域,提供支撑阻力参考 4. 滞后线:用于确认趋势的持续性
交易信号的触发条件: - 买入信号:转换线向上穿越基准线 - 卖出信号:转换线向下穿越基准线
策略优势
- 多维度趋势确认:通过转换线、基准线和云图多个维度来确认趋势,降低假突破的风险
- 动态支撑阻力:云图区域提供动态的支撑和阻力水平,适应市场变化
- 趋势持续性验证:利用滞后线来验证趋势的持续性,提高交易的可靠性
- 参数可调整性:各项参数可根据不同市场特征进行优化调整
- 视觉直观:云图的可视化展示使趋势判断更加直观
策略风险
- 横盘市场表现欠佳:在震荡市场中可能产生频繁的假信号
- 滞后性风险:由于使用较长周期的移动平均线,可能在趋势转折点反应较慢
- 参数敏感性:不同参数设置对策略表现影响较大
- 市场环境依赖:策略在强趋势市场表现较好,但在其他市场环境下可能效果欠佳
- 止损控制:策略本身缺乏明确的止损机制
策略优化方向
- 引入波动率过滤:添加ATR指标来过滤小波动的交叉信号
- 整合量能指标:结合成交量指标来确认趋势的有效性
- 优化止损机制:设计基于云图区域的动态止损方案
- 增加趋势强度过滤:引入ADX等趋势强度指标来过滤弱趋势环境
- 改进信号确认机制:增加价格形态分析来提高信号可靠性
总结
该策略通过一目均衡图的多维度分析为交易决策提供了系统化的框架。策略的优势在于能够全面把握市场趋势,但同时也存在一定的滞后性和市场环境依赖性。通过引入补充指标和优化信号确认机制,策略的实用性和可靠性可以得到进一步提升。在实际应用中,建议根据具体市场特征对参数进行优化调整,并结合其他技术指标来增强策略的稳定性。
策略源码
/*backtest
start: 2019-12-23 08:00:00
end: 2025-01-04 08:00:00
period: 1d
basePeriod: 1d
exchanges: [{"eid":"Futures_Binance","currency":"BTC_USDT"}]
*/

//@version=5
strategy("Ichimoku Cloud Strategy", overlay=true)

// Ichimoku Settings
conversionPeriods = input(9, title="Conversion Line Period")
basePeriods = input(26, title="Base Line Period")
laggingSpan2Periods = input(52, title="Lagging Span 2 Period")
displacement = input(26, title="Displacement")

// Ichimoku Calculation
conversionLine = (ta.highest(high, conversionPeriods) + ta.lowest(low, conversionPeriods)) / 2
baseLine = (ta.highest(high, basePeriods) + ta.lowest(low, basePeriods)) / 2
leadLine1 = (conversionLine + baseLine) / 2
leadLine2 = (ta.highest(high, laggingSpan2Periods) + ta.lowest(low, laggingSpan2Periods)) / 2
laggingSpan = ta.valuewhen(close, close, 0)[displacement]

// Plot Ichimoku Cloud
plot(conversionLine, title="Conversion Line", color=color.blue)
plot(baseLine, title="Base Line", color=color.red)
plot(leadLine1, title="Lead Line 1", color=color.green)
plot(leadLine2, title="Lead Line 2", color=color.orange)
plot(laggingSpan, title="Lagging Span", color=color.purple)

// Cloud Fill
plot(leadLine1, color=color.new(color.green, 90))
plot(leadLine2, color=color.new(color.red, 90))

// Signals
buySignal = ta.crossover(conversionLine, baseLine)
sellSignal = ta.crossunder(conversionLine, baseLine)

// Execute Trades
if buySignal
    strategy.entry("Long", strategy.long)
if sellSignal
    strategy.entry("Short", strategy.short)

// Debugging Plots
plotshape(buySignal, style=shape.triangleup, location=location.belowbar, color=color.green, size=size.small)
plotshape(sellSignal, style=shape.triangledown, location=location.abovebar, color=color.red, size=size.small)
相关推荐