概述
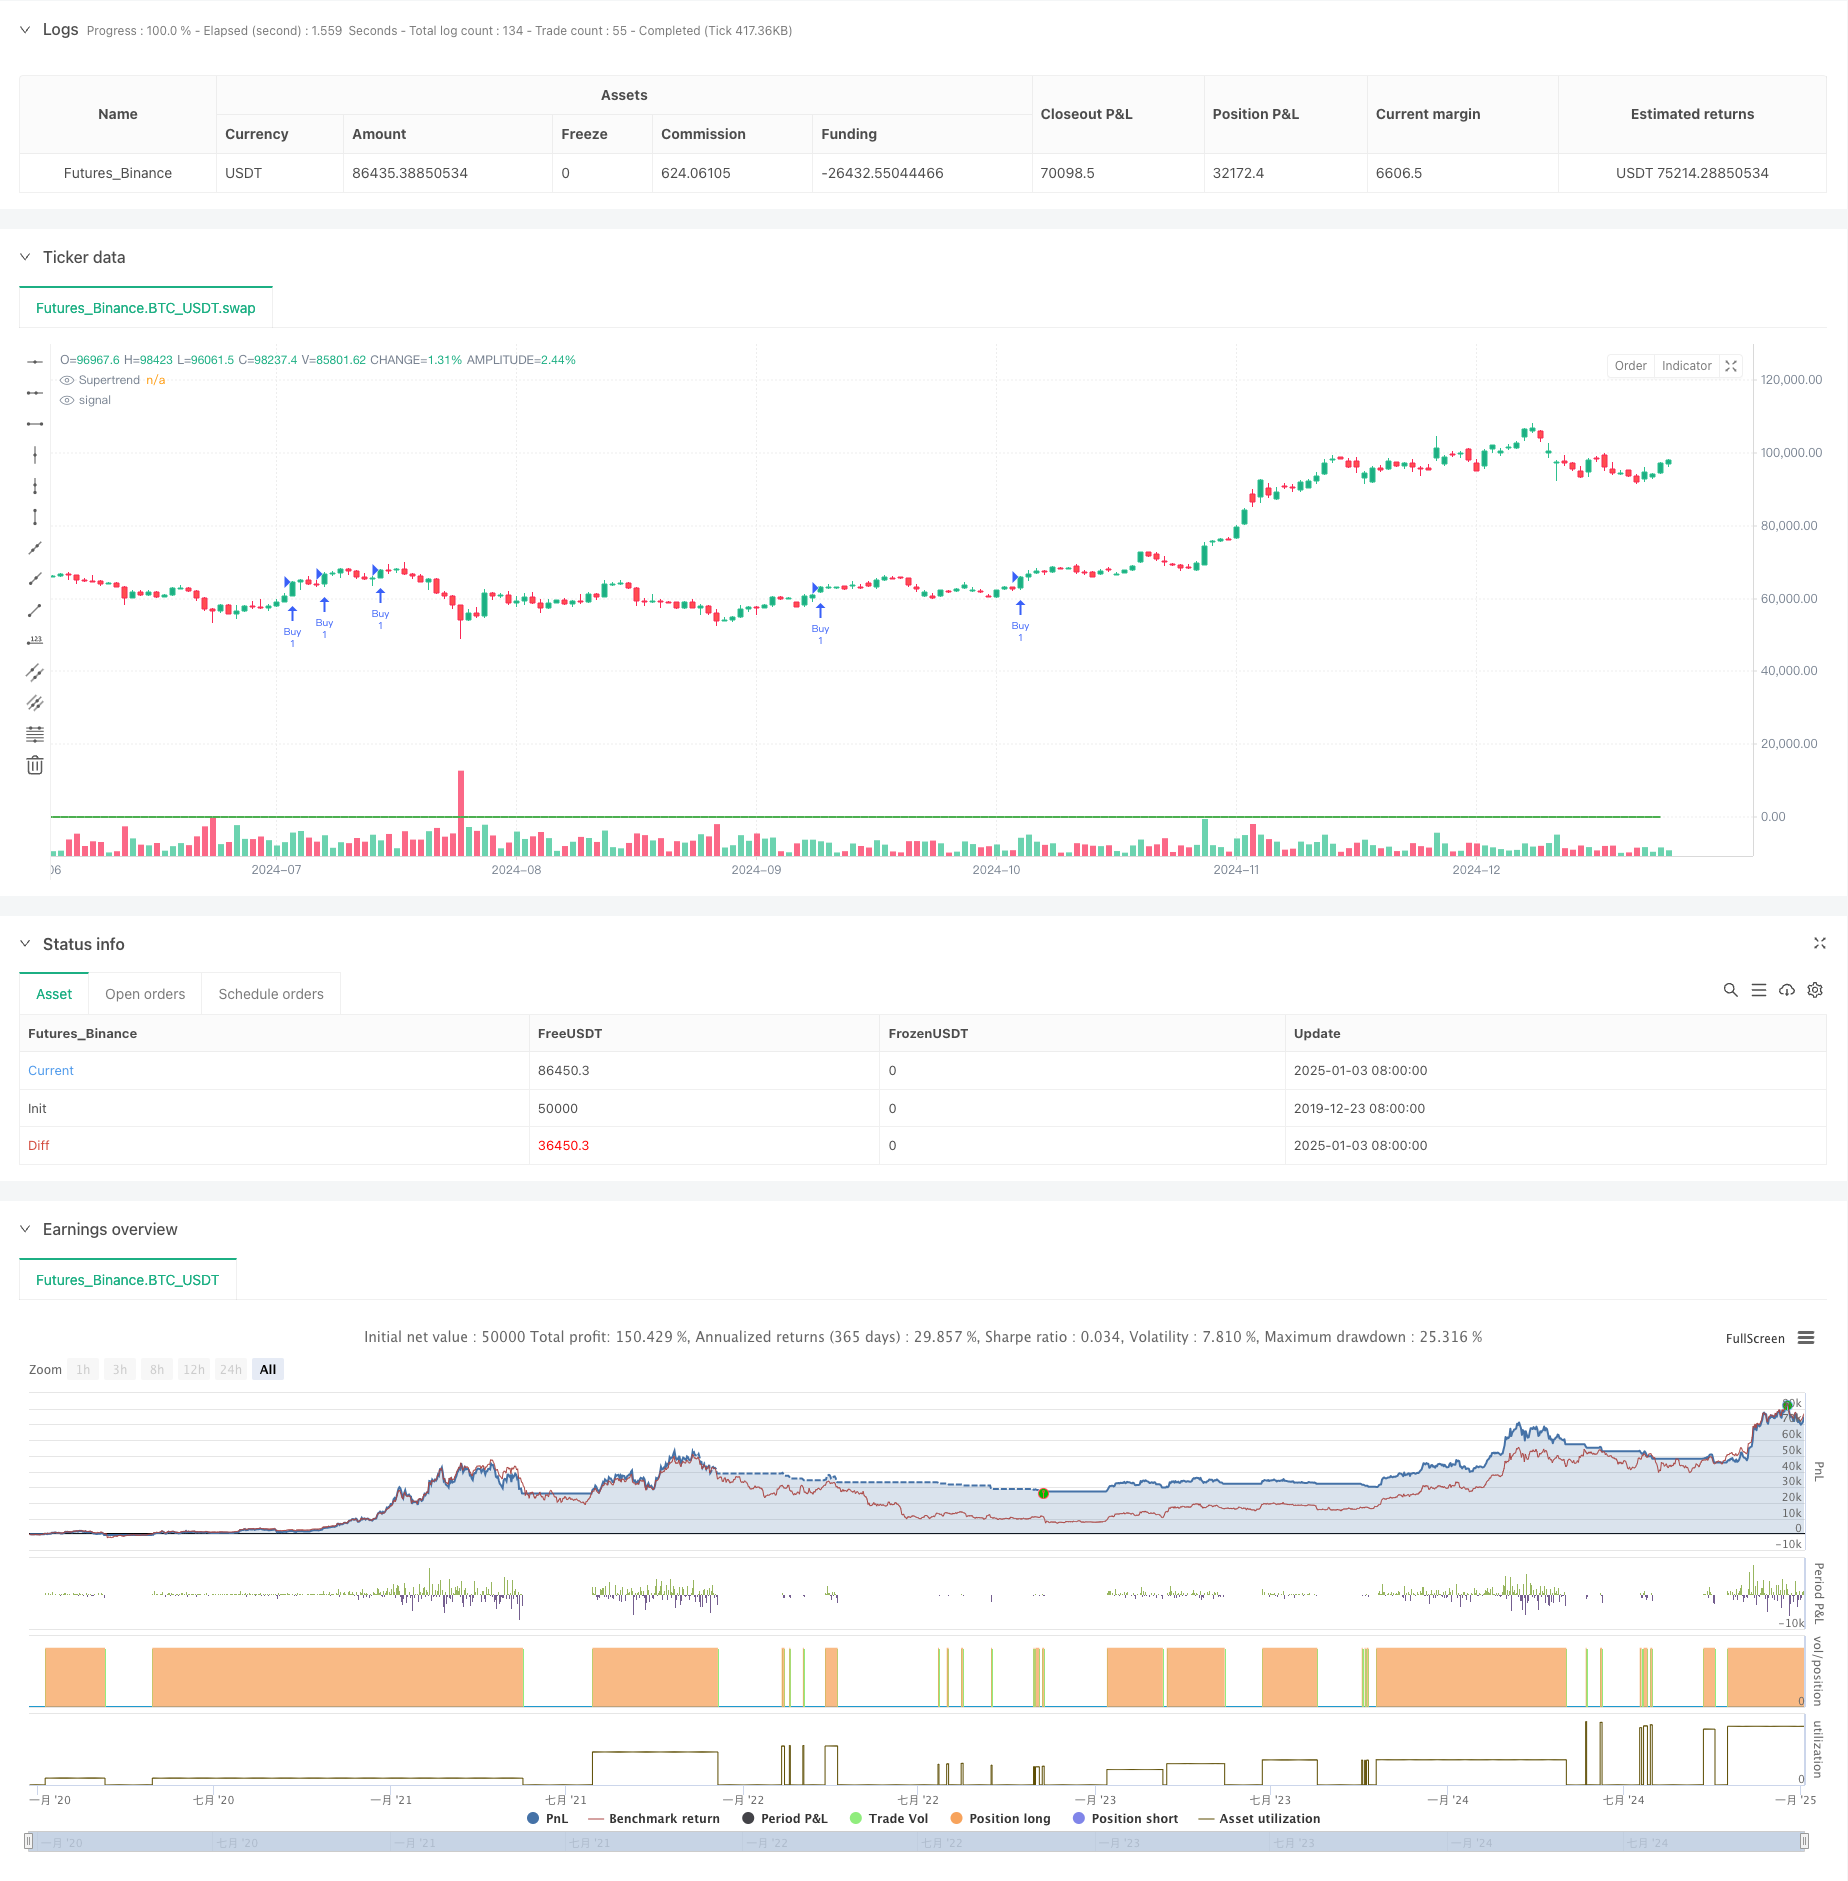
该策略是一个基于Supertrend、相对强弱(RS)和相对强弱指标(RSI)的趋势跟踪策略。通过综合运用这三个技术指标,在市场趋势明确时进场交易,并设置动态止损来控制风险。策略主要通过捕捉价格强势上涨趋势来获取收益,同时结合RSI指标来确认趋势的持续性。
策略原理
策略采用三重过滤机制来确定交易信号: 1. 使用Supertrend指标判断整体趋势,当指标方向向上时视为上涨趋势。 2. 计算相对强弱(RS)值,将当前价格在过去55个周期的高低点区间中的位置百分比化,用于衡量价格强度。 3. 利用RSI指标判断超买超卖状态,当RSI大于60时确认上涨动能。 交易进场需同时满足以上三个条件,即Supertrend向上、RS大于0且RSI大于阈值。 出场条件则是任意两个指标发出反向信号时。同时设置1.1%的固定止损来管理风险。
策略优势
- 多重技术指标确认,提高交易信号的可靠性。
- Supertrend指标能有效跟踪趋势,减少震荡市场的假信号。
- RS指标能及时捕捉价格强弱变化,提高入场时机的准确性。
- RSI指标可以确认趋势动能,避免在趋势衰竭时入场。
- 固定止损设置明确的风险控制边界。
- 出场条件灵活,能及时响应市场变化。
策略风险
- 多重指标可能导致信号滞后,错过最佳入场时机。
- 在震荡市场中可能频繁交易,增加交易成本。
- 固定止损可能在波动较大的市场中被轻易触发。
- RSI指标在趋势强劲时可能长期处于超买区,错过交易机会。
- 多个出场条件可能导致过早退出盈利趋势。
策略优化方向
- 引入自适应的指标参数,根据市场波动度动态调整。
- 增加成交量指标作为辅助确认,提高信号可靠性。
- 设计动态止损机制,根据ATR值调整止损幅度。
- 优化RSI阈值,可考虑在不同市场条件下使用不同阈值。
- 增加趋势强度过滤,在弱趋势市场减少交易频率。
- 考虑加入移动止盈机制,更好地锁定利润。
总结
该策略通过综合运用Supertrend、RS和RSI三个技术指标,构建了一个相对完善的趋势跟踪交易系统。策略的主要优势在于多重信号确认机制提高了交易的可靠性,同时清晰的风险控制机制也为交易提供了保障。虽然存在一些潜在风险,但通过建议的优化方向可以进一步提升策略的稳定性和盈利能力。该策略特别适合在趋势明确的市场环境中使用,可以作为中长期交易的基础策略框架。
策略源码
/*backtest
start: 2019-12-23 08:00:00
end: 2025-01-04 08:00:00
period: 1d
basePeriod: 1d
exchanges: [{"eid":"Futures_Binance","currency":"BTC_USDT"}]
*/

//@version=5
strategy("Sanjay RS&RSI Strategy V3 for nifty 15min, SL-1.3", overlay=true)

// Inputs
atrLength = input.int(10, title="ATR Length")
factor = input.float(3.0, title="ATR Multiplier")
rsPeriod = input.int(55, title="RS Period")
rsiPeriod = input.int(14, title="RSI Period")
rsiThreshold = input.float(60, title="RSI Threshold")
stopLossPercent = input.float(2.0, title="Stop Loss (%)", step=0.1) // Adjustable Stop Loss in Percentage

// Supertrend Calculation
[supertrendDirection, supertrend] = ta.supertrend(factor, atrLength)

// RS Calculation
rs = (close - ta.lowest(close, rsPeriod)) / (ta.highest(close, rsPeriod) - ta.lowest(close, rsPeriod)) * 100

// RSI Calculation
rsi = ta.rsi(close, rsiPeriod)

// Entry Conditions
buyCondition = (supertrendDirection > 0) and (rs > 0) and (rsi > rsiThreshold)

// Exit Conditions
exitCondition1 = (supertrendDirection < 0)
exitCondition2 = (rs <= 0)
exitCondition3 = (rsi < rsiThreshold)
exitCondition = (exitCondition1 and exitCondition2) or (exitCondition1 and exitCondition3) or (exitCondition2 and exitCondition3)

// Plot Supertrend
plot(supertrend, title="Supertrend", color=supertrendDirection > 0 ? color.green : color.red, linewidth=2)

// Strategy Entry
if (buyCondition)
    strategy.entry("Buy", strategy.long)

// Add Stop Loss with strategy.exit
stopLossLevel = strategy.position_avg_price * (1 - stopLossPercent / 100)
strategy.exit("SL Exit", from_entry="Buy", stop=stopLossLevel)

// Strategy Exit (Additional Conditions)
if (exitCondition)
    strategy.close("Buy")
相关推荐