概述
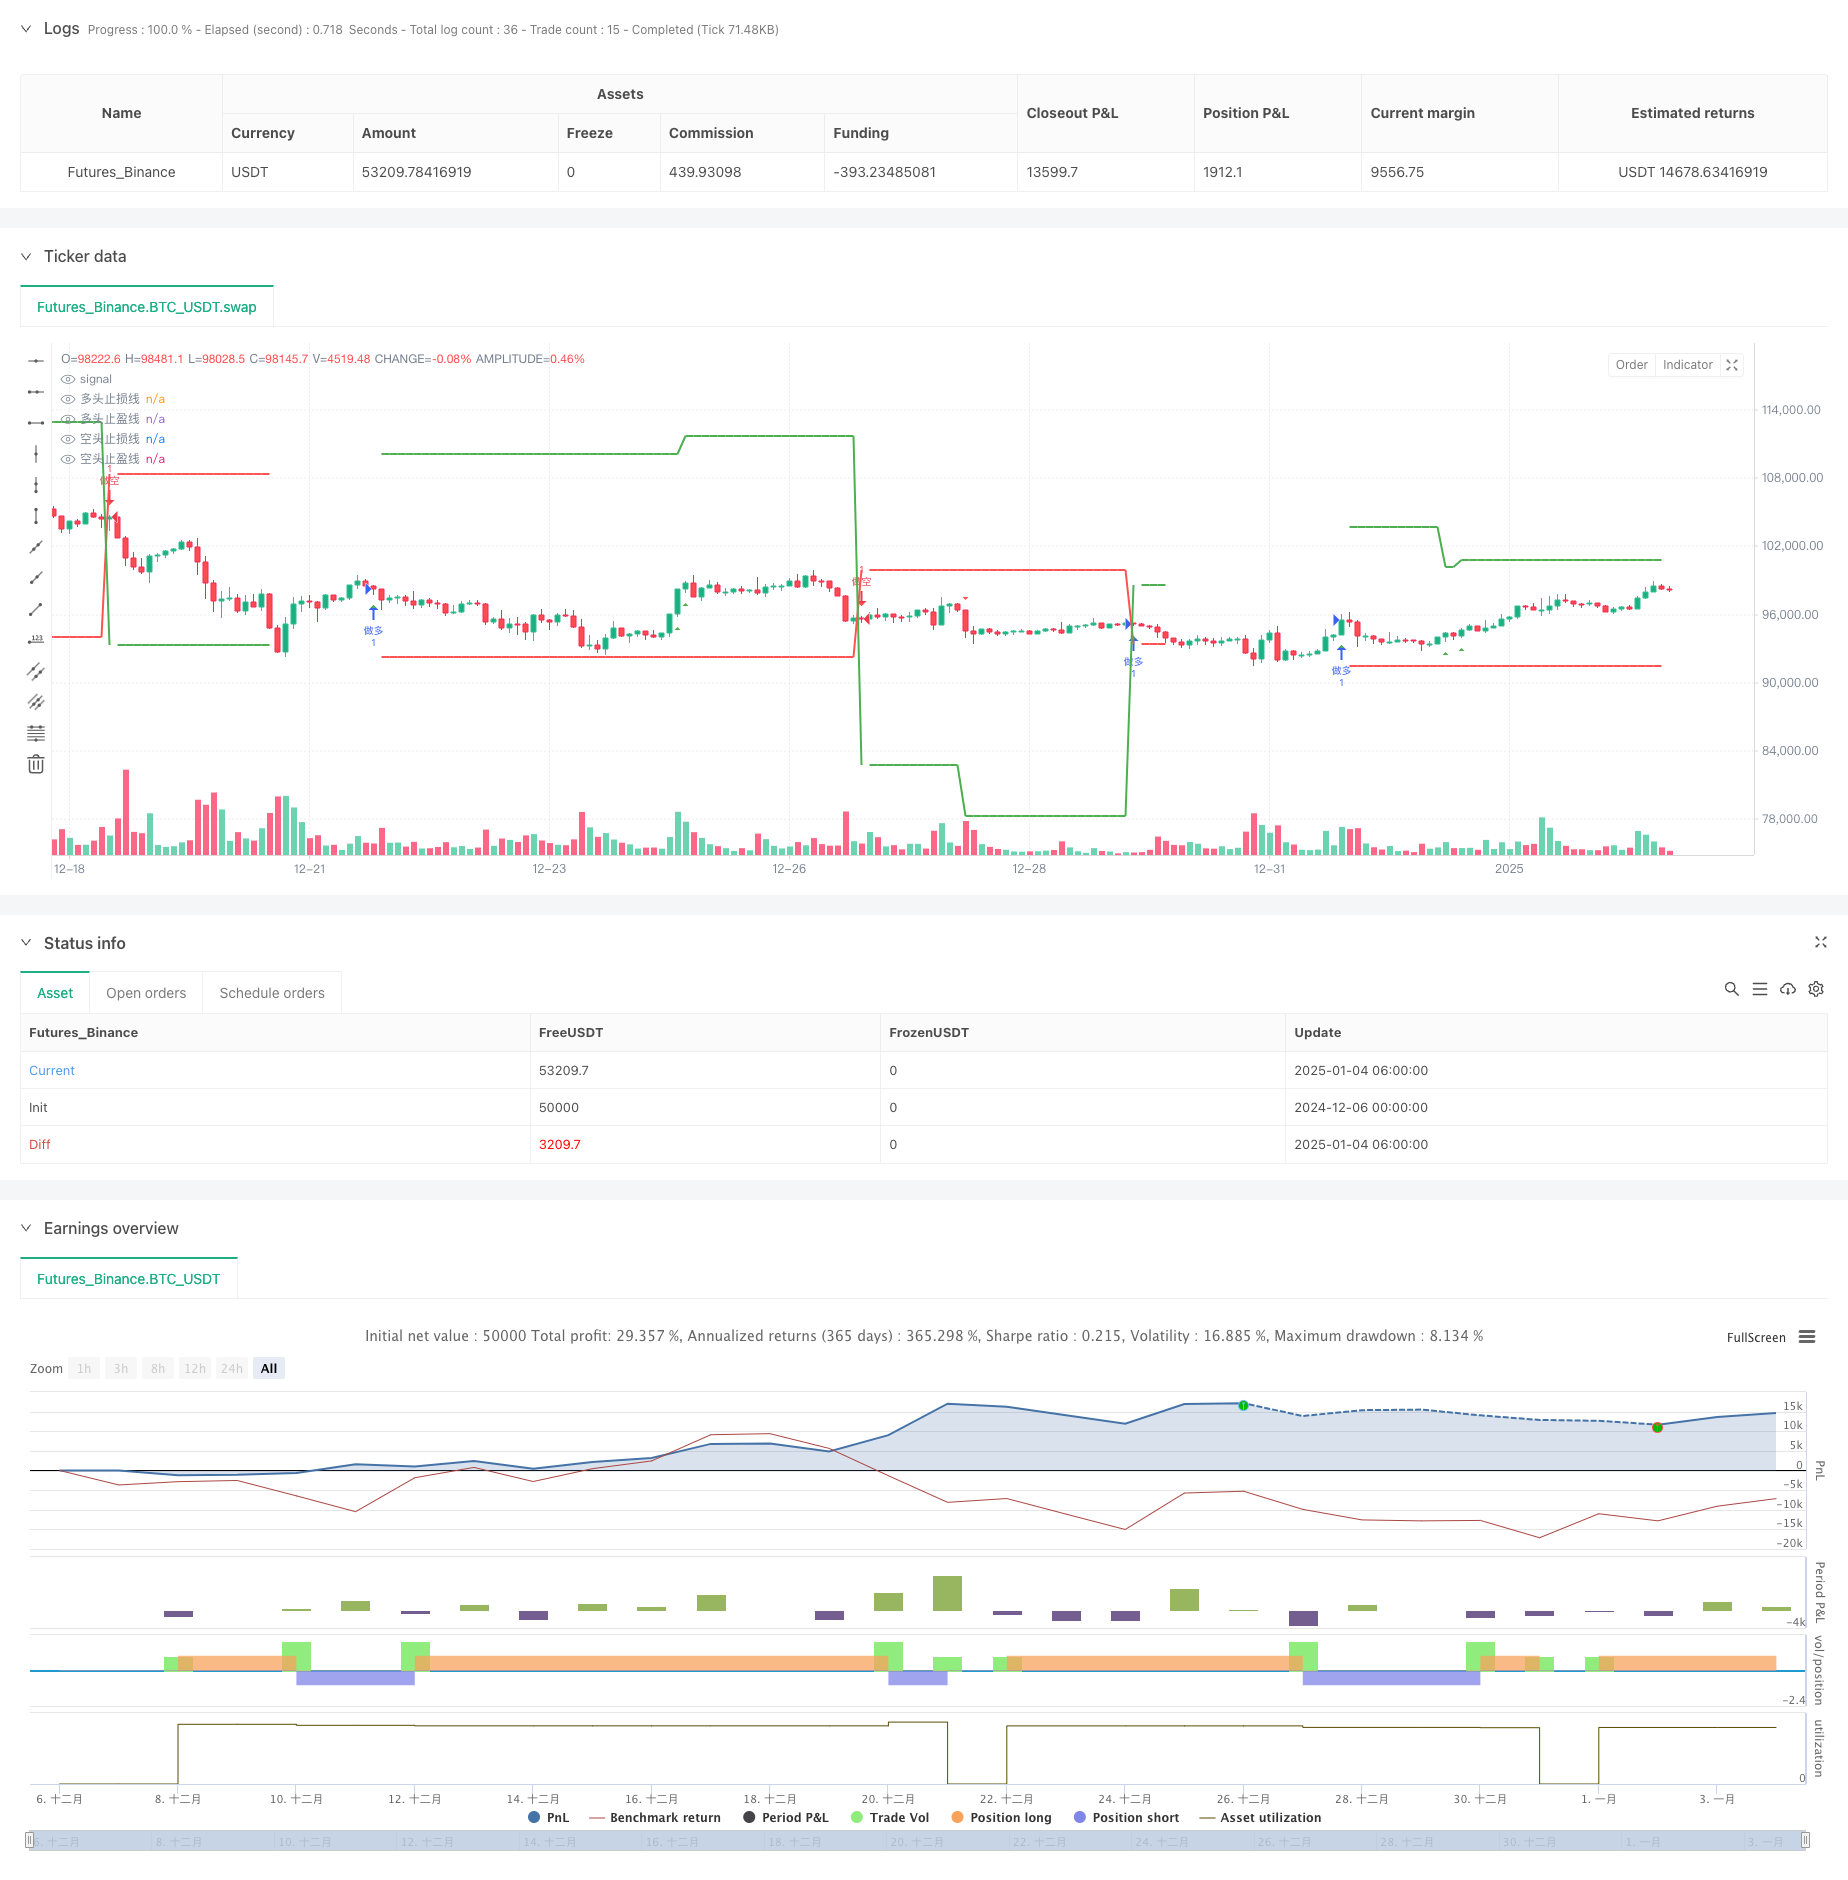
该策略是一个结合了WaveTrend震荡指标和EMA均线带的高级交易系统。通过融合这两个技术指标,形成了一个能够准确捕捉市场趋势转折点的交易策略。策略采用了动态的止盈止损设置,在保护资金安全的同时追求更高的收益。
策略原理
策略的核心是通过WaveTrend指标和八条EMA均线的协同配合来识别交易信号。WaveTrend指标通过计算价格与移动平均线之间的偏离度来衡量市场超买超卖状态。EMA均线带则通过不同周期均线的交叉来确认趋势方向。具体来说: 1. 当EMA2上穿EMA8,或者出现蓝色三角形信号(EMA2上穿EMA3)且不存在血色钻石形态时,触发做多信号 2. 当EMA8上穿EMA2,或者出现血色钻石形态时,触发做空信号 3. 止损设置采用前一次反向信号后的极值点,这样可以有效控制风险 4. 止盈目标设定为止损距离的2-3倍,体现良好的风险收益比
策略优势
- 双重确认机制提高了交易信号的可靠性
- 动态止损设置能够更好地适应市场波动
- 具有清晰的风险收益比设定
- EMA均线带的使用有助于判断整体市场趋势
- WaveTrend指标能够有效识别市场超买超卖状态
- 策略逻辑清晰,易于理解和执行
策略风险
- 在震荡市场中可能产生频繁的假信号
- 动态止损可能在剧烈波动时被轻易触发
- 依赖历史数据计算的指标在市场剧变时可能失效
- 多个技术指标的使用可能导致信号滞后 解决方案:
- 可以添加波动率过滤器来减少震荡市场的假信号
- 考虑使用更宽松的止损设置
- 增加趋势强度确认机制
策略优化方向
- 引入市场波动率指标(如ATR)来动态调整止损距离
- 添加成交量确认机制来提高信号可靠性
- 考虑加入趋势强度过滤器,只在强趋势市场中交易
- 优化WaveTrend参数,使其更好地适应不同市场环境
- 研究不同时间周期的信号协同作用
总结
这是一个将技术分析中的趋势跟踪和震荡指标相结合的完整交易系统。通过WaveTrend和EMA均线带的配合使用,既能把握大趋势,又能在趋势转折点及时入场。动态的止盈止损管理机制则为策略提供了良好的风险控制能力。策略的优化空间主要在于信号过滤和风险管理方面的改进。
策略源码
/*backtest
start: 2024-12-06 00:00:00
end: 2025-01-04 08:00:00
period: 2h
basePeriod: 2h
exchanges: [{"eid":"Futures_Binance","currency":"BTC_USDT"}]
*/

//@version=5
strategy("VuManChu Cipher A Strategy", overlay=true, initial_capital=10000, default_qty_type=strategy.fixed, default_qty_value=1.0)

// === 函数定义 ===
// WaveTrend函数
f_wavetrend(_src, _chlen, _avg, _malen) =>
    _esa = ta.ema(_src, _chlen)
    _de = ta.ema(math.abs(_src - _esa), _chlen)
    _ci = (_src - _esa) / (0.015 * _de)
    _tci = ta.ema(_ci, _avg)
    _wt1 = _tci
    _wt2 = ta.sma(_wt1, _malen)
    [_wt1, _wt2]

// EMA Ribbon函数
f_emaRibbon(_src, _e1, _e2, _e3, _e4, _e5, _e6, _e7, _e8) =>
    _ema1 = ta.ema(_src, _e1)
    _ema2 = ta.ema(_src, _e2)
    _ema3 = ta.ema(_src, _e3)
    _ema4 = ta.ema(_src, _e4)
    _ema5 = ta.ema(_src, _e5)
    _ema6 = ta.ema(_src, _e6)
    _ema7 = ta.ema(_src, _e7)
    _ema8 = ta.ema(_src, _e8)
    [_ema1, _ema2, _ema3, _ema4, _ema5, _ema6, _ema7, _ema8]

// === 变量声明 ===
var float stopPrice = na      // 止损价格变量
var float targetPrice = na    // 止盈价格变量
var float lastLongPrice = na
var float lastShortPrice = na
var float highestSinceLastLong = na
var float lowestSinceLastShort = na

// === WaveTrend参数 ===
wtChannelLen = input.int(9, title = 'WT Channel Length')
wtAverageLen = input.int(13, title = 'WT Average Length')
wtMASource = hlc3
wtMALen = input.int(3, title = 'WT MA Length')

// === EMA Ribbon参数 ===
ema1Len = input.int(5, "EMA 1 Length")
ema2Len = input.int(11, "EMA 2 Length")
ema3Len = input.int(15, "EMA 3 Length")
ema4Len = input.int(18, "EMA 4 Length")
ema5Len = input.int(21, "EMA 5 Length")
ema6Len = input.int(24, "EMA 6 Length")
ema7Len = input.int(28, "EMA 7 Length")
ema8Len = input.int(34, "EMA 8 Length")

// === 计算指标 ===
// WaveTrend计算
[wt1, wt2] = f_wavetrend(wtMASource, wtChannelLen, wtAverageLen, wtMALen)

// WaveTrend交叉条件
wtCross = ta.cross(wt1, wt2)
wtCrossDown = wt2 - wt1 >= 0

// EMA Ribbon计算
[ema1, ema2, ema3, ema4, ema5, ema6, ema7, ema8] = f_emaRibbon(close, ema1Len, ema2Len, ema3Len, ema4Len, ema5Len, ema6Len, ema7Len, ema8Len)

// === 交易信号 ===
longEma = ta.crossover(ema2, ema8)
shortEma = ta.crossover(ema8, ema2)
redCross = ta.crossunder(ema1, ema2)
blueTriangle = ta.crossover(ema2, ema3)
redDiamond = wtCross and wtCrossDown
bloodDiamond = redDiamond and redCross

// 更新最高最低价
if not na(lastLongPrice)
    highestSinceLastLong := math.max(high, nz(highestSinceLastLong))
if not na(lastShortPrice)
    lowestSinceLastShort := math.min(low, nz(lowestSinceLastShort))

// === 交易信号条件 ===
longCondition = longEma or (blueTriangle and not bloodDiamond)
shortCondition = shortEma or bloodDiamond

// === 执行交易 ===
if (longCondition)
    // 记录多头入场价格
    lastLongPrice := close
    // 重置最高价跟踪
    highestSinceLastLong := high

    stopPrice := nz(lowestSinceLastShort, close * 0.98)  // 使用前一个空头信号后的最低价作为止损
    float riskAmount = math.abs(close - stopPrice)
    targetPrice := close + (riskAmount * 2)  // 止盈为止损距离的2倍

    strategy.entry("做多", strategy.long)
    strategy.exit("多头止盈止损", "做多", limit=targetPrice, stop=stopPrice)

if (shortCondition)
    // 记录空头入场价格
    lastShortPrice := close
    // 重置最低价跟踪
    lowestSinceLastShort := low

    stopPrice := nz(highestSinceLastLong, close * 1.02)  // 使用前一个多头信号后的最高价作为止损
    float riskAmount = math.abs(stopPrice - close)
    targetPrice := close - (riskAmount * 3)  // 止盈为止损距离的2倍

    strategy.entry("做空", strategy.short)
    strategy.exit("空头止盈止损", "做空", limit=targetPrice, stop=stopPrice)

// === 绘制信号 ===
plotshape(longCondition, style=shape.triangleup, color=color.green, location=location.belowbar, size=size.small, title="做多信号")
plotshape(shortCondition, style=shape.triangledown, color=color.red, location=location.abovebar, size=size.small, title="做空信号")

// 绘制止损线
plot(strategy.position_size > 0 ? stopPrice : na, color=color.red, style=plot.style_linebr, linewidth=2, title="多头止损线")
plot(strategy.position_size < 0 ? stopPrice : na, color=color.red, style=plot.style_linebr, linewidth=2, title="空头止损线")

// 绘制止盈线
plot(strategy.position_size > 0 ? targetPrice : na, color=color.green, style=plot.style_linebr, linewidth=2, title="多头止盈线")
plot(strategy.position_size < 0 ? targetPrice : na, color=color.green, style=plot.style_linebr, linewidth=2, title="空头止盈线")
相关推荐