概述
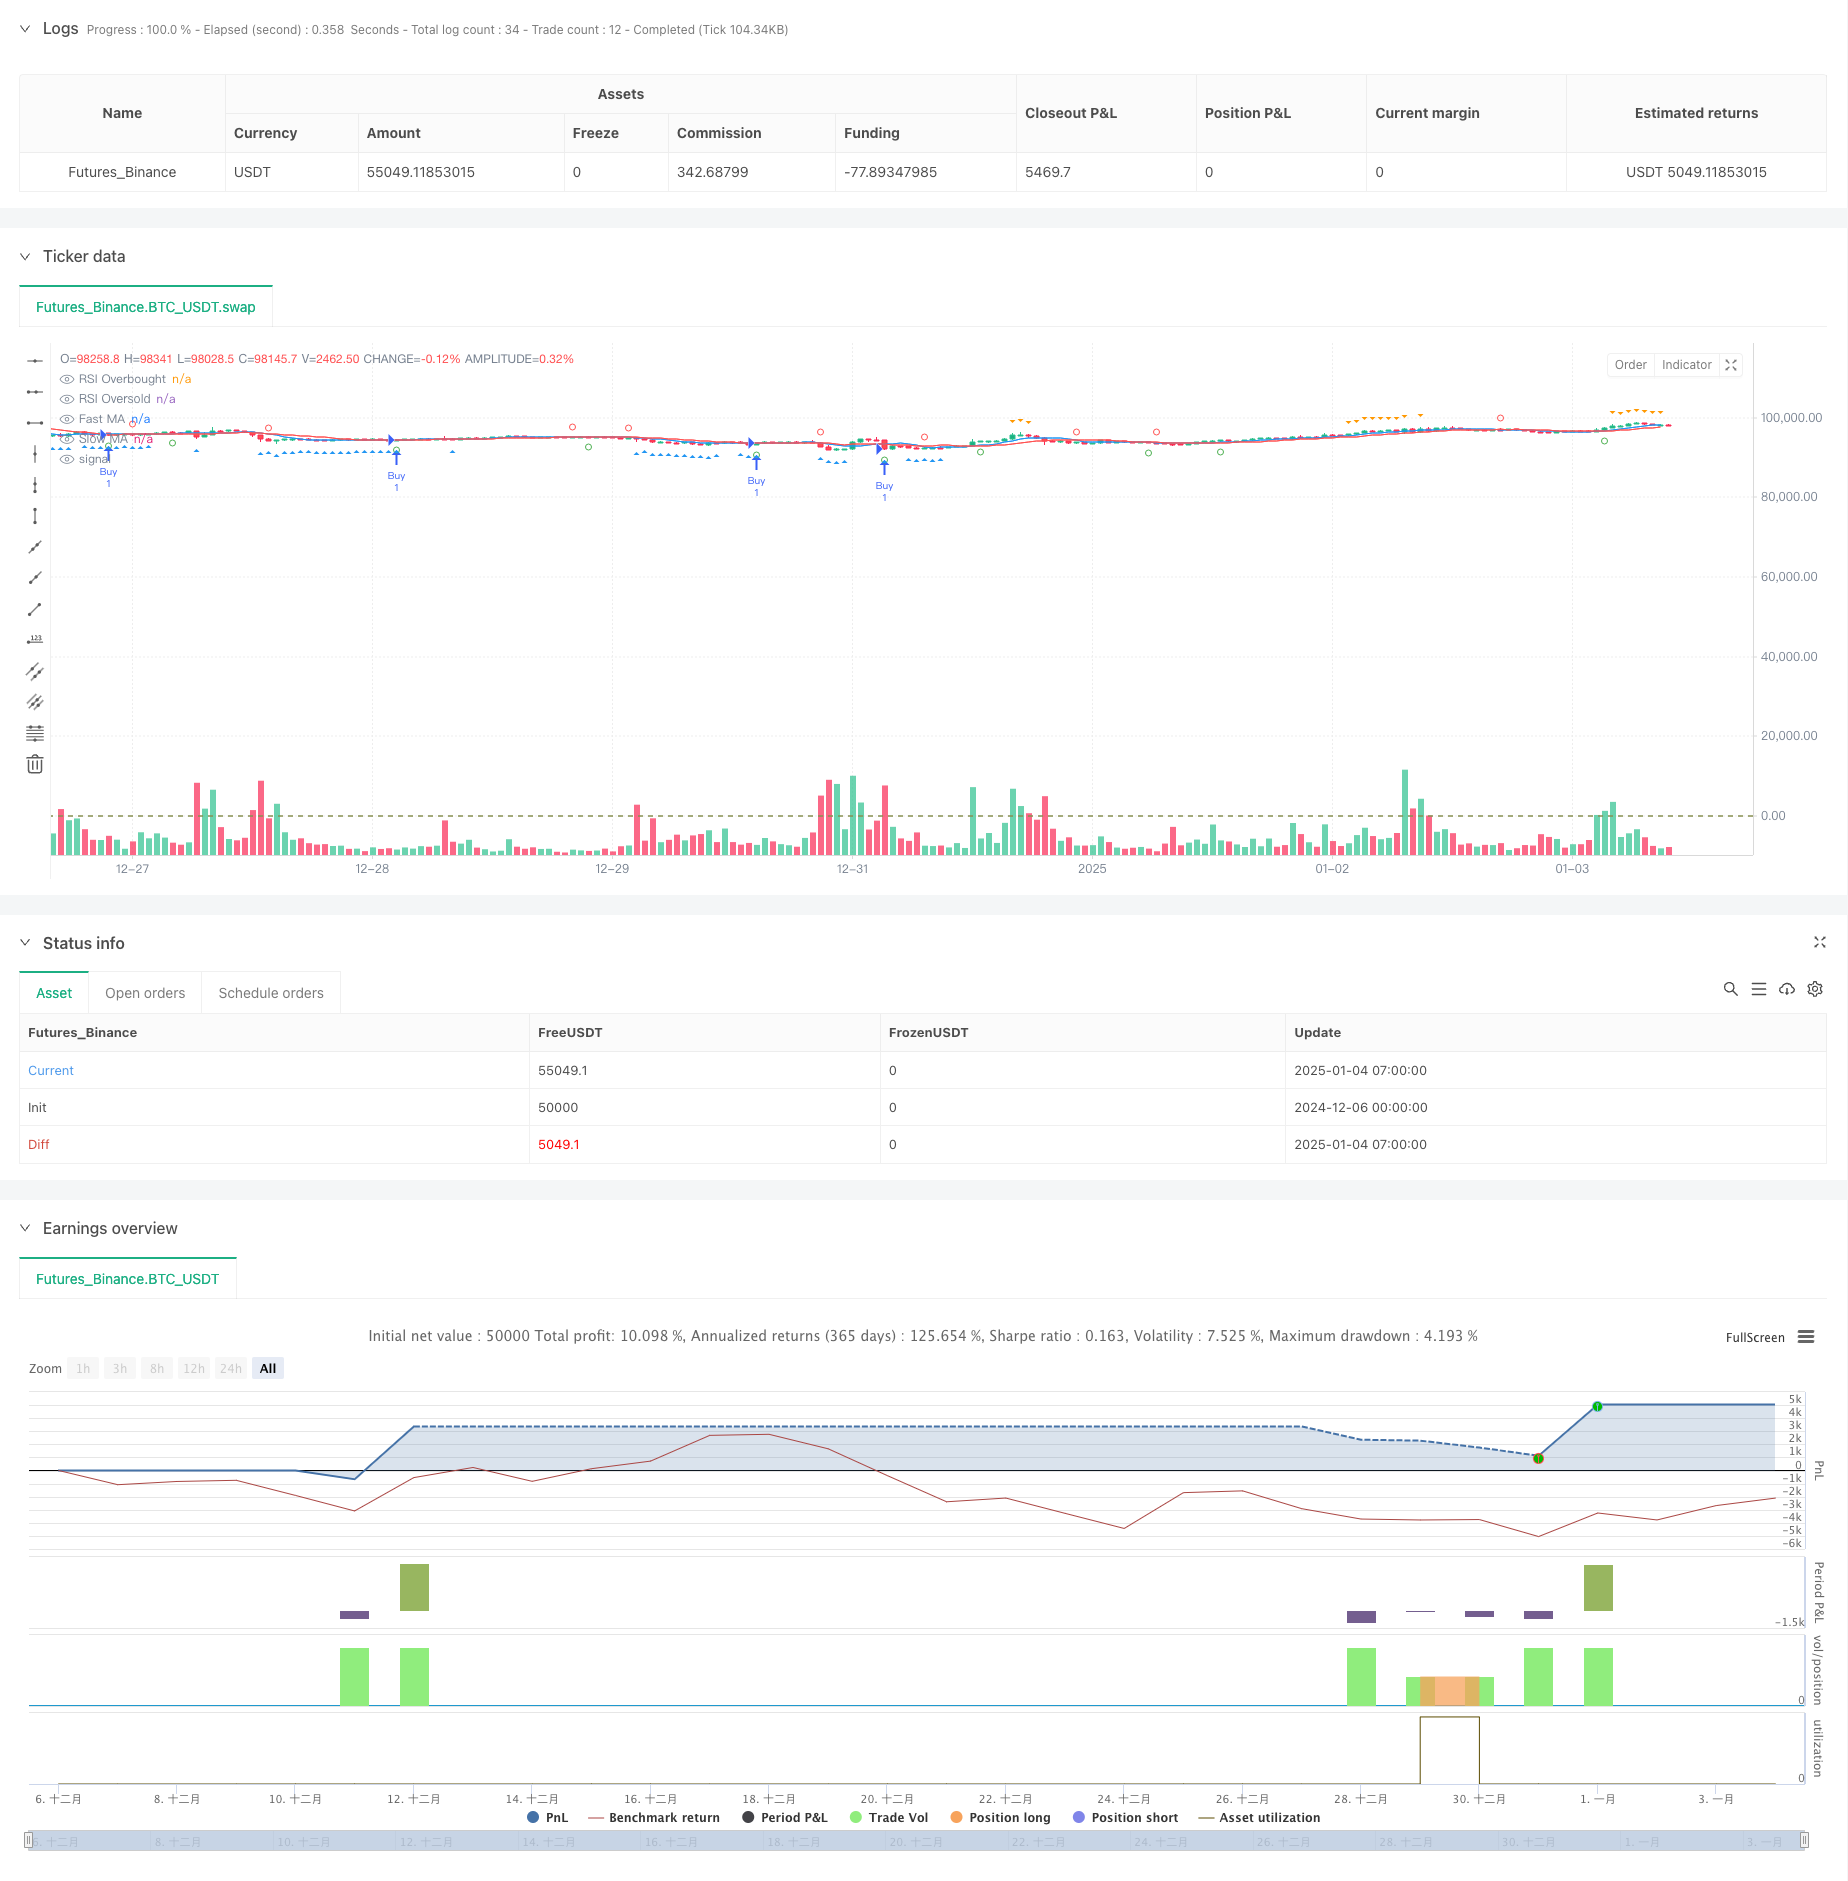
该策略是一个基于移动平均线交叉和RSI指标的量化交易系统,主要用于期权市场的交易。策略采用快速和慢速移动平均线的交叉信号,结合RSI超买超卖水平来确定交易时机,同时设置了止盈止损来控制风险。该策略适用于5分钟时间周期的交易。
策略原理
策略使用了两个关键的技术指标:移动平均线(MA)和相对强弱指标(RSI)。具体来说: 1. 使用7周期和13周期的简单移动平均线(SMA)来捕捉价格趋势 2. 采用17周期的RSI指标来识别超买超卖条件 3. 当快速均线向上穿越慢速均线且RSI低于43时,系统产生做多信号 4. 当快速均线向下穿越慢速均线且RSI高于64时,系统产生做空信号 5. 设置4%的止盈和0.5%的止损来管理风险
策略优势
- 多重确认机制:结合均线交叉和RSI指标,提供更可靠的交易信号
- 风险管理完善:设置了固定百分比的止盈止损,有效控制风险
- 适应性强:参数可根据不同市场条件灵活调整
- 可视化支持:策略提供了清晰的图形指示,便于交易者理解市场状况
- 操作规则明确:入场出场条件明确,减少主观判断带来的干扰
策略风险
- 震荡市场风险:在横盘震荡市场中可能产生频繁的假信号
- 滑点风险:期权市场流动性不足时可能面临较大滑点
- 参数敏感性:策略效果对参数设置较为敏感,需要持续优化
- 市场环境依赖:在剧烈波动的市场环境下,止损可能不够及时
- 系统性风险:当市场出现跳空或重大事件时,止损可能失效
策略优化方向
- 引入波动率指标:考虑将ATR或Bollinger Bands纳入决策系统
- 优化参数自适应:开发基于市场状态的动态参数调整机制
- 增加市场情绪过滤:结合成交量等指标过滤虚假信号
- 完善止损机制:考虑引入追踪止损,提高风险管理效率
- 增加时间过滤:加入交易时间窗口限制,避免低效时段交易
总结
该策略通过结合均线交叉和RSI指标,构建了一个相对完整的交易系统。策略的优势在于多重信号确认和完善的风险管理,但也需要注意市场环境对策略表现的影响。通过持续优化和完善,该策略有望在期权市场中取得稳定表现。建议交易者在实盘使用前进行充分的回测和参数优化。
策略源码
/*backtest
start: 2024-12-06 00:00:00
end: 2025-01-04 08:00:00
period: 1h
basePeriod: 1h
exchanges: [{"eid":"Futures_Binance","currency":"BTC_USDT"}]
*/

//@version=5
strategy("MA Crossover with RSI Debugging", overlay=true)

// Inputs
fastLength = input.int(7, title="Fast MA Length", minval=1)
slowLength = input.int(13, title="Slow MA Length", minval=1)
rsiLength = input.int(17, title="RSI Length", minval=1)
rsiOverbought = input.int(64, title="RSI Overbought Level", minval=50, maxval=100)
rsiOversold = input.int(43, title="RSI Oversold Level", minval=0, maxval=50)
takeProfitPerc = input.float(4, title="Take Profit (%)", minval=0.1)
stopLossPerc = input.float(0.5, title="Stop Loss (%)", minval=0.1)

// Moving Averages
fastMA = ta.sma(close, fastLength)
slowMA = ta.sma(close, slowLength)

// RSI
rsi = ta.rsi(close, rsiLength)

// Entry Conditions
longCondition = ta.crossover(fastMA, slowMA) and rsi < rsiOversold
shortCondition = ta.crossunder(fastMA, slowMA) and rsi > rsiOverbought

// Plot Debugging Shapes
plotshape(ta.crossover(fastMA, slowMA), color=color.green, style=shape.circle, location=location.belowbar, title="Fast MA Crossover")
plotshape(ta.crossunder(fastMA, slowMA), color=color.red, style=shape.circle, location=location.abovebar, title="Fast MA Crossunder")

plotshape(rsi < rsiOversold, color=color.blue, style=shape.triangleup, location=location.belowbar, title="RSI Oversold")
plotshape(rsi > rsiOverbought, color=color.orange, style=shape.triangledown, location=location.abovebar, title="RSI Overbought")

// Entry and Exit Execution
if (longCondition)
    strategy.entry("Buy", strategy.long)

if (shortCondition)
    strategy.entry("Sell", strategy.short)

takeProfitPrice = strategy.position_avg_price * (1 + takeProfitPerc / 100)
stopLossPrice = strategy.position_avg_price * (1 - stopLossPerc / 100)

if (strategy.position_size > 0)
    strategy.exit("Exit Buy", from_entry="Buy", limit=takeProfitPrice, stop=stopLossPrice)

if (strategy.position_size < 0)
    strategy.exit("Exit Sell", from_entry="Sell", limit=takeProfitPrice, stop=stopLossPrice)

// Plot Moving Averages
plot(fastMA, color=color.blue, title="Fast MA")
plot(slowMA, color=color.red, title="Slow MA")

// RSI Levels
hline(rsiOverbought, "RSI Overbought", color=color.red)
hline(rsiOversold, "RSI Oversold", color=color.green)
相关推荐