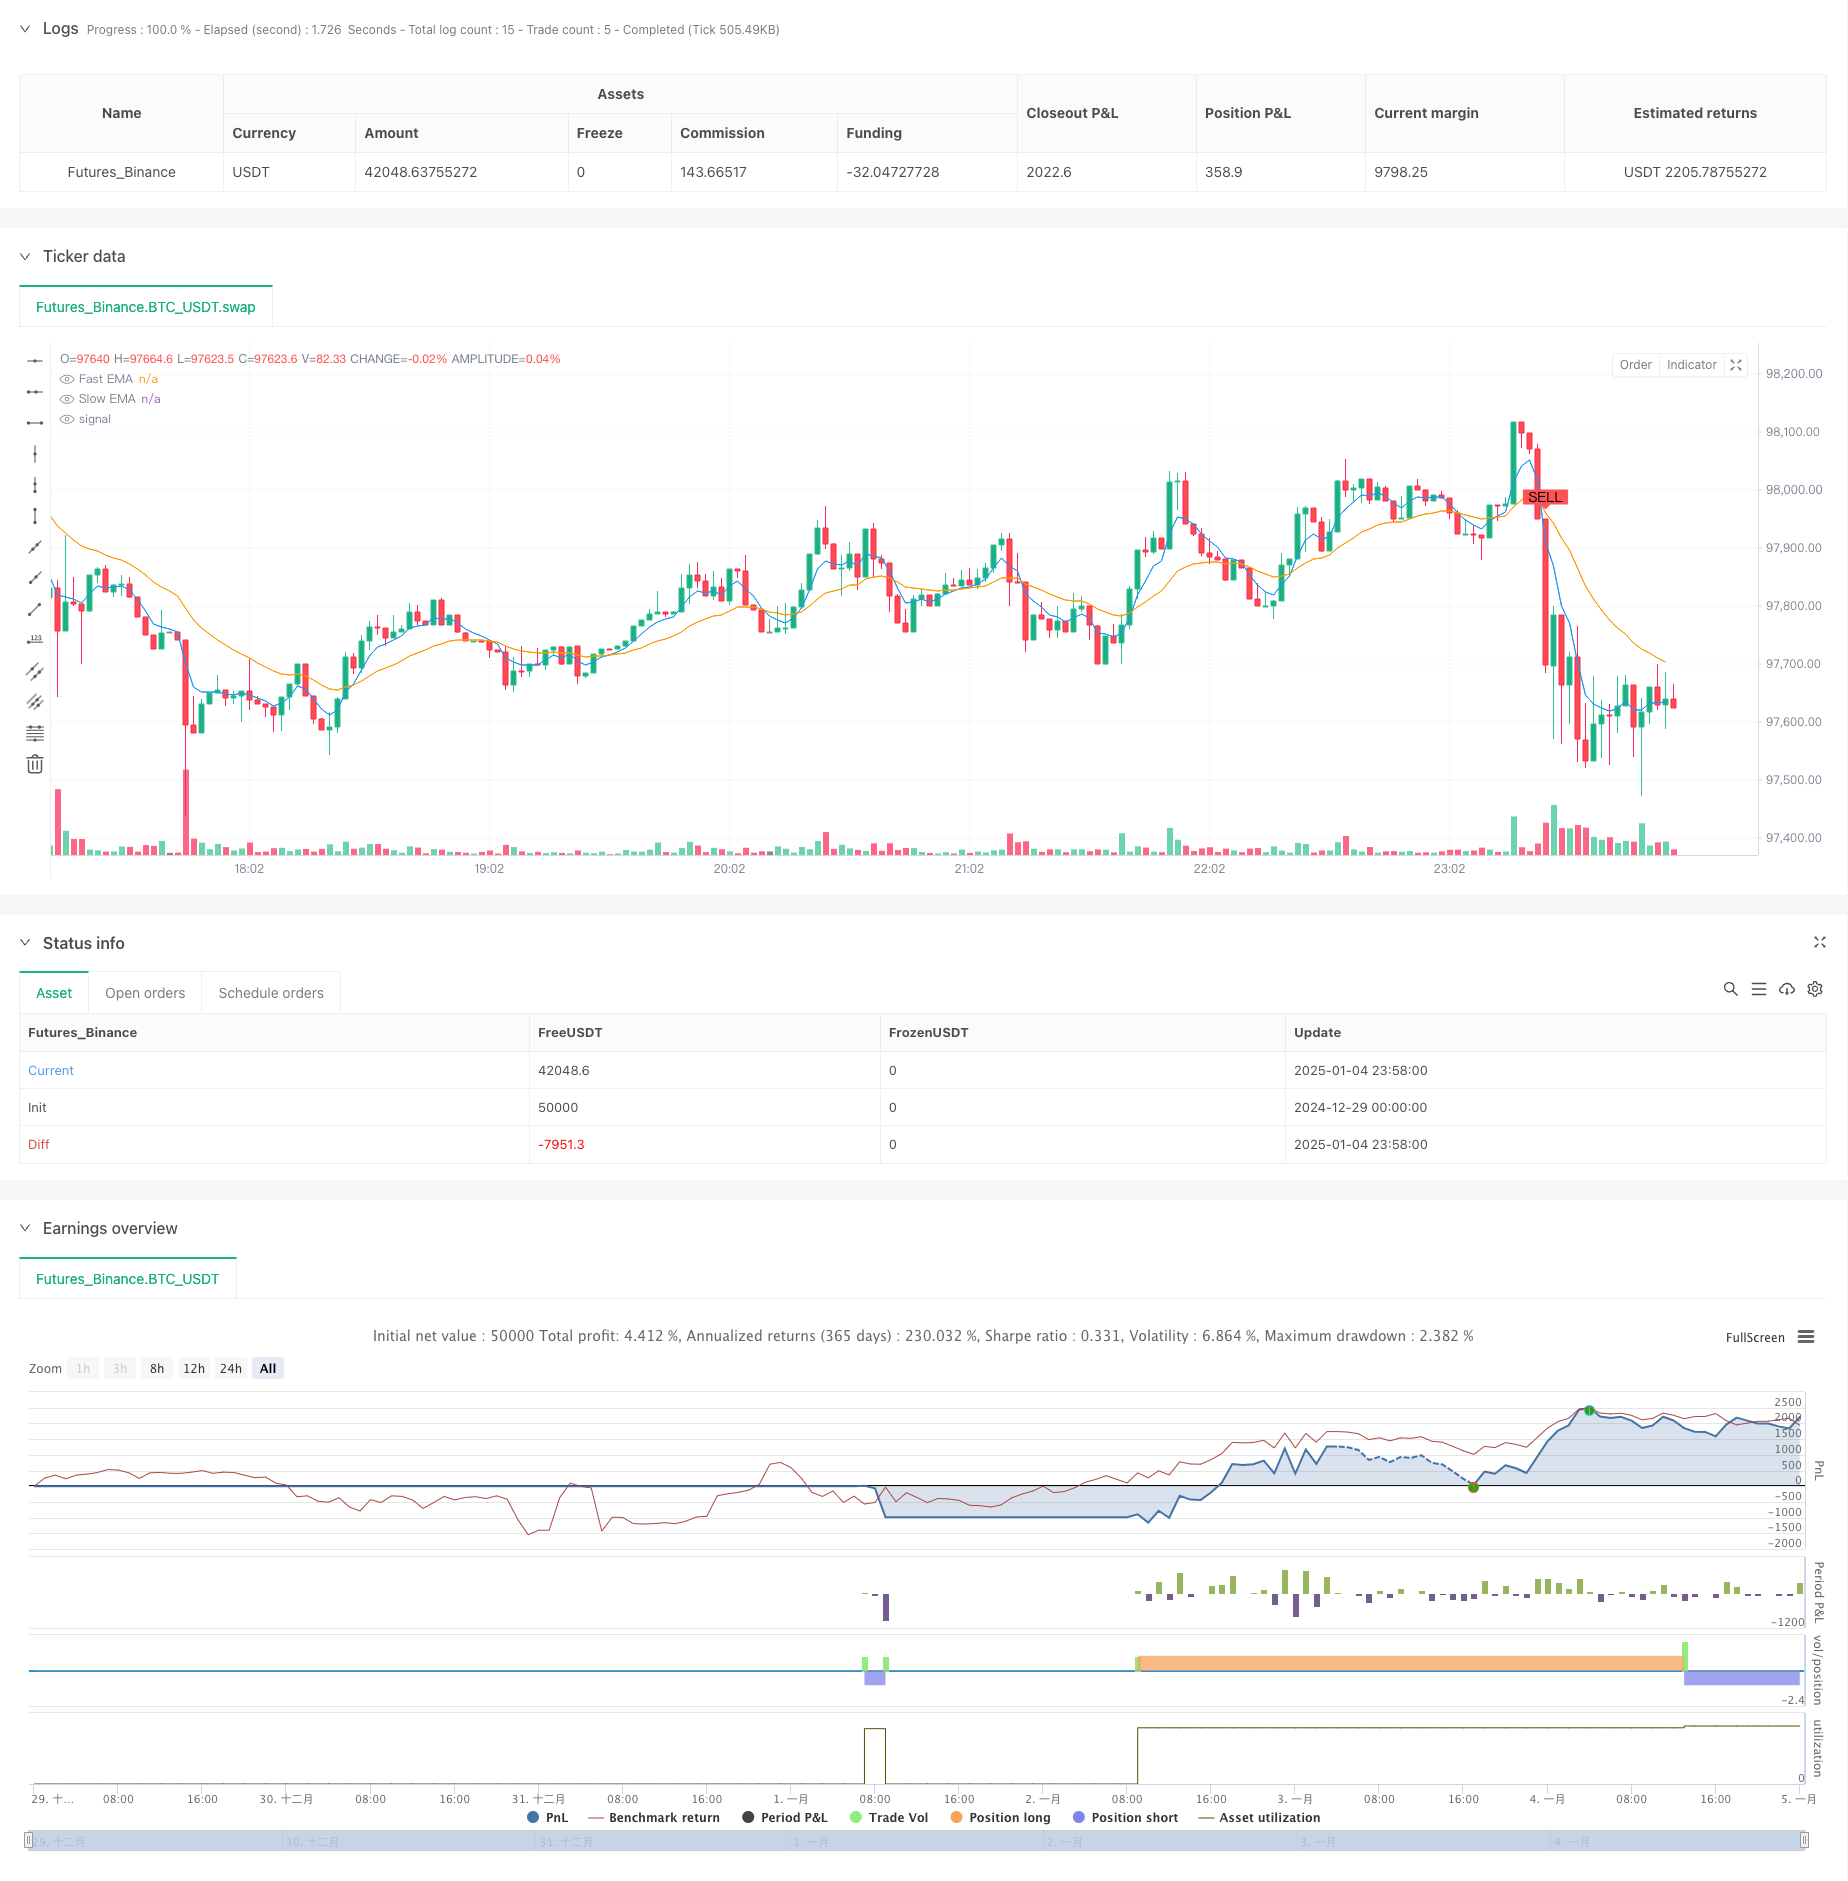
概述
该策略是一个结合了均线交叉信号和动态风险管理的趋势跟踪交易系统。它使用快速和慢速指数移动平均线(EMA)来识别市场趋势,并结合平均真实波幅(ATR)指标来优化入场时机。同时,策略集成了百分比止损、目标获利以及追踪止损三重保护机制。
策略原理
策略的核心逻辑基于以下几个关键要素: 1. 使用5周期和20周期的EMA交叉来确定趋势方向 2. 通过ATR倍数过滤来增强交易信号的可靠性 3. 在EMA交叉发生且价格突破ATR通道时触发交易信号 4. 建仓后立即设置1%的固定止损和5%的获利目标 5. 使用基于ATR的追踪止损来保护盈利 6. 多空双向交易,充分把握市场机会
策略优势
- 信号系统结合了趋势和波动率指标,提高了交易的准确性
- 动态的ATR通道可以适应不同市场环境下的波动特征
- 三重风险控制机制为交易提供了全方位的保护
- 参数可调节性强,便于根据不同市场特征优化
- 系统自动化程度高,减少了人为干预带来的情绪影响
策略风险
- EMA交叉可能产生滞后性,在剧烈波动市场中可能错过最佳入场点
- 固定百分比的止损可能在高波动期不够灵活
- 频繁交易可能带来较高的手续费成本
- 在区间震荡市场中可能产生频繁的假信号
- 追踪止损可能在快速回撤中提前出场
策略优化方向
- 引入成交量指标来验证趋势的有效性
- 加入市场环境识别机制,在不同市场状态下使用不同的参数
- 优化ATR倍数,建立自适应的动态参数体系
- 结合更多的技术指标来过滤假信号
- 开发更灵活的资金管理方案
总结
这是一个设计合理、逻辑清晰的趋势跟踪策略。通过均线交叉捕捉趋势,利用ATR控制风险,配合多重止损机制,形成了一个完整的交易系统。策略的主要优势在于其全面的风险控制和高度的可定制性,但在实盘交易中需要注意假信号和交易成本的问题。通过建议的优化方向,策略还有进一步提升的空间。
策略源码
/*backtest
start: 2024-12-29 00:00:00
end: 2025-01-05 00:00:00
period: 2m
basePeriod: 2m
exchanges: [{"eid":"Futures_Binance","currency":"BTC_USDT"}]
*/

// This Pine Script™ code is subject to the terms of the Mozilla Public License 2.0 at https://mozilla.org/MPL/2.0/
// © jesusperezguitarra89

//@version=6
strategy("High Profit Buy/Sell Signals", overlay=true)

// Parámetros ajustables
fastLength = input.int(5, title="Fast EMA Length")
slowLength = input.int(20, title="Slow EMA Length")
atrLength = input.int(10, title="ATR Length")
atrMultiplier = input.float(2.5, title="ATR Multiplier")
stopLossPercent = input.float(1.0, title="Stop Loss %")
takeProfitPercent = input.float(5.0, title="Take Profit %")
trailingStop = input.float(2.0, title="Trailing Stop %")

// Cálculo de EMAs
fastEMA = ta.ema(close, fastLength)
slowEMA = ta.ema(close, slowLength)

// Cálculo del ATR
atr = ta.atr(atrLength)

// Señales de compra y venta
longCondition = ta.crossover(fastEMA, slowEMA) and close > slowEMA + atrMultiplier * atr
shortCondition = ta.crossunder(fastEMA, slowEMA) and close < slowEMA - atrMultiplier * atr

// Dibujar señales en el gráfico
plotshape(series=longCondition, location=location.belowbar, color=color.green, style=shape.labelup, text="BUY")
plotshape(series=shortCondition, location=location.abovebar, color=color.red, style=shape.labeldown, text="SELL")

// Estrategia de backtesting para marcos de tiempo en minutos
if longCondition
    strategy.entry("Buy", strategy.long)
    strategy.exit("Take Profit", from_entry="Buy", limit=close * (1 + takeProfitPercent / 100), stop=close * (1 - stopLossPercent / 100), trail_points=atr * trailingStop)
if shortCondition
    strategy.entry("Sell", strategy.short)
    strategy.exit("Take Profit", from_entry="Sell", limit=close * (1 - takeProfitPercent / 100), stop=close * (1 + stopLossPercent / 100), trail_points=atr * trailingStop)

// Mostrar EMAs
plot(fastEMA, color=color.blue, title="Fast EMA")
plot(slowEMA, color=color.orange, title="Slow EMA")
相关推荐