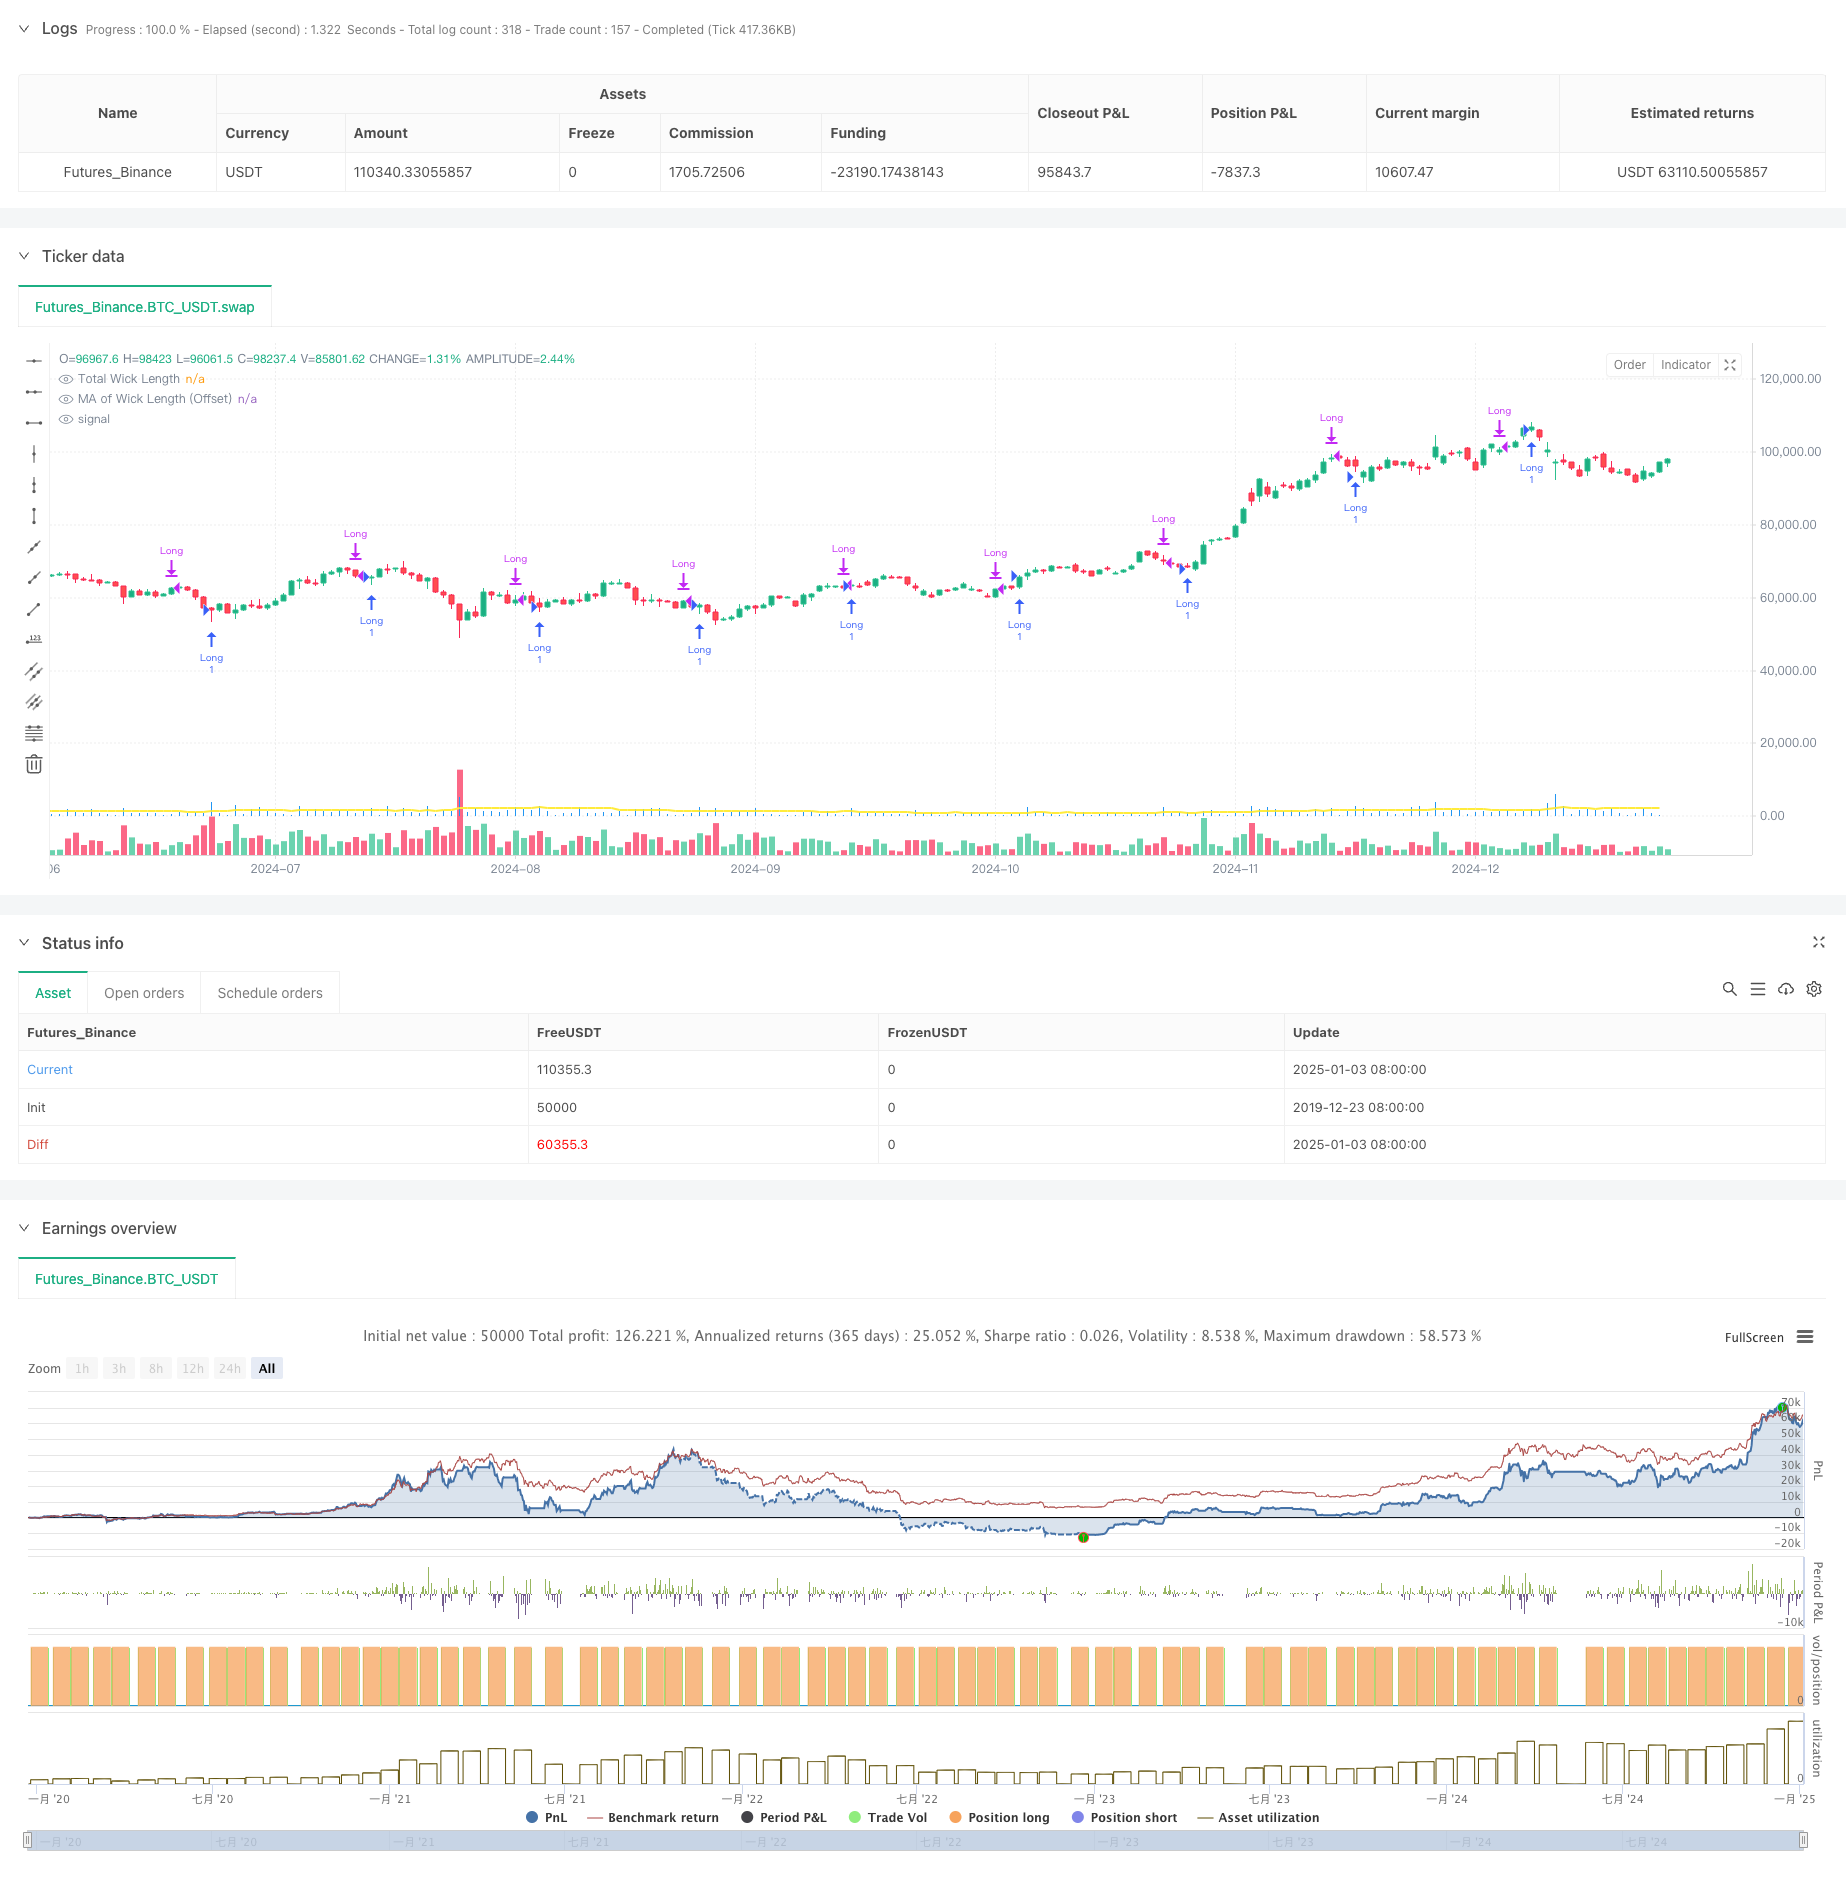
概述
该策略是一个基于蜡烛图技术分析的量化交易系统,主要通过分析蜡烛线上下影线的总长度来识别潜在的交易机会。策略核心是将实时计算的影线总长度与经过偏移调整的移动平均线进行比较,当影线长度突破移动平均线时产生做多信号。该策略集成了多种移动平均线类型,包括简单移动平均线(SMA)、指数移动平均线(EMA)、加权移动平均线(WMA)和成交量加权移动平均线(VWMA),为交易者提供了灵活的参数选择空间。
策略原理
策略的核心逻辑包含以下几个关键步骤: 1. 计算每根蜡烛线的上下影线长度:上影线为最高价与收盘价和开盘价的较大值之差,下影线为收盘价和开盘价的较小值与最低价之差 2. 计算影线总长度:将上下影线长度相加得到总长度 3. 根据用户选择的移动平均线类型(SMA/EMA/WMA/VWMA)计算影线长度的移动平均值 4. 在移动平均线基础上添加用户自定义的偏移量 5. 当实时影线总长度突破偏移后的移动平均线时,触发做多信号 6. 持仓时间达到预设周期后自动平仓
策略优势
- 技术指标选择合理:影线长度能够有效反映市场波动性和价格运动强度,是判断趋势转折的重要指标
- 参数设置灵活:提供多种移动平均线选择和自定义参数,适应不同市场环境
- 风险控制完善:采用固定持仓周期,避免过度持仓带来的风险
- 可视化效果突出:使用直方图显示影线长度,线图显示移动平均线,直观展示交易信号
- 计算逻辑清晰:代码结构简洁,易于理解和维护
策略风险
- 市场环境依赖:在低波动率环境下,影线长度信号可能不够明显,影响策略效果
- 参数敏感性:移动平均线周期、偏移量等参数的选择对策略表现影响较大
- 假突破风险:可能出现影线长度短期突破但快速回落的情况,导致错误信号
- 固定持仓周期的局限性:未能根据市场情况动态调整持仓时间,可能错过更大收益
- 单一方向交易:仅支持做多交易,在下跌行情中无法获利
策略优化方向
- 引入波动率过滤:结合ATR或历史波动率指标,在合适的波动环境下开启交易
- 增加趋势过滤条件:结合长期移动平均线或趋势指标,在主趋势方向上交易
- 优化持仓管理:引入动态止盈止损机制,根据市场波动性调整持仓时间
- 添加做空功能:在合适条件下增加做空交易,提高策略收益来源
- 增强信号过滤:考虑成交量、市场情绪等多维度指标,提高信号质量
总结
该策略通过分析蜡烛线影线长度这一经典技术指标,结合现代量化交易方法,构建了一个逻辑清晰、实用性强的交易系统。策略的核心优势在于其参数灵活性和风险控制的完整性,但同时也存在对市场环境依赖性强、参数敏感等局限。通过引入多维度指标和优化持仓管理,策略仍有较大的提升空间。整体而言,这是一个基础扎实、逻辑合理的量化交易策略,适合进一步开发和优化。
策略源码
/*backtest
start: 2019-12-23 08:00:00
end: 2025-01-04 08:00:00
period: 1d
basePeriod: 1d
exchanges: [{"eid":"Futures_Binance","currency":"BTC_USDT"}]
*/

//@version=6
strategy("Daytrading ES Wick Length Strategy", overlay=true)

// Input parameters
ma_length = input.int(20, title="Moving Average Length", minval=1)
ma_type = input.string("VWMA", title="Type of Moving Average", options=["SMA", "EMA", "WMA", "VWMA"])
ma_offset = input.float(10, title="MA Offset (Points)", step=1)
hold_periods = input.int(18, title="Holding Period (Bars)", minval=1)

// Calculating upper and lower wick lengths
upper_wick_length = high - math.max(close, open)
lower_wick_length = math.min(close, open) - low

// Total wick length (upper + lower)
total_wick_length = upper_wick_length + lower_wick_length

// Calculate the moving average based on the selected method
ma = switch ma_type
    "SMA" => ta.sma(total_wick_length, ma_length)
    "EMA" => ta.ema(total_wick_length, ma_length)
    "WMA" => ta.wma(total_wick_length, ma_length)
    "VWMA" => ta.vwma(total_wick_length, ma_length)

// Add the offset to the moving average
ma_with_offset = ma + ma_offset

// Entry condition: wick length exceeds MA with offset
long_entry_condition = total_wick_length > ma_with_offset

// Long entry
if (long_entry_condition)
    strategy.entry("Long", strategy.long)

// Automatic exit after holding period
if strategy.position_size > 0 and bar_index - strategy.opentrades.entry_bar_index(strategy.opentrades - 1) >= hold_periods
    strategy.close("Long")

// Plot the total wick length as a histogram
plot(total_wick_length, color=color.blue, style=plot.style_histogram, linewidth=2, title="Total Wick Length")

// Plot the moving average with offset
plot(ma_with_offset, color=color.yellow, linewidth=2, title="MA of Wick Length (Offset)")
相关推荐