概述
本策略是一个基于MACD(移动平均线趋同散度)指标的高级交易系统,通过将MACD信号与动态风险管理相结合,实现了一个全面的交易解决方案。该策略不仅关注MACD线与信号线的交叉,还结合了直方图确认,并通过灵活的止损和获利设置来优化交易效果。策略提供了全方位的参数化配置,使其能够适应不同的市场环境和交易需求。
策略原理
策略的核心逻辑建立在三个主要支柱上: 1. 信号生成系统通过监测MACD线与信号线的交叉,并使用MACD直方图作为趋势确认指标。当MACD线向上穿越信号线且直方图为正时,系统产生做多信号;当MACD线向下穿越信号线且直方图为负时,系统产生做空信号。 2. 风险管理机制采用动态止损设置,通过计算过去特定数量K线的最高价和最低价来确定止损位置,为每笔交易提供动态的风险控制。 3. 获利目标采用基于风险比率的计算方法,通过设定风险收益比来自动确定获利目标位置,确保每笔交易的风险收益比例保持一致。
策略优势
- 信号确认机制完善:通过结合MACD交叉和直方图确认,显著提高了信号的可靠性
- 风险管理灵活:动态止损设置能够根据市场波动情况自动调整,提供了更好的风险保护
- 参数化配置全面:交易方向、MACD参数、止损周期、风险收益比等都可以根据需求调整
- 适应性强:策略可以应用于任何时间框架,适合不同的交易品种
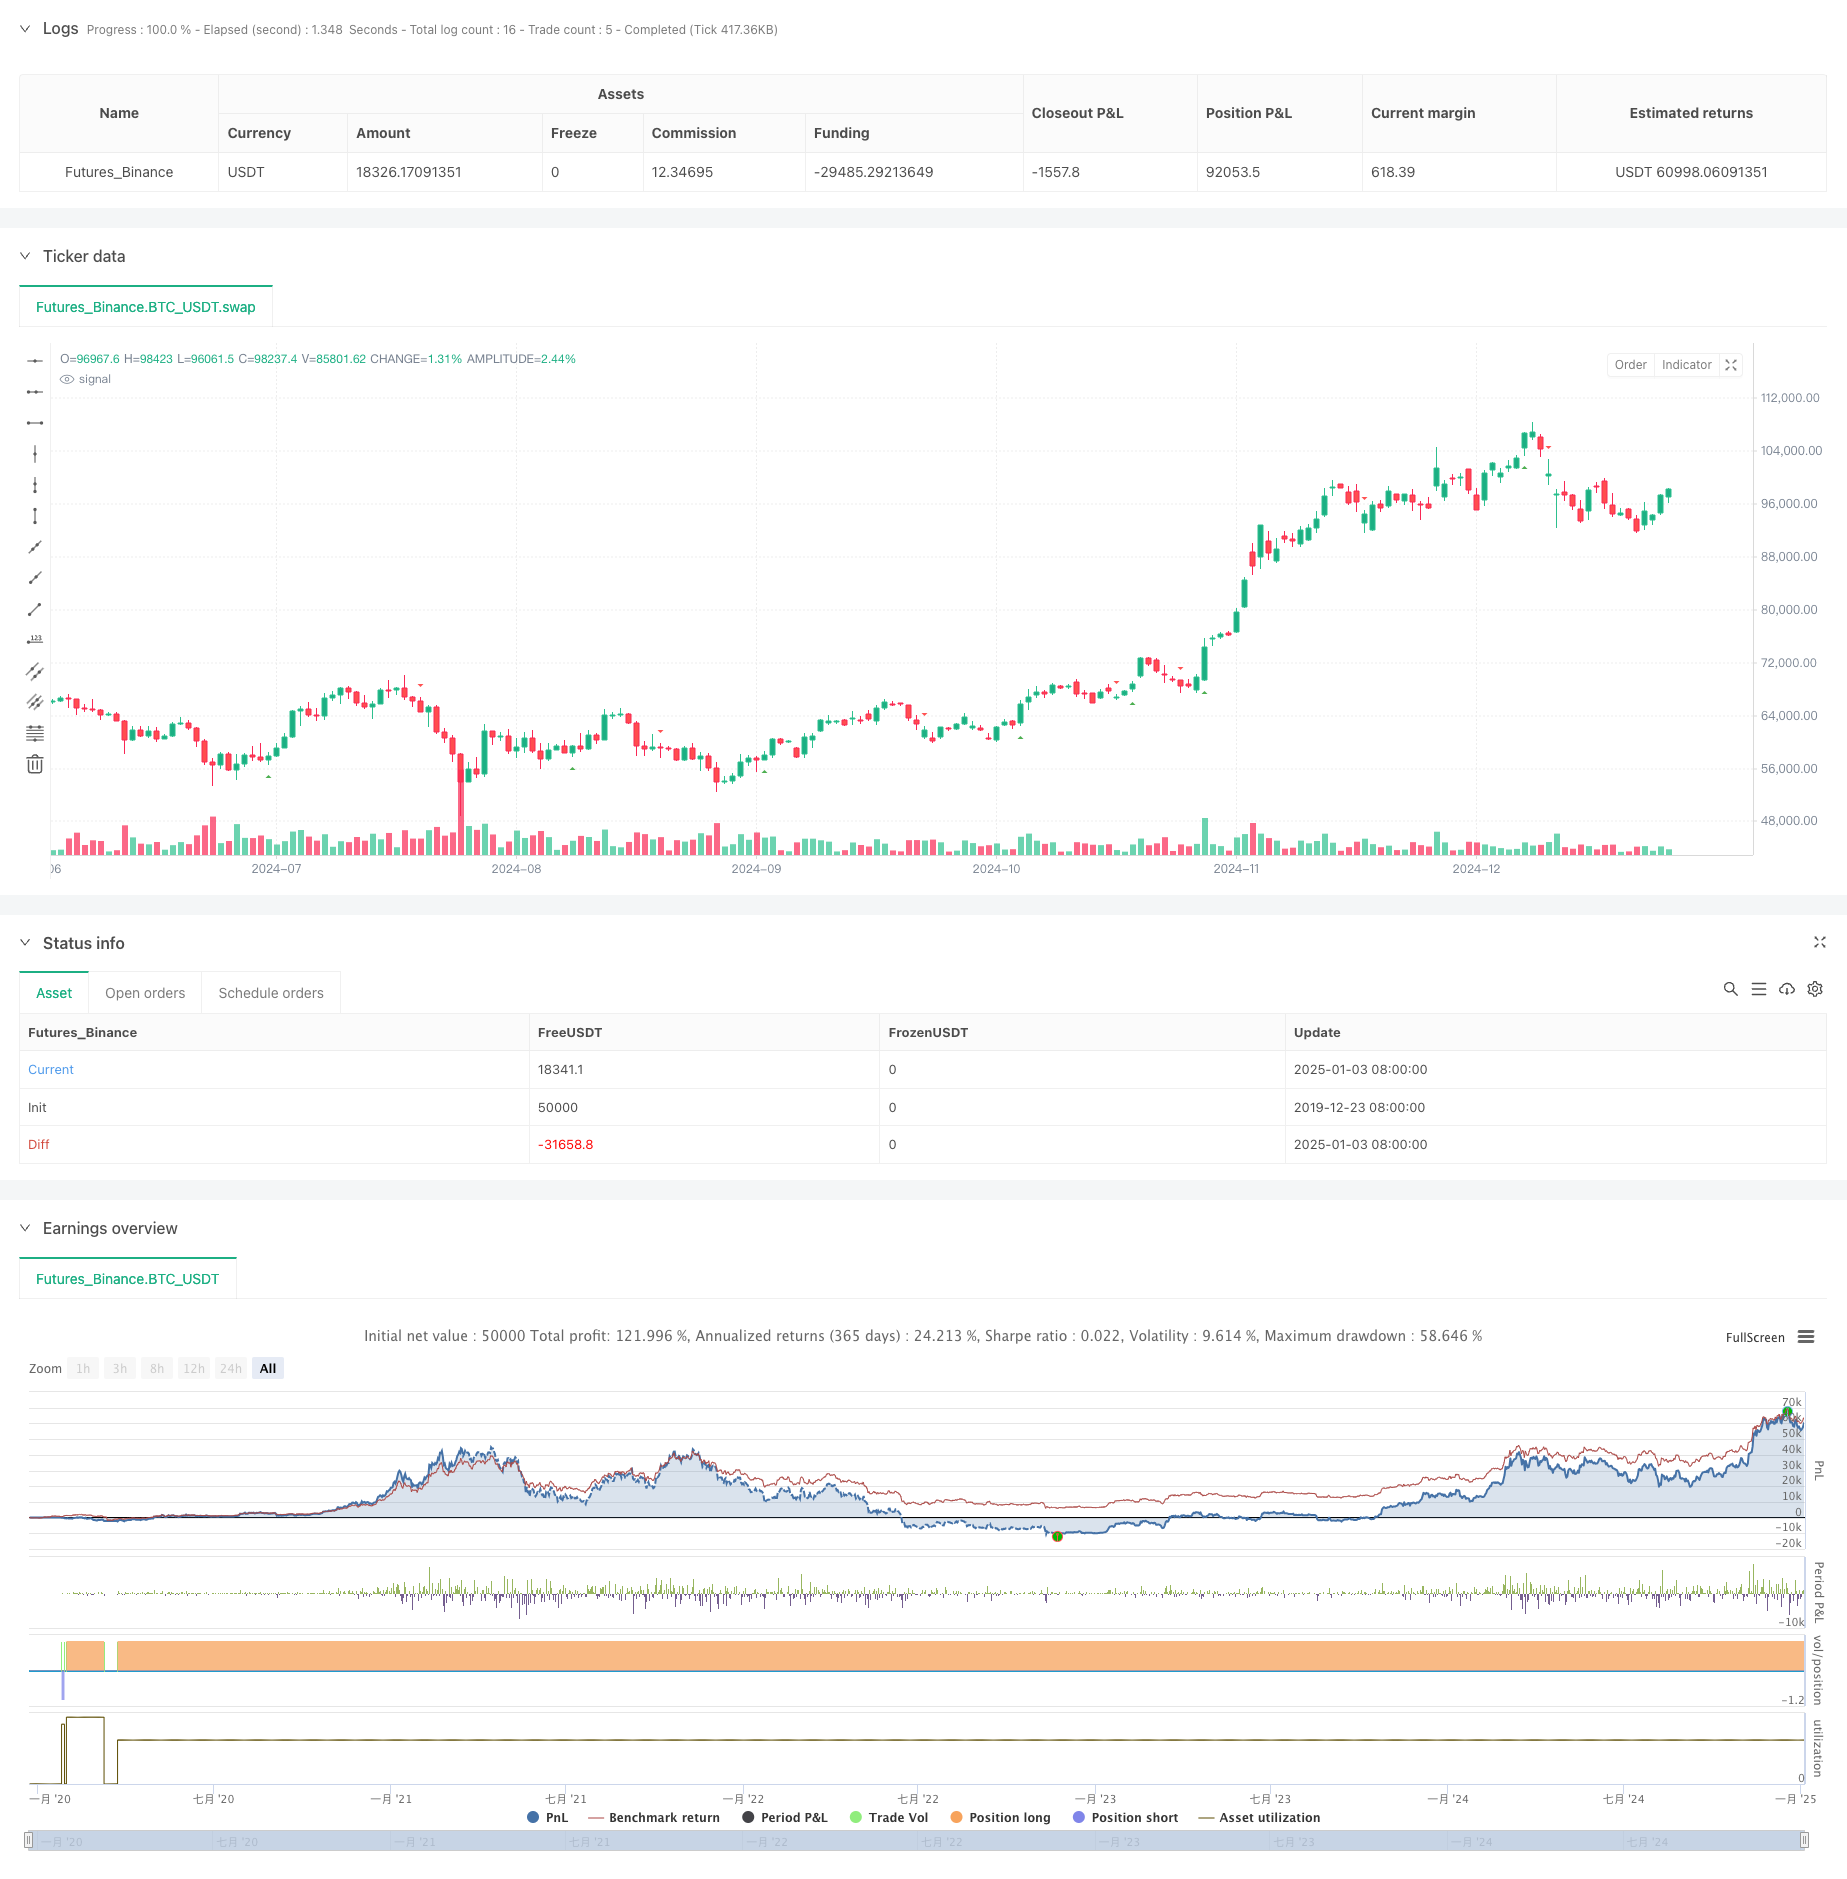
- 可视化效果清晰:系统提供了交易信号的图形化显示,便于分析和优化
策略风险
- 市场波动风险:在剧烈波动市场中,MACD信号可能产生滞后,导致入场时机不理想
- 假突破风险:市场横盘整理时期可能产生虚假的MACD交叉信号
- 止损设置风险:过短的止损周期可能导致过于频繁的止损,过长则可能承受过大损失
- 参数优化风险:过度优化参数可能导致策略在实盘中的表现与回测结果产生较大偏差
策略优化方向
- 信号过滤:加入成交量指标或其他技术指标作为辅助确认,提高信号质量
- 动态参数:根据市场波动率自动调整MACD参数和止损设置,提高策略适应性
- 风险管理:引入仓位管理机制,根据账户净值和市场波动调整交易规模
- 时间过滤:增加交易时间窗口设置,避免在不利的市场时段进行交易
- 回撤控制:添加最大回撤控制机制,在达到特定回撤水平时暂停交易
总结
该策略通过将经典的MACD指标与现代风险管理方法相结合,创造了一个稳健的交易系统。其优势在于信号确认机制完善、风险管理灵活、参数可调节性强,适合不同市场环境。通过建议的优化方向,策略还有进一步提升的空间。但使用者需要注意控制风险,避免过度优化,并根据实际交易环境进行适当调整。
策略源码
/*backtest
start: 2019-12-23 08:00:00
end: 2025-01-04 08:00:00
period: 1d
basePeriod: 1d
exchanges: [{"eid":"Futures_Binance","currency":"BTC_USDT"}]
*/

//@version=5
strategy("Estrategia MACD", overlay=true)

// Parámetros entrada
direccion = input.string("ambas", "Dirección de operaciones", options=["larga", "corta", "ambas"])
velas_sl = input.int(3, "Velas para calcular Stop Loss", minval=1)
ratio = input.float(1.5, "Ratio Beneficio:Riesgo", minval=0.5)
rapida = input.int(12, "Periodo Media Rápida")
lenta = input.int(26, "Periodo Media Lenta")
senal = input.int(9, "Periodo Señal")

// Calcular MACD
[macdLinea, senalLinea, histograma] = ta.macd(close, rapida, lenta, senal)

// Señales
senal_larga = ta.crossover(macdLinea, senalLinea) and histograma > 0
senal_corta = ta.crossunder(macdLinea, senalLinea) and histograma < 0

// Gestión de riesgo
calcular_sl_largo() => ta.lowest(low, velas_sl)
calcular_sl_corto() => ta.highest(high, velas_sl)

calcular_tp(entrada, sl, es_larga) =>
    distancia = math.abs(entrada - sl)
    es_larga ? entrada + (distancia * ratio) : entrada - (distancia * ratio)

// Operaciones
sl_largo = calcular_sl_largo()
sl_corto = calcular_sl_corto()

if (direccion != "corta" and senal_larga and strategy.position_size == 0)
    entrada = close
    tp = calcular_tp(entrada, sl_largo, true)
    strategy.entry("Larga", strategy.long)
    strategy.exit("Salida Larga", "Larga", stop=sl_largo, limit=tp)

if (direccion != "larga" and senal_corta and strategy.position_size == 0)
    entrada = close
    tp = calcular_tp(entrada, sl_corto, false)
    strategy.entry("Corta", strategy.short)
    strategy.exit("Salida Corta", "Corta", stop=sl_corto, limit=tp)

// Visualización
plotshape(senal_larga and direccion != "corta", "Compra", location=location.belowbar, color=color.green, style=shape.triangleup, size=size.normal)
plotshape(senal_corta and direccion != "larga", "Venta", location=location.abovebar, color=color.red, style=shape.triangledown, size=size.normal)
相关推荐