概述
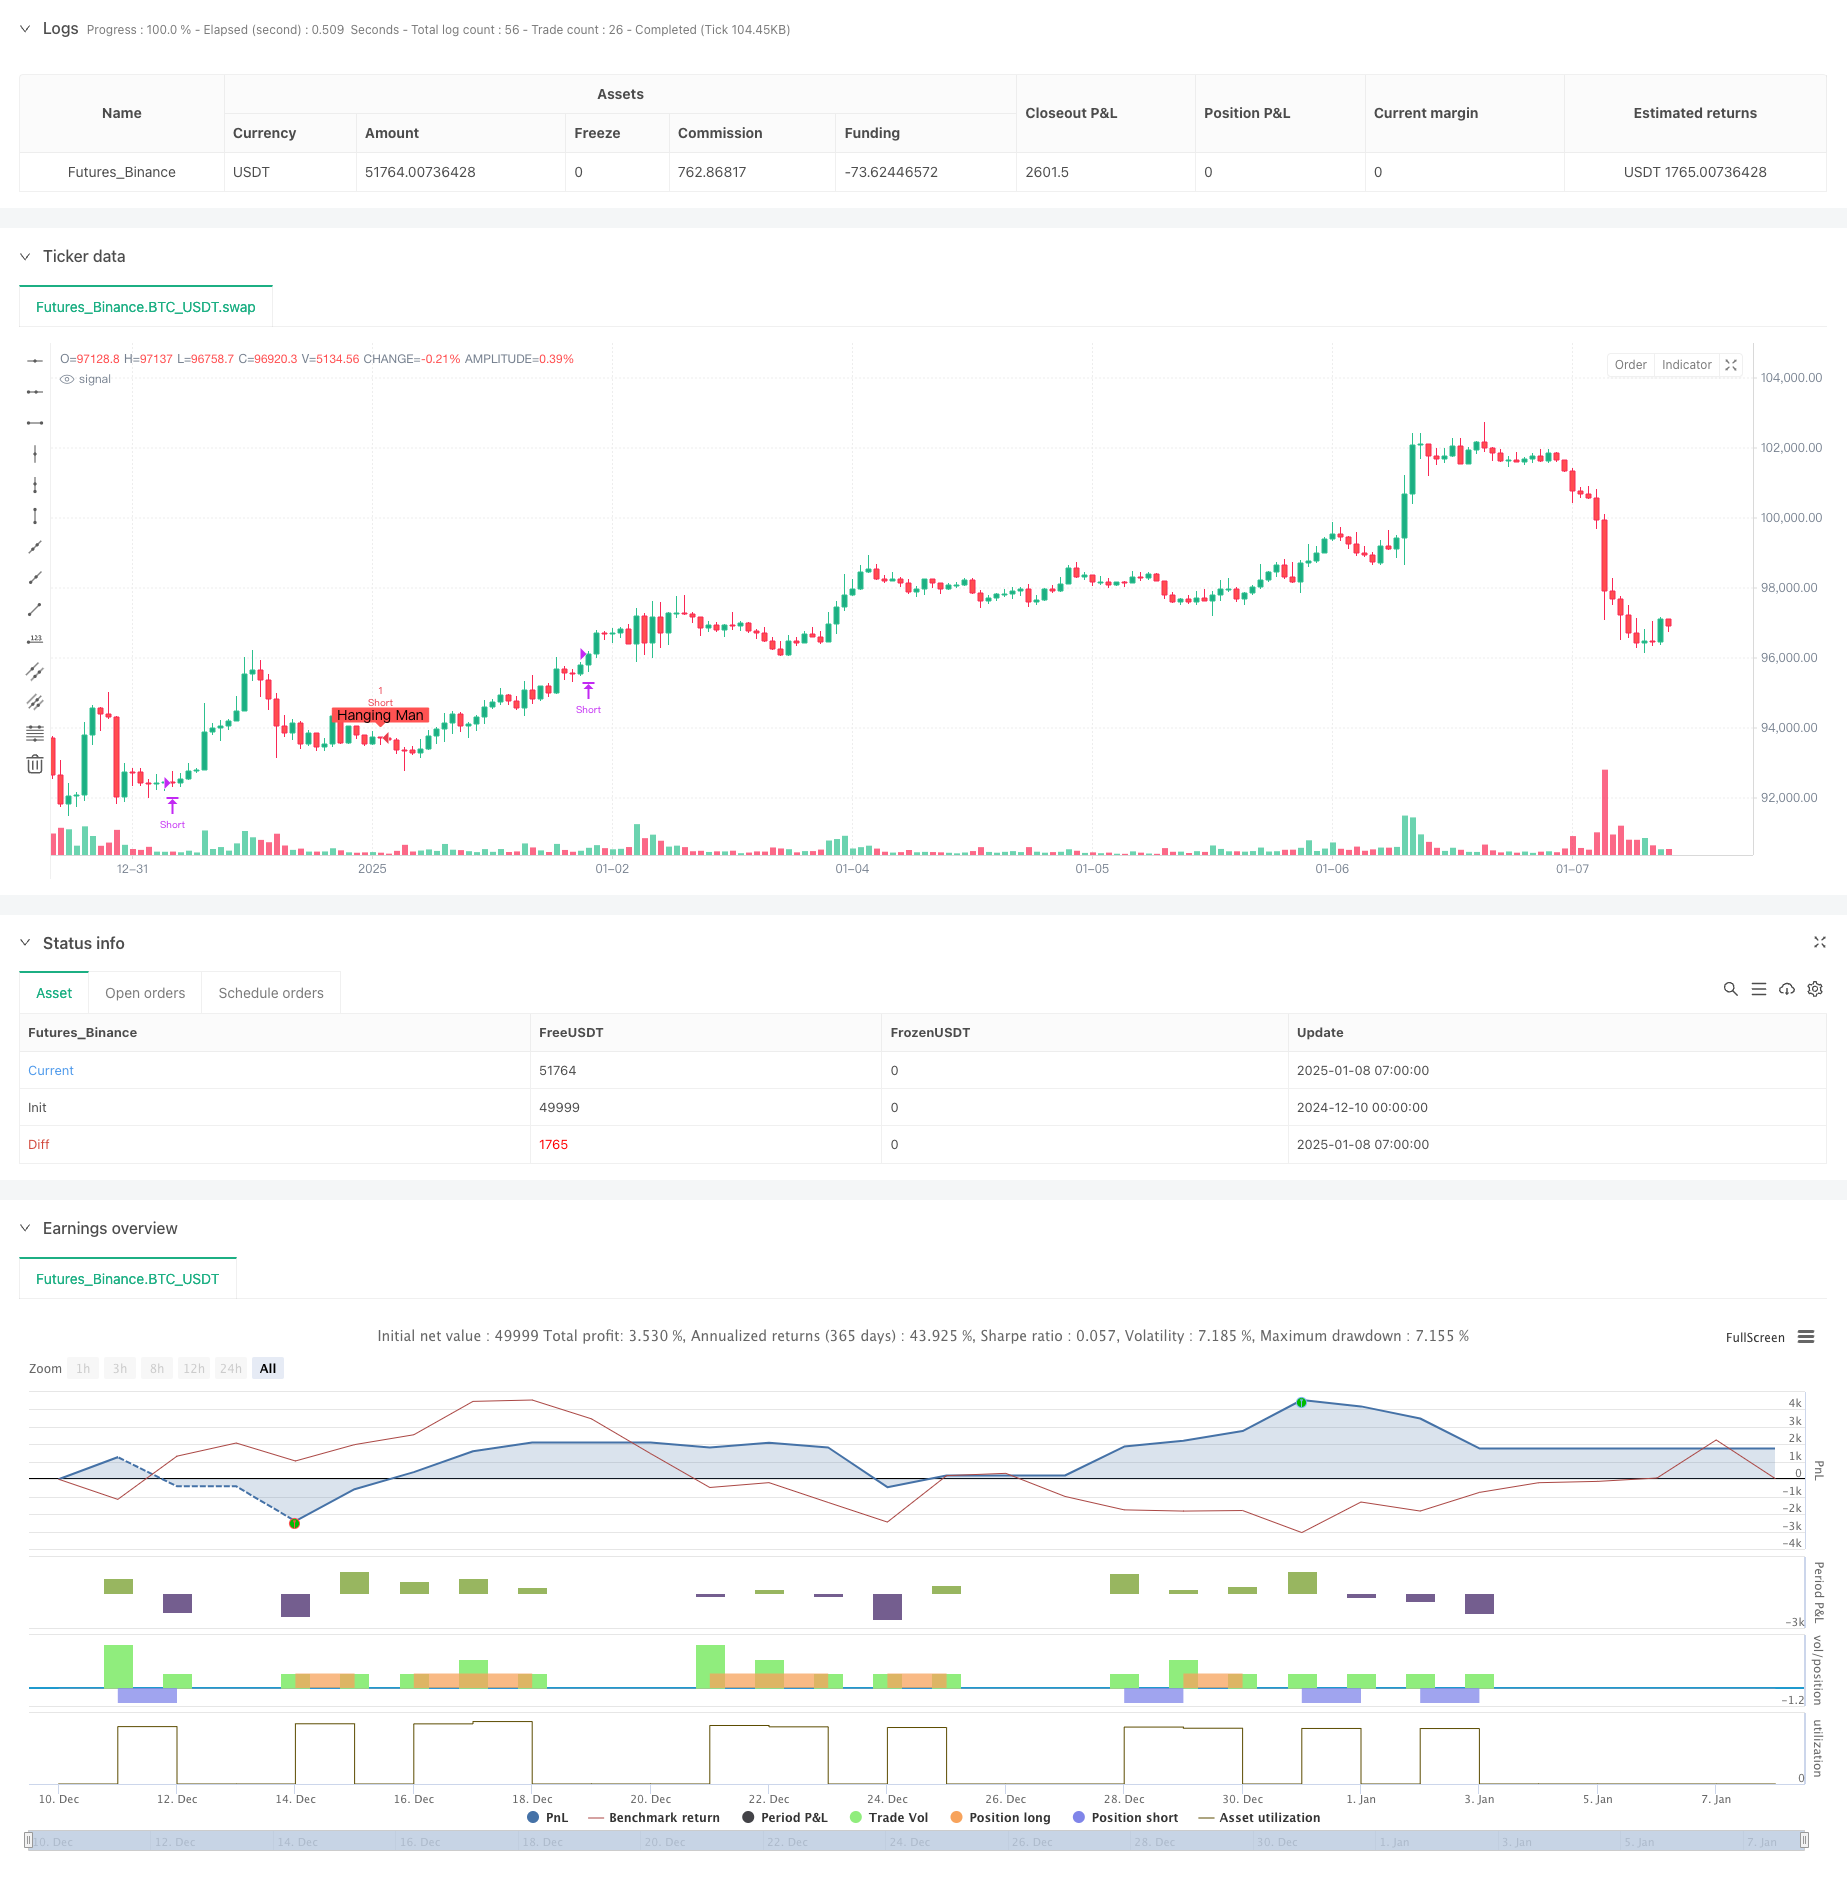
本策略是一个基于锤子线和上吊线这两种经典K线形态的量化交易系统。策略通过识别市场中的这些反转形态来预测价格走势的潜在转折点。系统结合了多重技术指标来确认信号的有效性,包括K线实体与影线的比例关系、趋势方向等要素,实现了对市场反转点的精确捕捉。
策略原理
策略的核心逻辑是通过程序化方式识别两种关键的K线形态: 1. 锤子线:在下跌趋势中出现,暗示可能出现反转上涨。其特征是具有小实体、长下影线(至少是实体长度的2倍)和极短或没有上影线。 2. 上吊线:在上涨趋势中出现,暗示可能出现反转下跌。形态特征与锤子线相似,但出现位置和意义相反。
策略通过设定严格的参数来量化这些形态,包括: - 最小K线实体长度乘数 - 下影线与K线高度的比率 - 持仓周期
策略优势
- 系统化识别:通过程序化方式精确识别行情反转信号,避免了人为判断的主观性。
- 风险可控:设置了明确的持仓周期,避免了过度持仓带来的风险。
- 信号可视化:在图表上直观显示交易信号,便于分析和优化。
- 参数灵活:可根据不同市场条件调整参数,提高策略适应性。
策略风险
- 假突破风险:反转形态可能出现假信号,需要结合其他技术指标确认。
- 时效性风险:固定的持仓周期可能无法完全捕捉到价格走势的全部潜力。
- 市场环境依赖:在震荡市场中可能产生过多虚假信号。
策略优化方向
- 引入趋势过滤器:可添加移动平均线等指标来过滤趋势,提高信号质量。
- 动态持仓周期:根据市场波动率动态调整持仓时间。
- 多周期确认:引入更高时间框架的趋势确认机制。
- 止损优化:加入动态止损机制,提高风险控制能力。
总结
该策略通过量化方式实现了对经典技术分析理论的系统化应用,具有较强的实用价值。通过参数优化和风险控制机制的完善,策略可以在不同市场环境下保持稳定性能。策略的模块化设计也为后续优化提供了良好基础。
策略源码
/*backtest
start: 2024-12-10 00:00:00
end: 2025-01-08 08:00:00
period: 1h
basePeriod: 1h
exchanges: [{"eid":"Futures_Binance","currency":"BTC_USDT","balance":49999}]
*/

//@version=6
strategy("Hammer and Hanging Man Strategy", overlay=true)

// Input parameters
length = input.int(5, title="Minimum Candle Body Length (Multiplier)", minval=1)
shadowRatio = input.float(1, title="Lower Shadow to Candle Height Ratio", minval=1.0)
holdPeriods = input.int(26, title="Hold Periods (Bars)", minval=1)  // Holding period in bars

// Function to calculate the absolute value
absValue(x) =>
    x >= 0 ? x : -x

// Function to check if it is a Hammer
isHammer() =>
    bodyLength = absValue(close - open)
    candleHeight = high - low
    lowerShadow = math.min(open, close) - low
    upperShadow = high - math.max(open, close)
    smallBody = bodyLength <= candleHeight / length
    longLowerShadow = lowerShadow >= bodyLength * shadowRatio
    shortUpperShadow = upperShadow <= bodyLength
    smallBody and longLowerShadow and shortUpperShadow and close > open

// Function to check if it is a Hanging Man
isHangingMan() =>
    bodyLength = absValue(close - open)
    candleHeight = high - low
    lowerShadow = math.min(open, close) - low
    upperShadow = high - math.max(open, close)
    smallBody = bodyLength <= candleHeight / length
    longLowerShadow = lowerShadow >= bodyLength * shadowRatio
    shortUpperShadow = upperShadow <= bodyLength
    smallBody and longLowerShadow and shortUpperShadow and close < open

// Detect the candles
hammer = isHammer()
hangingMan = isHangingMan()

// Trading logic: Long on Hammer, Short on Hanging Man
if hammer
    strategy.entry("Long", strategy.long)  // Long entry on Hammer

if hangingMan
    strategy.entry("Short", strategy.short)  // Short entry on Hanging Man

// Exit after X bars
if strategy.position_size > 0 and bar_index - strategy.opentrades.entry_bar_index(0) >= holdPeriods
    strategy.close("Long")

if strategy.position_size < 0 and bar_index - strategy.opentrades.entry_bar_index(0) >= holdPeriods
    strategy.close("Short")

// Visualization of signals
plotshape(hammer, title="Hammer", location=location.belowbar, color=color.green, style=shape.labelup, text="Hammer")
plotshape(hangingMan, title="Hanging Man", location=location.abovebar, color=color.red, style=shape.labeldown, text="Hanging Man")
相关推荐