概述
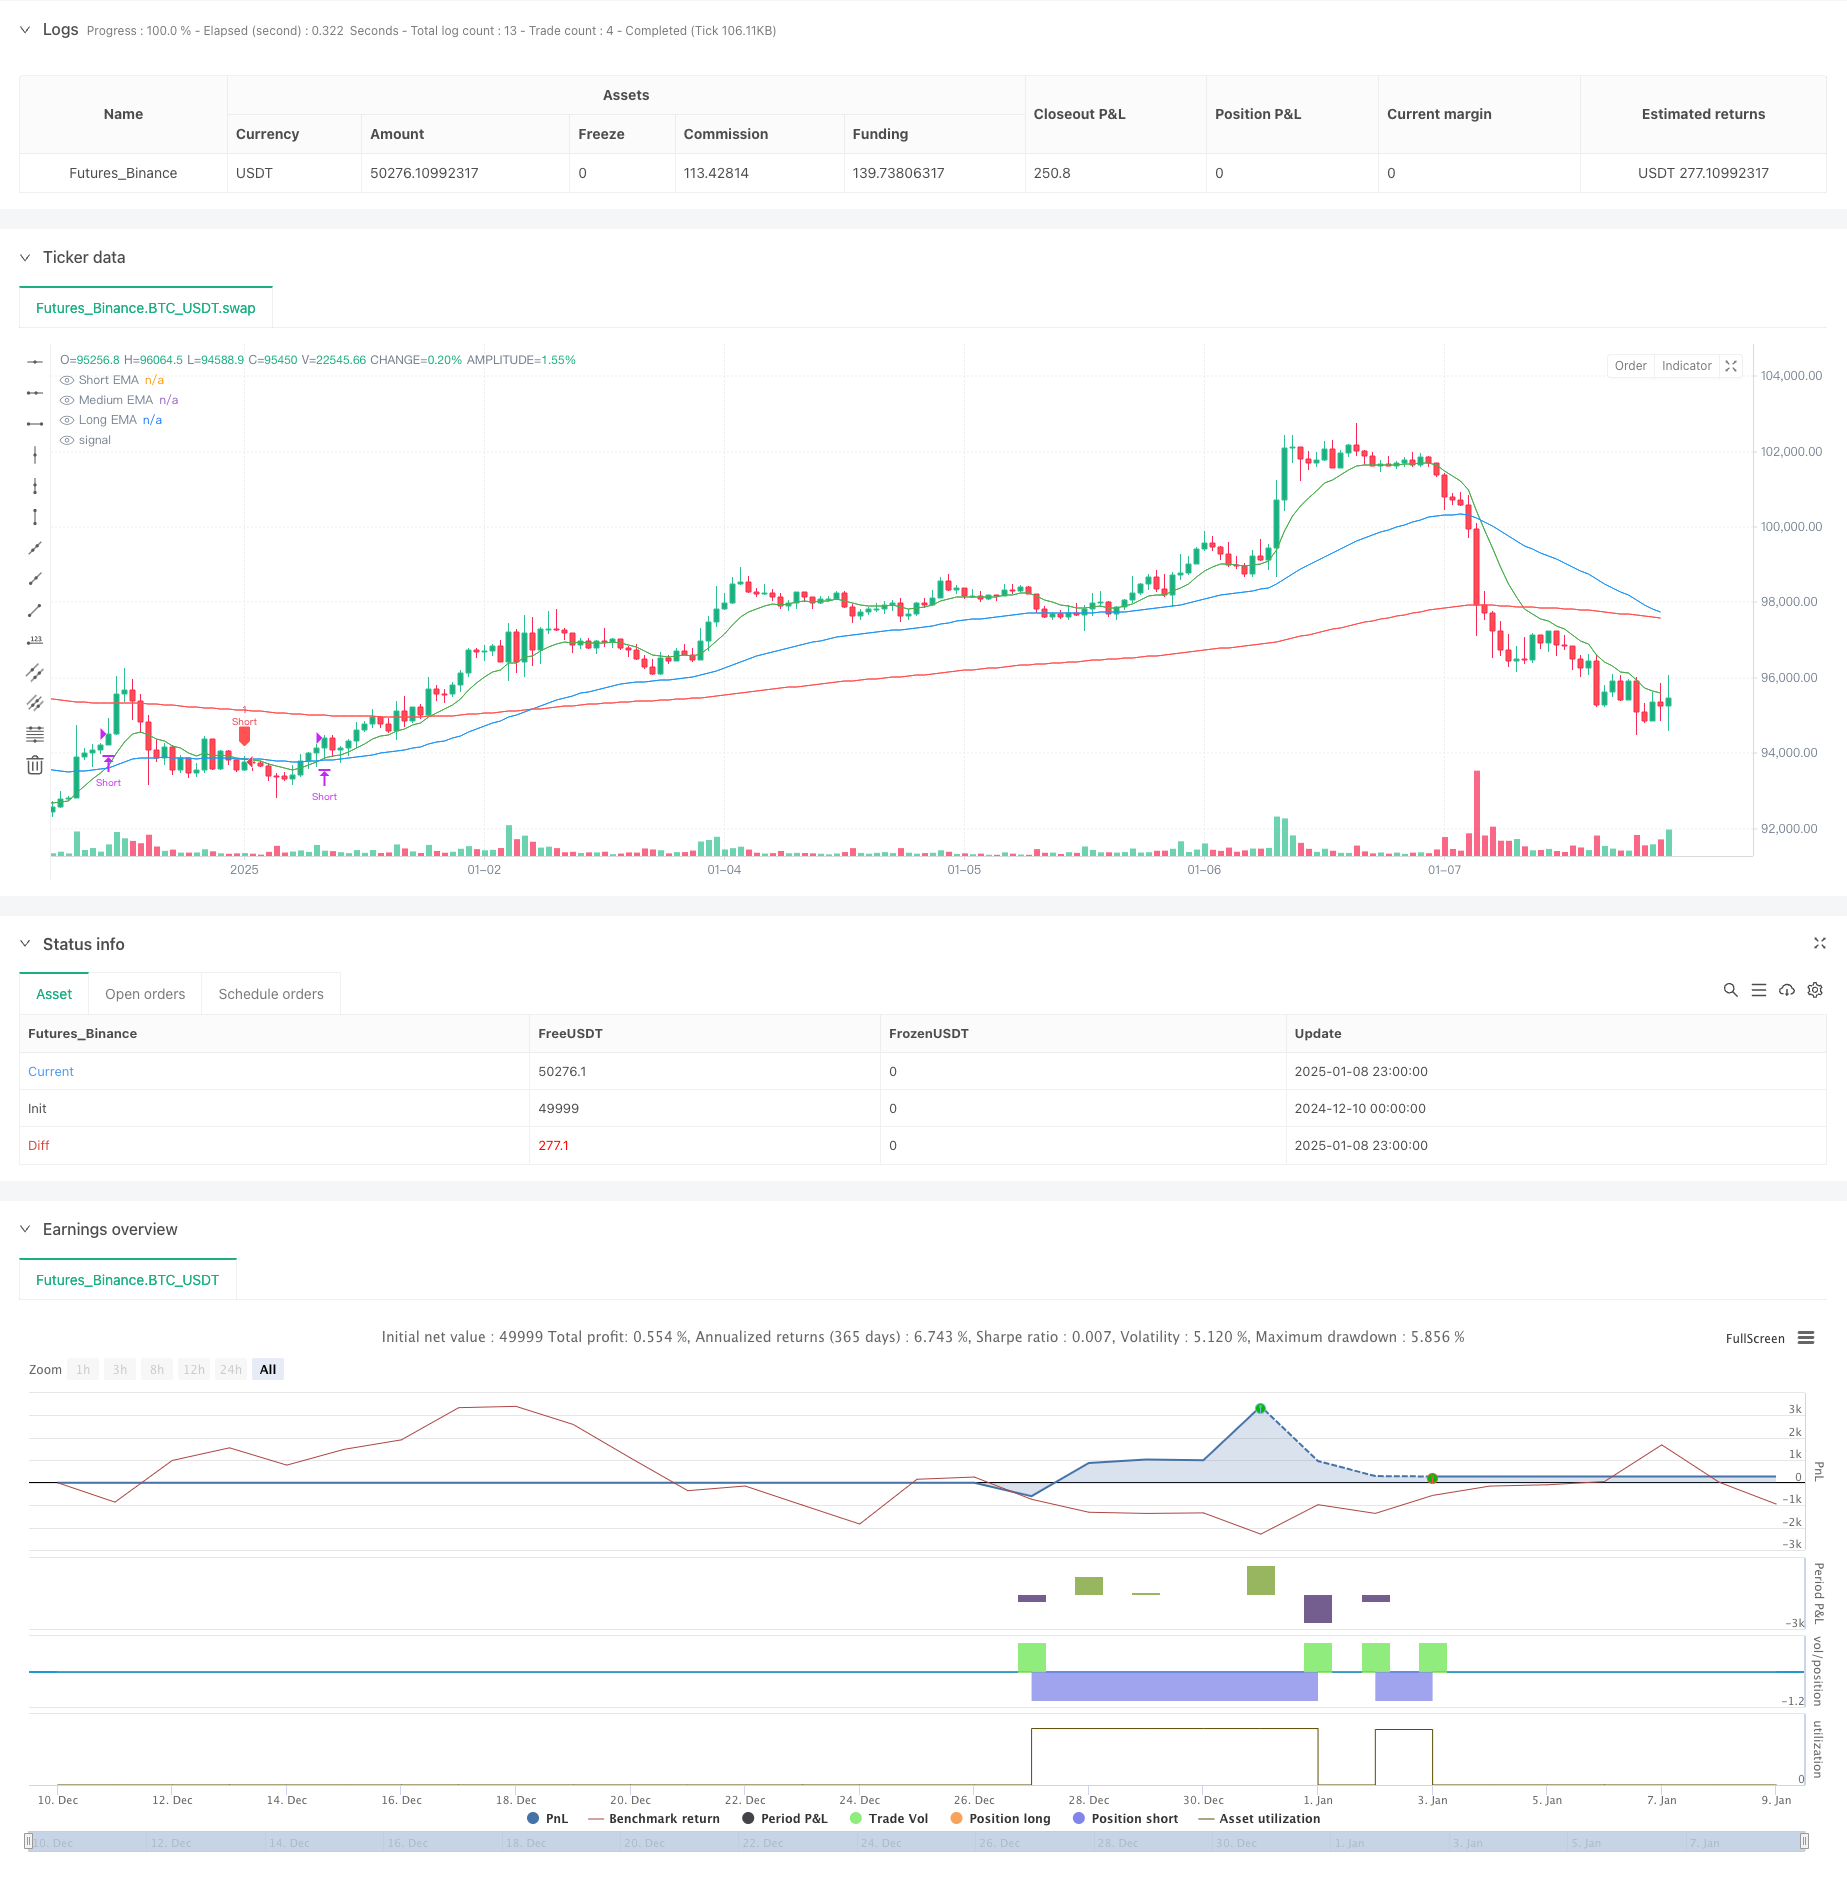
这是一个基于多重指数移动平均线(EMA)交叉的趋势跟踪策略。该策略利用10周期短期EMA、50周期中期EMA和200周期长期EMA的交叉关系来捕捉市场趋势,并在符合条件时进行多空交易。策略的核心思想是通过多重时间框架的移动平均线来过滤市场噪音,识别主要趋势方向,并在趋势延续时获取收益。
策略原理
策略采用三重EMA交叉系统作为交易信号生成机制。具体来说: 1. 使用200周期EMA作为主要趋势判断指标,价格在其上方时只做多,在其下方时只做空 2. 当短期EMA(10周期)向上穿越中期EMA(50周期)且价格在长期EMA之上时,开启做多仓位 3. 当短期EMA向下穿越中期EMA且价格在长期EMA之下时,开启做空仓位 4. 当短期EMA向下穿越中期EMA时,平掉多头仓位 5. 当短期EMA向上穿越中期EMA时,平掉空头仓位 策略还包含调试功能,用于监控异常的EMA交叉情况和关系。
策略优势
- 多重时间框架过滤:通过结合不同周期的EMA,有效降低假信号
- 趋势跟踪性强:策略设计符合趋势跟踪逻辑,能较好地捕捉主要趋势
- 风险控制完善:通过EMA交叉作为止损信号,控制风险
- 逻辑简单明确:策略规则清晰,易于理解和执行
- 适应性强:可应用于不同市场和时间周期
- 自动化程度高:策略规则明确,便于编程实现
策略风险
- 震荡市场风险:在横盘震荡市可能频繁交易导致亏损
- 滞后性风险:移动平均线具有滞后性,可能错过趋势转折点
- 假突破风险:短期价格波动可能触发错误信号
- 资金管理风险:固定仓位可能在某些市况下风险过大
- 参数优化风险:过度优化可能导致策略过拟合
策略优化方向
- 引入波动率指标:考虑加入ATR等波动率指标来动态调整仓位
- 增加趋势强度过滤:可引入ADX等指标衡量趋势强度
- 优化止损机制:考虑设置跟踪止损或固定止损
- 增加市场状态判断:加入对趋势/震荡市的判断逻辑
- 完善仓位管理:根据市场波动性动态调整仓位大小
总结
该策略是一个经典的趋势跟踪系统,通过多重EMA的配合使用,既保证了对主要趋势的把握,又能及时进行止盈止损。虽然存在一定的滞后性,但通过合理的参数设置和风险管理,仍能在趋势市场中获得稳定收益。策略的优化空间较大,可以通过引入其他技术指标和完善交易规则来提升性能。
策略源码
/*backtest
start: 2024-12-10 00:00:00
end: 2025-01-09 00:00:00
period: 1h
basePeriod: 1h
exchanges: [{"eid":"Futures_Binance","currency":"BTC_USDT","balance":49999}]
*/

//@version=5
strategy("EMA Crossover Strategy (Enhanced Debug)", overlay=true)

// Inputs for EMA periods
shortEMA = input.int(10, title="Short EMA Period")
mediumEMA = input.int(50, title="Medium EMA Period")
longEMA = input.int(200, title="Long EMA Period")

// Calculating EMAs
emaShort = ta.ema(close, shortEMA)
emaMedium = ta.ema(close, mediumEMA)
emaLong = ta.ema(close, longEMA)

// Plot EMAs
plot(emaShort, color=color.green, title="Short EMA")
plot(emaMedium, color=color.blue, title="Medium EMA")
plot(emaLong, color=color.red, title="Long EMA")

// Conditions for entry and exit
longCondition = close > emaLong and ta.crossover(emaShort, emaMedium) and emaMedium > emaLong
shortCondition = close < emaLong and ta.crossunder(emaShort, emaMedium) and emaMedium < emaLong
closeLongCondition = ta.crossunder(emaShort, emaMedium)
closeShortCondition = ta.crossover(emaShort, emaMedium)

// Debugging labels for unexpected behavior
if (ta.crossover(emaShort, emaLong) and not ta.crossover(emaShort, emaMedium))
    label.new(bar_index, high, "Short > Long", style=label.style_circle, color=color.red, textcolor=color.white)

// Debugging EMA relationships
if (emaMedium <= emaLong)
    label.new(bar_index, high, "Medium < Long", style=label.style_cross, color=color.orange, textcolor=color.white)

// Entry logic
if (longCondition)
    strategy.entry("Long", strategy.long)

if (shortCondition)
    strategy.entry("Short", strategy.short)

// Exit logic
if (closeLongCondition)
    strategy.close("Long")

if (closeShortCondition)
    strategy.close("Short")

// Display labels for signals
plotshape(series=longCondition, style=shape.labelup, color=color.green, location=location.belowbar, title="Buy Signal")
plotshape(series=shortCondition, style=shape.labeldown, color=color.red, location=location.abovebar, title="Sell Signal")
相关推荐