概述
本策略基于大量级蜡烛线识别与RSI背离指标作为主要信号,结合初始固定止损和动态追踪止损,形成一套完整的趋势跟踪交易系统。策略通过对比当前蜡烛线与前5根蜡烛线的实体大小来识别大量级行情,同时利用快速与慢速RSI的背离来确认动量变化,最后运用双重止损机制来管理风险和锁定利润。
策略原理
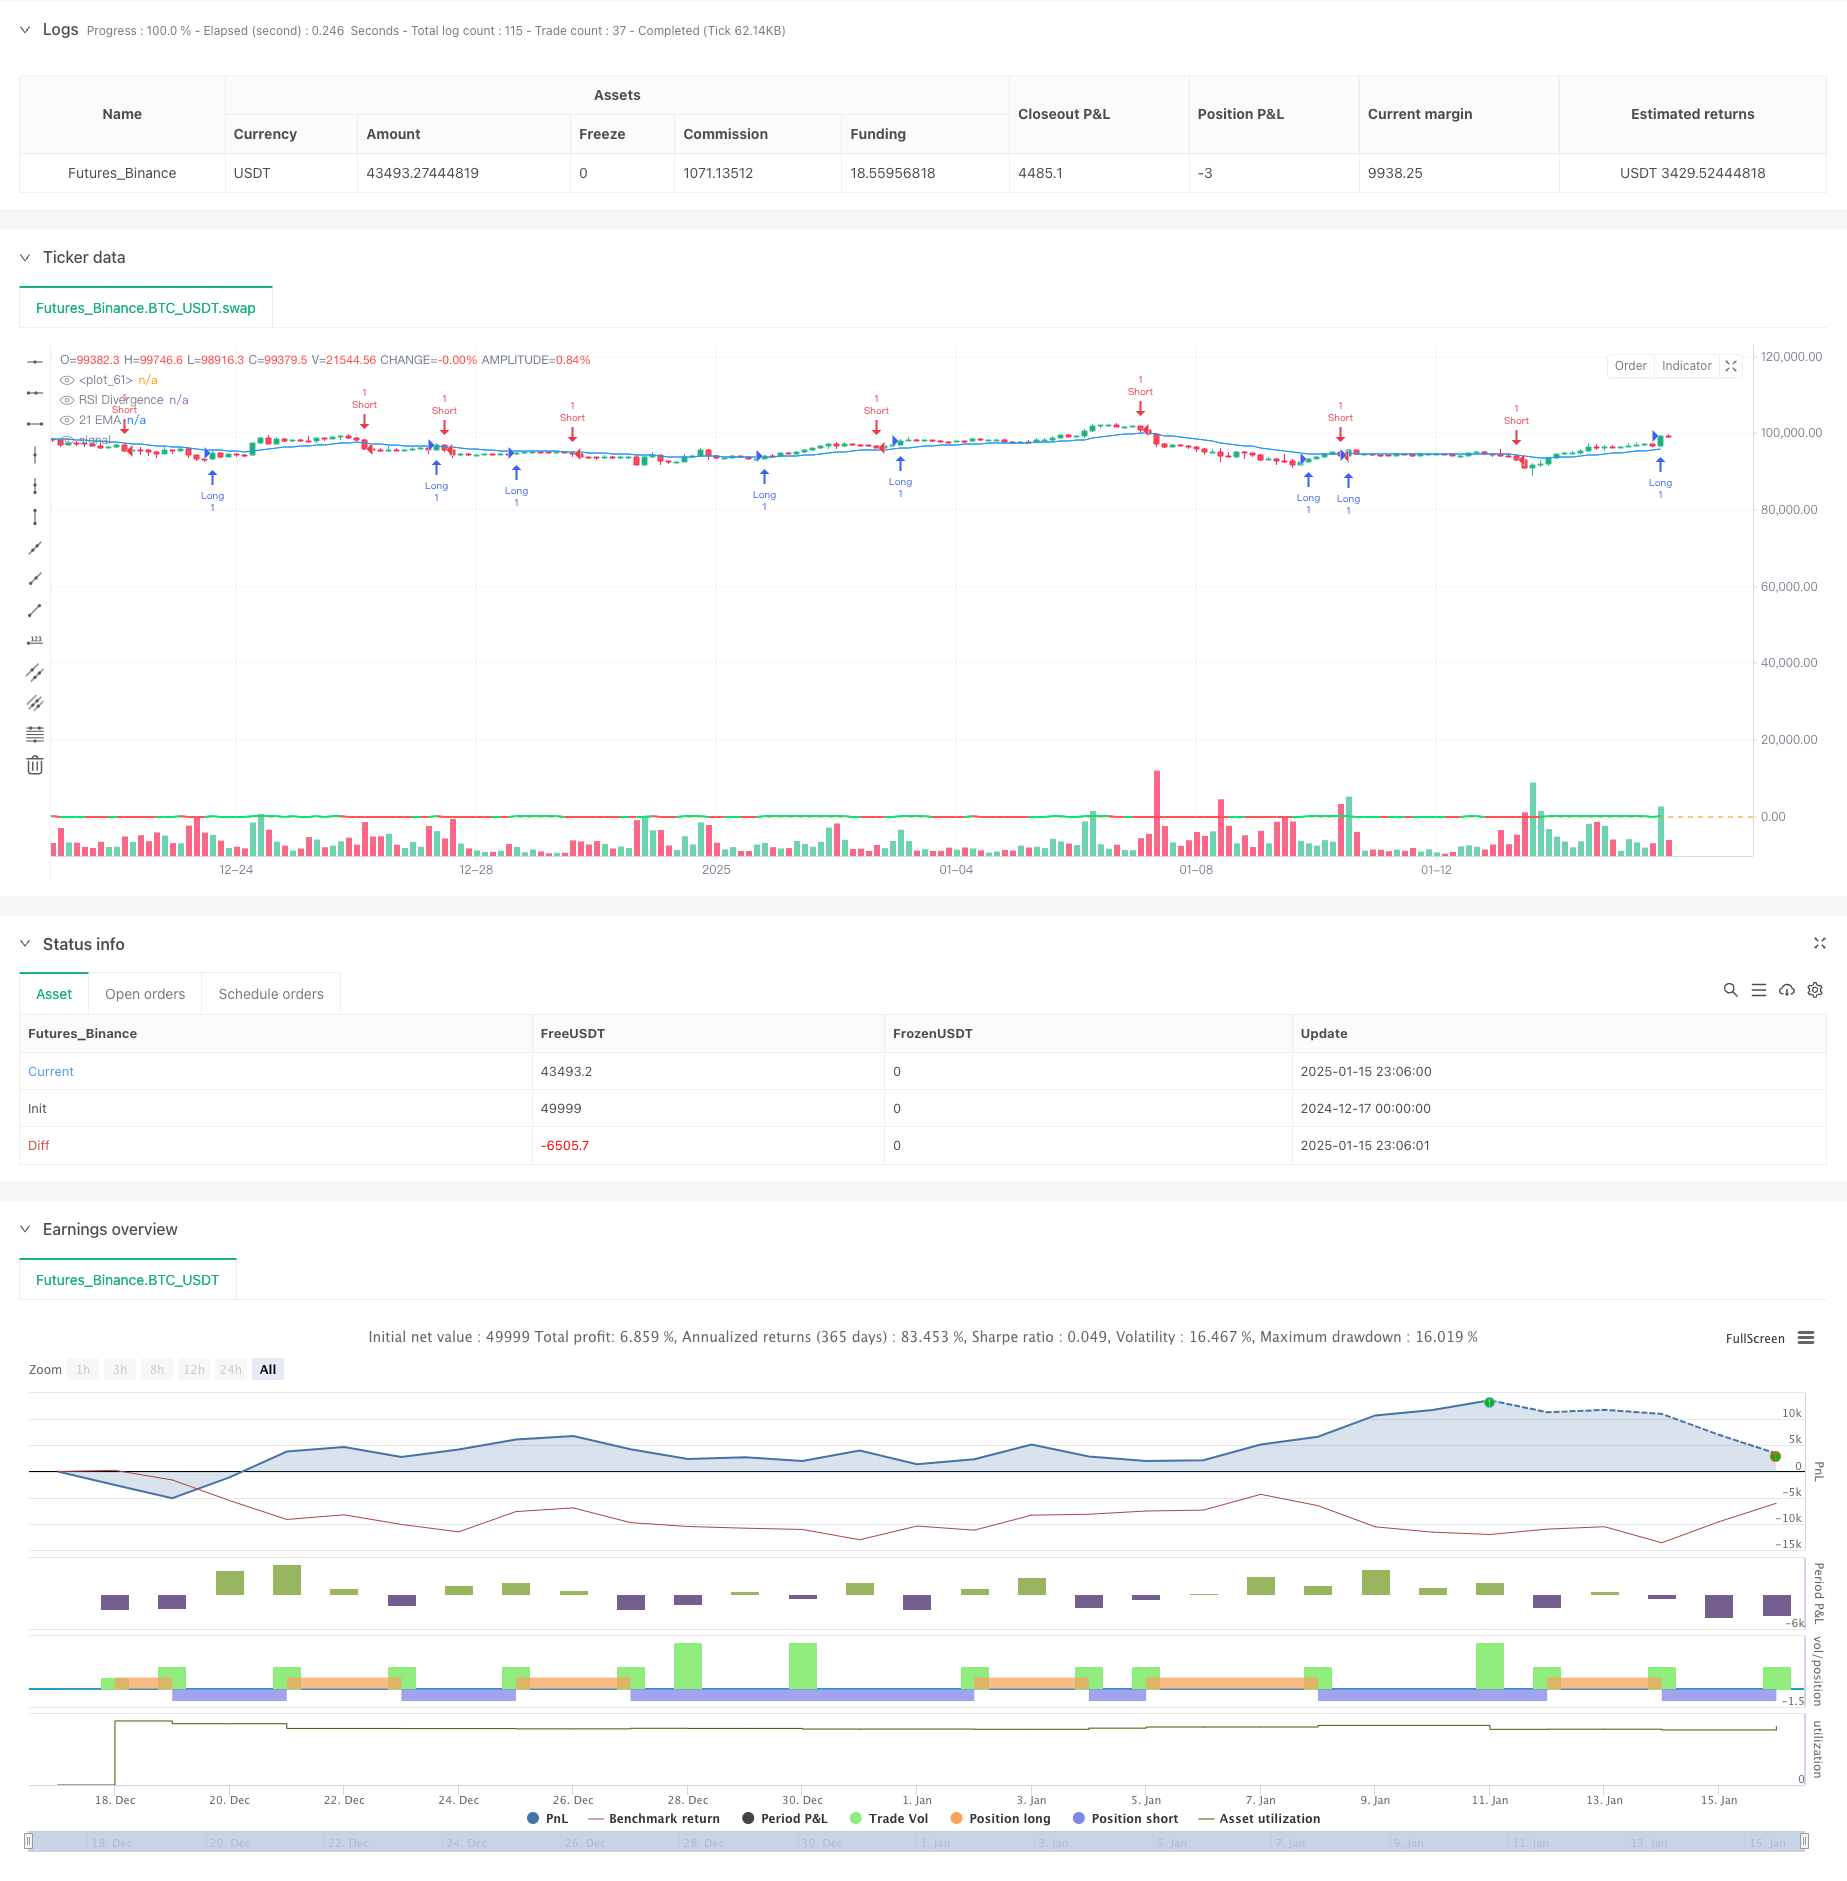
策略包含四个核心组件:1)大量级蜡烛线识别 - 通过对比当前与前5根蜡烛线实体大小来确定显著的价格动量;2)RSI背离分析 - 使用5周期快速RSI和14周期慢速RSI的差值来衡量动量变化;3)初始止损 - 在入场时设置200点的固定止损以控制初始风险;4)追踪止损 - 在盈利达到200个点后激活,与价格保持150个点的动态跟随距离。策略还使用21周期EMA作为趋势过滤器,帮助判断整体市场方向。
策略优势
- 风险管理全面 - 通过固定止损限制最大损失,利用追踪止损保护已实现利润
- 入场信号可靠 - 大量级蜡烛线通常代表强势的价格动量,提供较高概率的交易机会
- 信号确认充分 - RSI背离作为辅助指标,帮助验证动量变化,降低虚假信号风险
- 利润保护灵活 - 动态追踪止损机制允许在保护利润的同时捕捉更大的价格走势
- 参数可调整性强 - 关键参数如追踪起始点、追踪距离和初始止损都可根据不同市场特征进行优化
策略风险
- 震荡市场风险 - 在横盘整理阶段可能频繁触发止损
- 跳空风险 - 大幅跳空可能导致实际止损点位与预期不符
- 滑点风险 - 在快速行情中可能面临较大滑点,影响实际执行效果
- 假突破风险 - 大量级蜡烛线后可能出现假突破,导致止损出场
- 参数敏感性 - 止损参数的设置对策略表现影响较大
策略优化方向
- 市场环境过滤 - 建议添加波动率指标如ATR,在低波动率环境下暂停交易
- 入场时机优化 - 可结合价格形态或其他技术指标,提高入场时机的准确性
- 止损参数动态化 - 考虑根据市场波动性动态调整追踪止损距离
- 仓位管理改进 - 可引入基于波动率的仓位sizing机制
- 增加趋势强度过滤 - 可添加趋势强度指标,在强趋势中采用更宽松的止损设置
总结
该策略通过结合大量级蜡烛线和RSI背离构建了一个完整的趋势跟踪系统,并通过双重止损机制实现了全面的风险管理。策略适合在趋势明确、波动性较大的市场环境中运作,但需要交易者根据具体市场特征调整参数设置。通过建议的优化方向,策略的稳定性和盈利能力有望得到进一步提升。
策略源码
/*backtest
start: 2024-12-17 00:00:00
end: 2025-01-16 00:00:00
period: 3h
basePeriod: 3h
exchanges: [{"eid":"Futures_Binance","currency":"BTC_USDT","balance":49999}]
*/

//@version=6
strategy('[F][IND] - Big Candle Identifier with RSI Divergence and Advanced Stops', shorttitle = '[F][IND] Big Candle RSI Trail', overlay = true)

// Inputs for the trailing stop and stop loss
trail_start_ticks = input.int(200, "Trailing Start Ticks", tooltip="The number of ticks the price must move in the profitable direction before the trailing stop starts.")
trail_distance_ticks = input.int(150, "Trailing Distance Ticks", tooltip="The distance in ticks between the trailing stop and the price once the trailing stop starts.")
initial_stop_loss_points = input.int(200, "Initial Stop Loss Points", tooltip="The fixed stop loss applied immediately after entering a trade.")

// Tick size based on instrument
tick_size = syminfo.mintick

// Calculate trailing start and distance in price
trail_start_price = trail_start_ticks * tick_size
trail_distance_price = trail_distance_ticks * tick_size
initial_stop_loss_price = initial_stop_loss_points * tick_size

// Identify big candles
body0 = math.abs(close[0] - open[0])
body1 = math.abs(close[1] - open[1])
body2 = math.abs(close[2] - open[2])
body3 = math.abs(close[3] - open[3])
body4 = math.abs(close[4] - open[4])
body5 = math.abs(close[5] - open[5])

bullishBigCandle = body0 > body1 and body0 > body2 and body0 > body3 and body0 > body4 and body0 > body5 and open < close
bearishBigCandle = body0 > body1 and body0 > body2 and body0 > body3 and body0 > body4 and body0 > body5 and open > close

// RSI Divergence
rsi_fast = ta.rsi(close, 5)
rsi_slow = ta.rsi(close, 14)
divergence = rsi_fast - rsi_slow

// Trade Entry Logic
if bullishBigCandle
    strategy.entry('Long', strategy.long, stop=low - initial_stop_loss_price)
if bearishBigCandle
    strategy.entry('Short', strategy.short, stop=high + initial_stop_loss_price)

// Trailing Stop Logic
var float trail_stop = na
if strategy.position_size > 0 // Long Position
    entry_price = strategy.position_avg_price
    current_profit = close - entry_price
    if current_profit >= trail_start_price
        trail_stop := math.max(trail_stop, close - trail_distance_price)
    strategy.exit("Trailing Stop Long", "Long", stop=trail_stop)

if strategy.position_size < 0 // Short Position
    entry_price = strategy.position_avg_price
    current_profit = entry_price - close
    if current_profit >= trail_start_price
        trail_stop := math.min(trail_stop, close + trail_distance_price)
    strategy.exit("Trailing Stop Short", "Short", stop=trail_stop)

// Plotting Trailing Stop
plot(strategy.position_size > 0 ? trail_stop : na, color=color.green, title="Trailing Stop (Long)")
plot(strategy.position_size < 0 ? trail_stop : na, color=color.red, title="Trailing Stop (Short)")

// Plotting RSI Divergence
plot(divergence, color=divergence > 0 ? color.lime : color.red, linewidth=2, title="RSI Divergence")
hline(0)

// Plotting EMA
ema21 = ta.ema(close, 21)
plot(ema21, color=color.blue, title="21 EMA")
相关推荐