概述
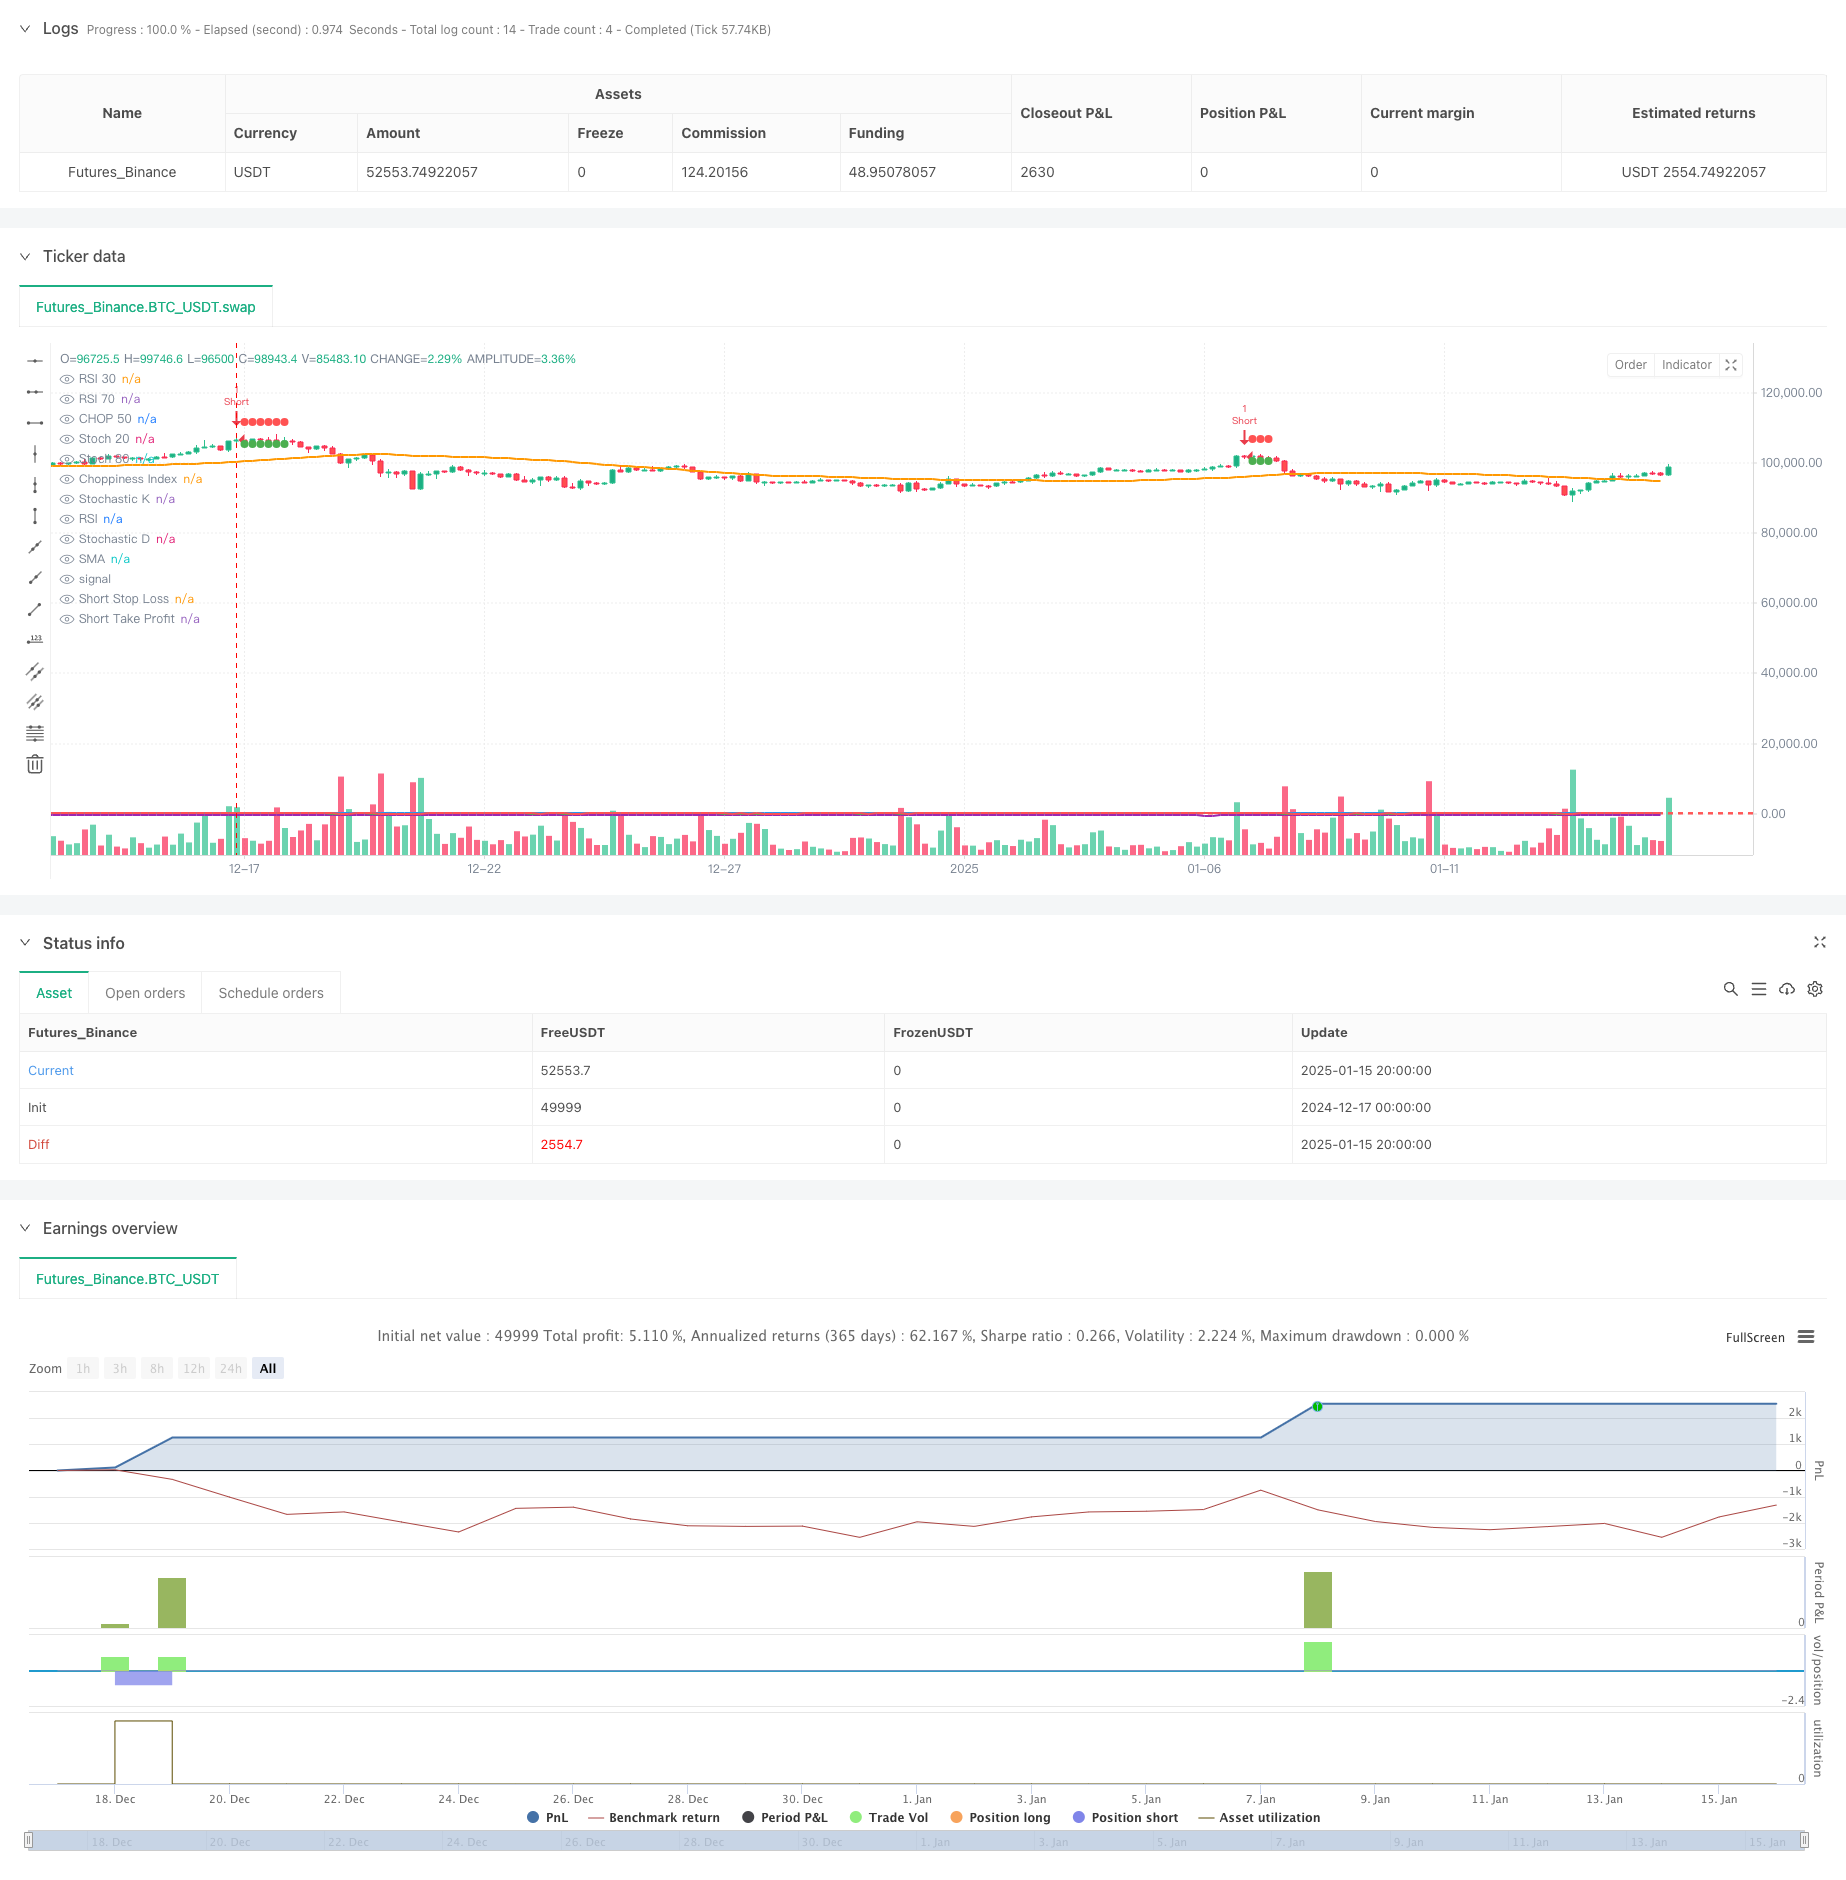
该策略是一个结合了多个技术指标的自动化交易系统,主要通过RSI(相对强弱指标)、CHOP(震荡指数)和随机指标(Stochastic)的协同配合来识别市场趋势,并通过动态止盈止损管理交易风险。策略采用5分钟时间周期进行短线交易,通过多指标交叉验证提高交易的准确性和可靠性。
策略原理
策略使用了四个核心指标进行趋势判断和交易信号生成: 1. RSI用于判断超买超卖状态,RSI<30视为超卖,>70视为超买 2. CHOP指数用于判断市场是否处于震荡状态,<50表示趋势明显 3. 随机指标的K线与D线的交叉用于确认交易时机 4. SMA(简单移动平均线)用于辅助判断整体趋势
交易规则如下: - 做多条件:RSI<30 + CHOP<50 + K线上穿D线 - 做空条件:RSI>70 + CHOP<50 + K线下穿D线 策略通过百分比设置动态止盈止损位,实现风险控制。
策略优势
- 多指标交叉验证提高了信号的可靠性
- 通过CHOP指数过滤震荡市场,减少假信号
- 动态止盈止损机制,根据入场价格自动调整风险管理位
- 采用5分钟周期,适合短线交易,降低持仓风险
- 指标参数可调,具有较强的适应性
策略风险
- 多指标配合可能导致交易信号滞后
- 在高波动市场中可能错过部分交易机会
- 固定百分比的止盈止损可能不适合所有市场环境
- 短周期交易受市场噪音影响较大 建议采用资金管理和仓位控制来降低风险。
策略优化方向
- 引入自适应参数机制,根据市场波动度动态调整指标参数
- 增加成交量指标验证,提高交易信号有效性
- 开发动态止盈止损算法,根据市场波动度自动调整风险控制位
- 增加趋势强度过滤器,进一步优化交易机会的选择
- 考虑加入时间过滤,避开高波动时段
总结
该策略通过多指标组合和严格的风险控制,构建了一个相对完整的交易系统。虽然存在一些需要优化的地方,但整体设计思路清晰,具有实战应用价值。通过持续优化和参数调整,可以进一步提高策略的稳定性和盈利能力。
策略源码
/*backtest
start: 2024-12-17 00:00:00
end: 2025-01-16 00:00:00
period: 4h
basePeriod: 4h
exchanges: [{"eid":"Futures_Binance","currency":"BTC_USDT","balance":49999}]
*/

//@version=5
strategy("RSI + CHOP + Stochastic Strategy", overlay=true)

// Parametry wskaźników
rsiPeriod = input(14, title="RSI Period")
chopPeriod = input(14, title="Choppiness Period")
stochK = input(14, title="Stochastic K Period")
stochD = input(3, title="Stochastic D Period")
stochSmoothK = input(3, title="Stochastic Smooth K Period")
smaPeriod = input(50, title="SMA Period")

// Parametry Take Profit i Stop Loss
longTakeProfitPct = input.float(1.0, title="Long Take Profit %", minval=0.1, step=0.1) / 100
longStopLossPct = input.float(5.0, title="Long Stop Loss %", minval=0.1, step=0.1) / 100
shortTakeProfitPct = input.float(1.0, title="Short Take Profit %", minval=0.1, step=0.1) / 100
shortStopLossPct = input.float(5.0, title="Short Stop Loss %", minval=0.1, step=0.1) / 100

// Obliczenia wskaźników
rsiValue = ta.rsi(close, rsiPeriod)

highLowRange = ta.highest(high, chopPeriod) - ta.lowest(low, chopPeriod)
chopIndex = 100 * math.log10(highLowRange / ta.sma(close, chopPeriod)) / math.log10(2)

stoch = ta.stoch(close, high, low, stochK)
k = stoch[0]
d = stoch[1]

// Obliczenia SMA
smaValue = ta.sma(close, smaPeriod)

// Warunki kupna i sprzedaży
buyCondition = (rsiValue < 30) and (chopIndex < 50) and (ta.crossover(k, d))
sellCondition = (rsiValue > 70) and (chopIndex < 50) and (ta.crossunder(k, d))

var float longStopLevel = na
var float longTakeProfitLevel = na
var float shortStopLevel = na
var float shortTakeProfitLevel = na

// Wejście w pozycję długą
if (buyCondition and na(longStopLevel))
    strategy.entry("Long", strategy.long)
    longStopLevel := na // Zresetuj poziom Stop Loss
    longTakeProfitLevel := na // Zresetuj poziom Take Profit

// Wejście w pozycję krótką
if (sellCondition and na(shortStopLevel))
    strategy.entry("Short", strategy.short)
    shortStopLevel := na // Zresetuj poziom Stop Loss
    shortTakeProfitLevel := na // Zresetuj poziom Take Profit

// Ustaw poziomy Take Profit i Stop Loss na podstawie ceny wejścia w pozycję
if (strategy.position_size > 0 and na(longTakeProfitLevel))
    longStopLevel := strategy.position_avg_price * (1 - longStopLossPct)
    longTakeProfitLevel := strategy.position_avg_price * (1 + longTakeProfitPct)

if (strategy.position_size < 0 and na(shortTakeProfitLevel))
    shortStopLevel := strategy.position_avg_price * (1 + shortStopLossPct)
    shortTakeProfitLevel := strategy.position_avg_price * (1 - shortTakeProfitPct)

// Resetowanie poziomów po wyjściu z pozycji
if (strategy.position_size == 0)
    longStopLevel := na
    longTakeProfitLevel := na
    shortStopLevel := na
    shortTakeProfitLevel := na

// Wyjście z pozycji długiej
if (strategy.position_size > 0)
    strategy.exit("Take Profit", "Long", limit=longTakeProfitLevel, stop=longStopLevel)

// Wyjście z pozycji krótkiej
if (strategy.position_size < 0)
    strategy.exit("Take Profit", "Short", limit=shortTakeProfitLevel, stop=shortStopLevel)

// Oznaczenie poziomów stop loss i take profit na wykresie
plot(series=longStopLevel, title="Long Stop Loss", color=color.red, linewidth=1, style=plot.style_circles)
plot(series=longTakeProfitLevel, title="Long Take Profit", color=color.green, linewidth=1, style=plot.style_circles)
plot(series=shortStopLevel, title="Short Stop Loss", color=color.red, linewidth=1, style=plot.style_circles)
plot(series=shortTakeProfitLevel, title="Short Take Profit", color=color.green, linewidth=1, style=plot.style_circles)

// Wyświetlanie wskaźników na wykresie
plot(rsiValue, title="RSI", color=color.blue, linewidth=2)
hline(30, "RSI 30", color=color.red)
hline(70, "RSI 70", color=color.red)

plot(chopIndex, title="Choppiness Index", color=color.purple, linewidth=2)
hline(50, "CHOP 50", color=color.red)

plot(k, title="Stochastic K", color=color.green, linewidth=2)
plot(d, title="Stochastic D", color=color.red, linewidth=2)
hline(20, "Stoch 20", color=color.red)
hline(80, "Stoch 80", color=color.red)

// Wyświetlanie SMA na wykresie
plot(smaValue, title="SMA", color=color.orange, linewidth=2)
相关推荐