

Introduction to keywords, grammar, settings
Structure of code
General structure that code in Pine follows:
<version>
<declaration_statement>
<code>
Notes
Notes symbols supported by Pine language of FMZ: single-line notes//, multi-line notes/* */, such as the notes method in the following example:
pine
[macdLine, signalLine, histLine] = ta.macd(close, 12, 26, 9) // calculate the MACD indicator
/*
The plot function draws the indicator line on the chart
*/
plot(macdLine, color = color.blue, title='macdLine')
plot(signalLine, color = color.orange, title='signalLine')
plot(histLine, color = color.red, title='histLine')
Version
A compiler instructions of the following form tells the compiler which version of Pine that the script was written with:
            pine

            //@version=5
The default is V5 version, which can be omitted from the code //@version=5.
Declaration statement
The declaration statement determines the type of script, which in turn determines what is allowed in it, and how it is used and executed. Set key properties of the script, such as its name, where it will appear when it is added to the chart, the precision and format of the numerical values it displays, and certain numerical values that govern its runtime behavior, for example, the maximum number of drawing objects to display in the chart. For strategies, attributes include arguments that control backtesting, such as initial capital, commissions, slippage, etc. There is no requirement that a indicator() or strategy() declaration statement must be included in a strategy code in Pine of FMZ.
Code
Lines in a script that are not comments or compiler instructions, which are statements, which implement the algorithm of the script. A statement can be one of these contents.
- Variable declaration
- Reassignment of variables
- Function declaration
- Built-in function calls, user-defined function calls
if,for,whileorswitchand other constructs
Statements can be arranged in a variety of ways
- Some statements can be expressed in one line, such as most variable declarations, lines containing only one function call, or single-line function declarations. Others, like structures, always require multiple lines because they require a local block.
- Statements in the global scope of a script (i.e. parts that are not part of a local block) cannot begin with a
spaceortab(tab key). Their first character must also be the first character of the line. Lines that start at the first position of a line are by definition part of the script's global scope. - A
local blockis always required for structure or multi-line function declarations. A local block must be indented by one tab or four spaces (otherwise, it will be parsed as the concatenated code of the previous line, which is determined to be the continuous content of the previous line of code), and each local block defines a different local scope. - Multiple single-line statements can be concatenated on a single line by using commas (,) as delimiters.
- A line can contain comments or just comments.
- Lines can also be wrapped (continued on multiple lines).
For example, include three local blocks, one in the custom function declaration, and two in the variable declaration using the if structure, as follows:
            pine

            indicator("", "", true)             // Declaration statement (global scope), can be omitted

barIsUp() =>                        // Function declaration (global scope)
    close > open                    // Local block (local scope)

plotColor = if barIsUp()            // Variable declaration (global scope)
    color.green                     // Local block (local scope)
else
    color.red                       // Local block (local scope)

runtime.log("color", color = plotColor)  // Call a built-in function to output the log (global scope)
Newline code
Long lines can be split over multiple lines, or "wrapped". A wrapped line must be indented by any amount of whitespace, as long as it is not a multiple of 4 (these boundaries are used to indent local blocks).
            pine

            a = open + high + low + close
It can be wrapped as (note that the number of spaces indented per line is not a multiple of 4):
            pine

            a = open +
      high +
          low +
             close
A long plot() call can be wrapped as:
            pine

            close1 = request.security(syminfo.tickerid, "D", close)      // closing price data series of syminfo.tickerid daily level of the current trading pair
close2 = request.security(syminfo.tickerid, "240", close)    // closing price data series of syminfo.tickerid 240-minute level of the current trading pair
plot(ta.correlation(close, open, 100),                       // Line-long plot() calls can be wrapped
   color = color.new(color.purple, 40),
   style = plot.style_area,
   trackprice = true)
Statements in user-defined function declarations can also be wrapped. However, since a local block must syntactically begin with an indent (4 spaces or 1 tab), when splitting it onto the next line, the continuation of a statement must begin with more than one indent (not equal to 4 multiples of spaces). For example:
            pine

            test(c, o) =>
    ret = c > o ?
       (c > o+5000 ?
          1 :
              0):
       (c < o-5000 ?
          -1 :
              0)

a = test(close, open)
plot(a, title="a")
Time Series
Time series is not a data type or format, instead, it is a concept of a basic structure in the PINE language. Used to store values that change continuously in time, each value corresponds to a point in time. The structure of the concept of time series is suitable for processing and recording a series of data that changes over time.
Take the built-in variable open as an example, the open built-in variable records the opening price of each int representation BAR, if this open is a 5-minute int representation period data. Then this open variable records the opening price of each 5-minute int representation BAR (bar). When your strategy program is executing, open in the code refers to the opening price of the current int representation BAR. In order to refer to the previous values (past values) in the time series, we use the [] history operator. When the strategy is executed on a certain int representation BAR, open[1] The meaning is to refer to the opening price of the previous int representation BAR of the current int representation BAR.
Although time series is very reminiscent of the "array" data structure, although the PINE language also has an array type. But they and time series are completely different concepts.
The time series designed in pine language can easily calculate the cumulative value of the closing price in the strategy code, and there is no need to use loop structures such as for, only the built-in function ta.cum(close) of the PINE language is used. For another example, we need to calculate the average value of the difference between the highest price and the lowest price of the last 14 int representation BARs (that is, the 14 int representation BARs closest to the current moment when the code is executed), which can be written as:ta.sma(high - low, 14)
The result of calling a function on a time series will also leave a trace on the time series, again we use the [] history operator to reference previous values. For example, when testing whether the closing price of the current int representation BAR exceeds the maximum value of the highest price in the last 10 int representation BAR (excluding the current int representation BAR). We can write breach = close > ta.highest(close, 10)[1], and we can also write breach = close > ta.highest(close[1], 10). So ta.highest(close, 10)[1] and ta.highest(close[1], 10) are equivalent.
This can be verified with the following code:
            pine

            strategy("test pine", "test", true)

a = ta.highest(close, 10)[1]
b = ta.highest(close[1], 10)

plotchar(true, title="a", char=str.tostring(a), location=location.abovebar, color=color.red)
plotchar(true, title="b", char=str.tostring(b), location=location.belowbar, color=color.green)
The above test code will output the values of a and b on each BAR in the corresponding time series. It can be seen that the values of a and b are always equal, so these two representation methods are equivalent.
History-referencing
Trading View has a maximum limit on the number of historical data references (up to 5,000), for example, the following code:
            pine

            //@version=6
indicator("test")

ema = ta.ema(close, 10000)      // Error: Error on bar 0: The 'ema'->'sum' function references too many historical candles (10000), the limit is 5000.
plot(ema, "ema")

// pre10000 = ema[10000]        // Error: Invalid number of bars back specified in the history-referencing operator. It accepts a value between 0 and 5000.
// plot(pre10000, "pre10000")
On FMZ, use the "Trading Settings" in the "Pine Language Trading Library" of PINE language strategy, parameter: "Maximum variable period" to set the maximum number of data that can be referenced specifically.
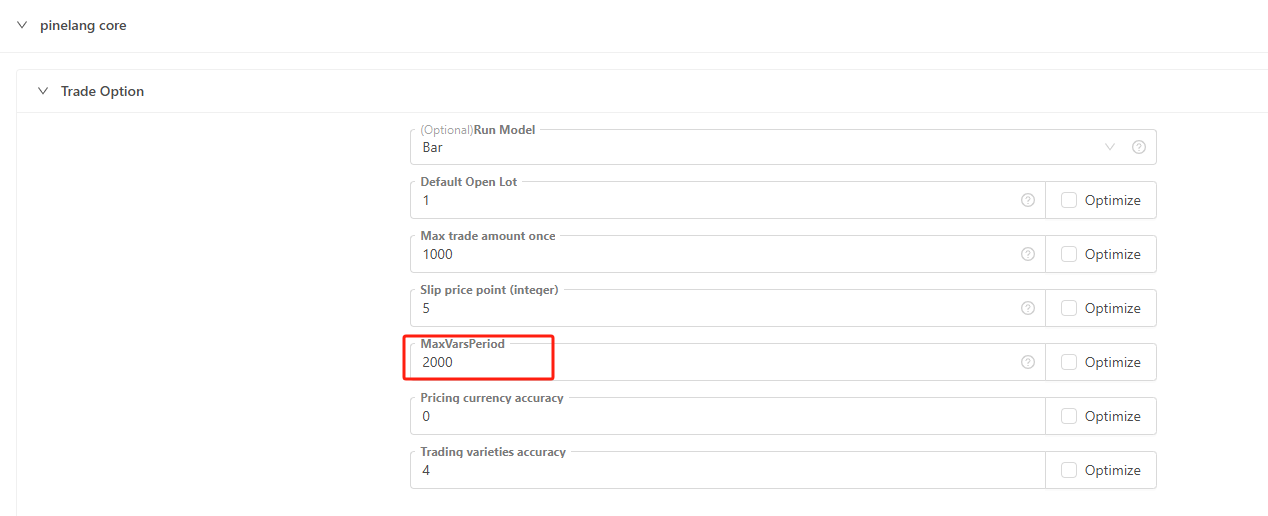
            pine

            indicator("test")

ema = ta.ema(close, 1000)  // ema = ta.ema(close, 3000), then an error will be reported: invalid number 3000 of bars back specified in the history-referencing operator. It accepts a value between 0 and 2000.
plot(ema, "ema")
The parameter "Maximum variable period" should not be set too large, it should be suitable for the range of data referenced in the strategy.
Template arguments of pine language trade class library
Instructions for setting the arguments of the built-in template "Pine Language Trade Class Library" of the PINE strategy.
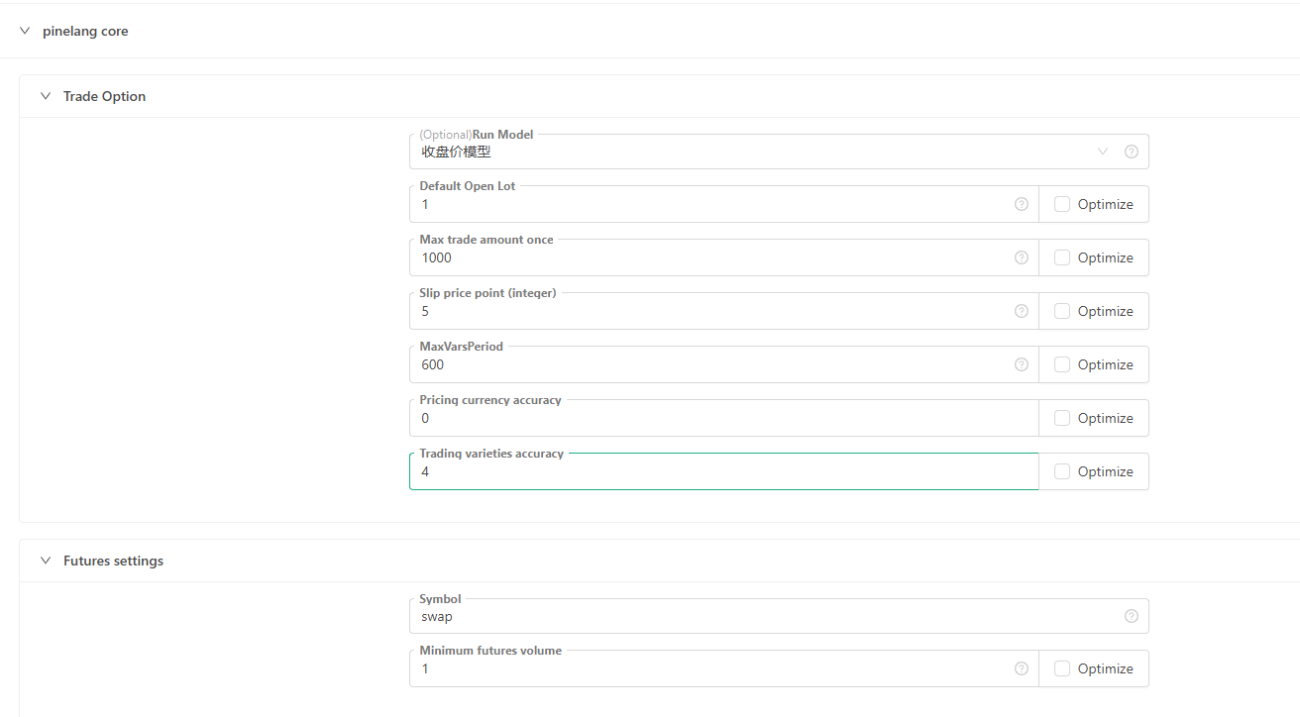
Trade settings
- Execution mode
Closing price model: The model is executed only after the current BAR is completed, and the trade is executed when the next BAR starts.
Real-time price model: The model is executed every time the price moves, and there is a signal to execute the trade immediately. - Default open lot size: If the trade order does not specify the trade amount, the trade will be executed according to the set amount.
- Maximum order quantity for a single trade: Determine the maximum amount of each order to avoid impacting the market according to the actual market and this argument setting.
- Slippage Points: Determine the slippage when placing an order according to the
Pricing Currency Precisionargument and this argument. For example, the pricing currency precision is set to 2, which is accurate to the second decimal point, accurate to 0.01. Then each point of slippage points represents 0.01 pricing units. At this time, the slippage point is set to 5, and the slippage when placing an order is 0.05 (the slippage refers to the part of the price that overflows when placing an order for better and handicap order trade). - The longest period number of variable: affects the number of K-line BAR in the chart. It is the same as calling the function
SetMaxBarLenin thejavascriptsrategy.
Futures options
- Variety code: contract code, it only needs to be set when the exchange object is a non-spot exchange object.
- Minimum contract size: The minimum trading volume of the contract when placing an order.
Live trading options
- Auto-recovery progress: Auto-recovers the state before the last strategy stop.
- Order retry times: If the order is not filled, the order will be cancelled, and the order will be re-placed to try to trade. This argument is used to limit the maximum number of retries.
- Network polling interval (milliseconds): Only valid for REST protocol, it controls the network request interval to prevent requests from being too frequent and exceeding the exchange limit.
- Account synchronization time (seconds): the time period for synchronizing account data.
- Position synchronization time after opening a position (milliseconds): Only for repeated positions caused by data delays in some exchanges, setting a larger synchronization time can alleviate such problems.
- Leverage multiple: sets the leverage multiple.
Spot trading, other settings
- Trading volume of one lot: the default trading volume of one lot, which is only valid for the spot.
- Minimum trade volume: The minimum trade volume.
- Pricing Currency Precision: The price precision, i.e. the number of decimal places in the price.
- Accuracy of the trading variety: the precision of the order quantity, that is, the number of decimal places of the order quantity.
- Handling fee: Calculate some data according to this setting, 0.002 means 2/1000.
- Profit and loss statistics interval: It is only used for displaying profit and loss statistics in the real market.
- Failed Retry (ms): Retry interval when network request fails.
- Use proxy: Only valid for REST protocol.
- Hide common network errors: Hide common error logs in the log area.
- Switch base address: only valid for REST protocol.
- Push notifications: push messages to mailboxes, etc.
Order trade
Open position
            pine

            strategy(title = "open long example", pyramiding = 3)                                // The number of orders placed in the same direction allowed by pyramiding
strategy.entry("long1", strategy.long, 0.01)                                         // Open a long position at the market price, specify the group label as long1
strategy.entry("long2", strategy.long, 0.02, when = close > ta.ema(close, 10))       // The condition is triggered, the order is executed, and the market price opens a long position
strategy.entry("long3", strategy.long, 0.03, limit = 30000)                          // Specify the (lower) price, plan to place a buy order, wait for a deal to open a position, and open a position at a limit price
Close position
            pine

            strategy(title = "close long example", pyramiding = 2)                              // The number of orders placed in the same direction allowed by pyramiding
strategy.entry("long1", strategy.long, 0.1)                                         // Open a long position at the market price, specify the group label as long1
strategy.entry("long2", strategy.long, 0.1)                                         // Open a long position at the market price, specify the group label as long2
strategy.close("long1", when = strategy.position_size > 0.1, qty_percent = 50, comment = "close buy entry for 50%")   // To close a position, specify to close 50% of the positions whose group label is long1
strategy.close("long2", when = strategy.position_size > 0.1, qty_percent = 80, comment = "close buy entry for 80%")   // To close a position, specify to close 80% of the positions whose group label is long2
Trade mechanism
The position mechanism of the PINE language is similar to one-way position. For example, when holding a position in the long direction (long position), if there is an order for sell operation, a planned order, etc. (in the opposite direction of the position), the execution will be triggered, and the position in the long direction will be closed first. (Close all long positions), and then execute the triggered order (in the opposite direction relative to the position before the close).
Planned order
When placing an order using the order placement command, if no price is specified, the default is a market order. In addition to the market order, you can also place an order via a planned order, which does not operate immediately to place an order. The planned order exists in the planned order queue of the program when it is not triggered, and can be seen in the "Planned Order" table tab of the status information (that is, the status bar when the strategy is running) during real order/backtesting. The system will only place an order when the real-time market price meets the conditions to trigger these planned orders. Therefore, it is normal for these orders to have a slight deviation in the trade price. When using the strategy.entry function to place an order, we can specify the limit, stop arguments.
            var isTrade = false
if not barstate.ishistory and not isTrade
    isTrade := true
    strategy.entry("test 1", strategy.long, 0.1, stop=close*1.3, comment="test 1 order")                     // stop
    strategy.entry("test 2", strategy.long, 0.2, limit=close*0.7, comment="test 2 order")                    // limit
    strategy.entry("test 3", strategy.short, 0.3, stop=close*0.6, limit=close*1.4, comment="test 3 order")   // stop-limit
-
limit order
Set the limit price of the order. When the order is a buy order (that is, the
directionargument isstrategy.long), the order will only be triggered when the current market price is lower than this price.
When the order is a sell order (that is, thedirectionargument isstrategy.short), the order will only be triggered if the current market price is higher than this price. -
stop order
Set the stop loss price of the order. When the order is a buy order, the order will only be triggered when the current market price is higher than this price.
When an order is a sell order, the order will only be triggered if the current price of the market is lower than that price. -
stop-limit order
The
limitandstoparguments can be set at the same time, and the order will be triggered at the price that meets the conditions first.
Equity percent order
            pine

            //@version=5
strategy("Percent of Equity Order", overlay=true, default_qty_type=strategy.percent_of_equity, default_qty_value=100)

// Simple moving average crossover strategy
longCondition = ta.crossover(ta.sma(close, 14), ta.sma(close, 28))
shortCondition = ta.crossunder(ta.sma(close, 14), ta.sma(close, 28))

// If the moving average crossover condition is met, buy or sell
if (longCondition)
    strategy.entry("Long", strategy.long)

if (shortCondition)
    strategy.entry("Short", strategy.short)
After specifying default_qty_type=strategy.percent_of_equity, set default_qty_value to a percentage amount (0~100), 1 means 1%. The order quantity is calculated according to the amount of the denominated currency in the account. For example: if the current account has 10,000 USDT, setting a 1% order means placing an order with a scale of 100 USDT (calculated based on the current price when selling).
Trading Log
Interpret log information according to a strategy.
            pine

            // The number of orders in the same direction allowed by pyramiding
strategy(title = "test", pyramiding = 2)

varip bool hasEntered = false   // Whether the position has been opened
varip bool hasExited = false    // Whether the position has been closed
varip bool hasReversed = false  // Whether the position has been reversed

if (not barstate.ishistory) and (not hasEntered)
    strategy.entry("duo1", strategy.long, 1)
    strategy.entry("duo2", strategy.long, 1)
    hasEntered := true

if (not barstate.ishistory) and hasEntered and (not hasExited)
    strategy.close("duo2")
    hasExited := true

if (not barstate.ishistory) and hasExited and (not hasReversed)
    strategy.entry("kong1", strategy.short, 1)
    hasReversed := true
This strategy consists of three execution phases:
-
- Opening a long position
After the order log for "Buy to Open Long" is printed, a system log message (in blue text) is generated:[duo1] direction: long avgPrice: 106000.1 qty: 1.
- Opening a long position
-
- Partially closing the long position
After the order log for "Sell to Close Long" is printed, a system log message (in red text) is generated:[close] (1, duo2, close) exitPrice: 102379.7.
- Partially closing the long position
-
- Reversing to open a short position
Before the reversal can be completed, any remaining long position must be fully closed.
After the final "Sell to Close Long" order is logged, a system log message (in red text) is generated:[close] (1, kong1, short) exitPrice: 102379.8.
Reversing to open a short position
Then, a "Sell to Open Short" order is placed, and the following system log message (in red text) is generated:[kong1] direction: short avgPrice: 102379.6 qty: 1.
- Reversing to open a short position
Order log prices only reflect the order placement price and may differ from the actual execution (fill) price. The system log following the order log contains the actual trade execution details. Using the log entry [close] (1, kong1, short) exitPrice: 102379.8 as an example:
[close]indicates that this is a closing transaction.(1, kong1, short)contains:1: the quantity closed,kong1: the ID related to the trigger for this operation,shortthe direction of the closing trade (i.e., closing a long position before opening short).exitPrice: 102379.8represents the actual exit price of the trade.
Declaration, logical structure keywords
var
var is a keyword used for allocating and one-time initialization of variables.
In general, variable assignment grammar that does not contain the keyword var causes the variable's value to be overwritten every time the data is updated. In contrast, when variables are assigned using the keyword var, they can "keep state" despite data updates, changing it only when the conditions in the if-expressions are met.
var variable_name = expression
Explanation:
variable_name- Any name of a user variable allowed in Pine Script (it can contain uppercase and lowercase Latin characters, numbers and underscores (_), but it cannot start with a number).expression- Any arithmetic expression, just like defining a regular variable. The expression will be evaluated and assigned to the variable for one time.
Example
            pine

            // Var keyword example
var a = close
var b = 0.0
var c = 0.0
var green_bars_count = 0
if close > open
    var x = close
    b := x
    green_bars_count := green_bars_count + 1
    if green_bars_count >= 10
        var y = close
        c := y
plot(a, title = "a")
plot(b, title = "b")
plot(c, title = "c")
The variable 'a' holds the close price of the first bar of each bar in the series.
The variable 'b' holds the closing price of the first 'green' price bar in the series.
The variable 'c' holds the closing price of the tenth 'green' bar in the series.
On FMZ, it is divided into real-time price model and closing price model. We use the following code to test the variables declared by var and varip.
            pine

            strategy("test pine", "test 1", true)

// Test var varip
var i = 0
varip ii = 0

// Print the i and ii changed in each round of the strategy logic on the graph
plotchar(true, title="ii", char=str.tostring(ii), location=location.abovebar, color=color.red)
plotchar(true, title="i", char=str.tostring(i), location=location.belowbar, color=color.green)

// Each round of logic execution increments i and ii by 1
if true
    i := i + 1
    ii := ii + 1
-
Real-time price model
The above test code is executed in two phases: 1. historical int representation phase. 2. real-time int representation phase. In the real-time price model, historical int representation phase, the variables i and ii declared byvar,varipare executed incrementally at each round of strategy code execution (becauseif trueso the corresponding conditional code block is definitely executed). Therefore, it can be seen that the numbers displayed on the int representation BAR of the backtest result are incremented by 1 one by one. When the historical int representation phase ends, the real-time int representation phase begins.var,varipdeclared variables start to change differently. Because it is a real-time price model, the strategy code will be executed once for each price change in a int representation BAR,i := i + 1andii := ii + 1will be executed once. The difference is that ii is modified every time. Although i is also modified every time, the previous value will be restored when the strategy logic is executed in the next round, and the value of i will not be updated until the current int representation BAR is completed (that is, the previous value will not be restored when the strategy logic is executed in the next round) . So it can be seen that the variable i is still increased by 1 for each BAR. But variable ii is accumulated several times for each BAR. -
Closing price model
Since the closing price model executes the strategy logic only once per int representation BAR gone. So the variables declared byvarandvaripin the above example behave exactly the same incrementally at the closing price model, both in the historical int representation phase and the real-time int representation phase, incrementing by 1 per int representation BAR.
varip
varip (var intrabar persist) is a keyword used for assigning and one-time initialization of variables. It is similar to the var keyword, but a variable declared with varip retains its value between live candlestick updates.
varip variable_name = expression
Explanation:
variable_name- Any name of a user variable allowed in a Pine script (it can contain uppercase and lowercase Latin characters, numbers, and underscores (_), but it cannot start with a number).expression- Any arithmetic expression, as the time defining regular variables. On the first K-line bar, the expression is evaluated and assigned to the variable only one time.
Example
            pine

            // varip
varip int v = -1
v := v + 1
plot(v)
When using var, the plot will return the value of bar_index. With varip, the same behavior occurs on historical bars, but on live bars, the chart returns a value that increases by one for each tick.
Remarks
It can only be used with simple types such as float, int, bool, string, and arrays of these types.
true
It represents the value of a bool variable, or a value that can be computed when an expression uses a comparison or logical operator.
Remarks
Please see the descriptions of Comparison Operators and Logical Operators.
See also
bool
false
It represents the value of a bool variable and the result of comparison operations and logical operations.
Remarks
Please see the descriptions of Comparison Operators and Logical Operators.
See also
bool
if
An If statement defines a block of statements that must be executed when the condition of an expression is met. Version 4 of the Pine scripting language allows you to use the "else if" grammar.
Universal code from:
            var_declarationX = if condition
    var_decl_then0
    var_decl_then1
    ...
    var_decl_thenN
    return_expression_then
else if [optional block]
    var_decl_else0
    var_decl_else1
    ...
  var_decl_elseN
  return_expression_else
else
    var_decl_else0
    var_decl_else1
    ...
    var_decl_elseN
    return_expression_else
Remarks
var_declarationX - This variable gets the value of the if statement
condition - If the condition is true, the logic in the statement block then is used (var_decl_then0, var_decl_then1, etc.). If the condition is false, the logic in the statement block else if or else is used (var_decl_else0, var_decl_else1, etc.).
return_expression_then and return_expression_else - The last expression in the module or the expression from the block else returns the final value of the statement. If the variable was declared last, its value will be the result value.
The type of the return value of the if statement depends on the type of return_expression_then and return_expression_else. When running on TradingView, their types must be matched: when you have a string value in the else block, it is not possible to return an integer value from the then block. When running on the FMZ, the following example will not report an error. When the y value is "open", the value of the plot when drawing is n/a.
Example
            pine

            // This code compiles
x = if close > open
    close
else
    open

// This code doesn't compile by trading view
// y = if close > open
//     close
// else
//     "open"
plot(x)
The else block can be omitted. In this case, if the condition is false, the var_declarationX variable is assigned an "empty" value (na, false, or ""):
Example
            pine

            // if
x = if close > open
    close
// If current close > current open, then x = close.
// Otherwise the x = na.
plot(x)
Multiple "else if" blocks can be used or none at all. The blocks of "then", "else if", "else" are moved four spaces:
Example
            pine

            // if
x = if open > close
    5
else if high > low
    close
else
    open
plot(x)
The result value of the if statement can be ignored ("var_declarationX=" can be omitted). It can be useful if you need side effects of expressions, for example, in strategy trading:
Example
            pine

            if (ta.crossover(high, low))
    strategy.entry("BBandLE", strategy.long, stop=low)
else
    strategy.cancel(id="BBandLE")
If statements can contain each other:
Example
            pine

            // if
float x = na
if close > open
    if close > close[1]
        x := close
    else
        x := close[1]
else
    x := open
plot(x)
for
The 'for' construct allows multiple statements to be executed repeatedly:
            [var_declaration =] for counter = from_num to to_num [by step_num]
    statements | continue | break
    return_expression
var_declaration - An optional variable declaration that will be assigned as the value of the loop's return_expression.
counter - A variable that holds the loop counter value, incrementing/decrementing by 1 or the step_num value on each iteration of the loop.
from_num - The starting value of the counter. "series int/float" values/expressions are allowed.
to_num - The final value of the counter. The loop breaks when the counter is greater than to_num (or less than to_num in the case from_num > to_num). "series int/float" values/expressions are allowed, but they are only evaluated on the first iteration of the loop.
step_num - The increment/decrement value of the counter. It is optional. The default is +1 or -1, depending on the largest of from_num or to_num. When using values, the counter is also incremented/decremented according to the largest of from_num or to_num, so the +/- sign of step_num is optional.
statements | continue | break - Any number of statements, or the 'continue' or 'break' keywords, indented by 4 spaces or a single tab.
return_expression - The return value of the loop, if present, is assigned to the variable in var_declaration. If the loop exits due to the "continue" or "break" keywords, the return value of the loop is the return value of the last variable assigned a value before the loop exits.
continue - A keyword that can only be used in loops. It causes the next iteration of the loop to be executed.
break - The keyword to exit the loop.
Example
            pine

            // Here, we count the quantity of bars in a given 'lookback' length which closed above the current bar's close
qtyOfHigherCloses(lookback) =>
    int result = 0
    for i = 1 to lookback
        if close[i] > close
            result += 1
    result
plot(qtyOfHigherCloses(14))
for...in
The for...in construct allows multiple statements to be repeated for each element in the array. It can be used with either argument: array_element, or with two arguments: [index, array_element]. The second form does not affect the function of the loop. It keeps track of the index of the current iteration in the first variable of the tuple.
            [var_declaration =] for array_element in array_id
    statements | continue | break
    return_expression

[var_declaration =] for [index, array_element] in array_id
    statements | continue | break
    return_expression
var_declaration - An optional variable declaration that will be assigned the value of the loop's return_expression.
index - An optional variable that keeps track of the current iteration index. The index starts at 0. Variables are immutable within the loop body. When used, it must be contained in a tuple that also contains array_element.
array_element - A variable containing each consecutive array element to be processed in the loop. This variable is immutable within the loop body.
array_id - The array ID of the loop iteration.
statements | continue | break - Any number of statements, or the 'continue' or 'break' keywords, indented by 4 spaces or a single tab.
return_expression - The return value of the loop is assigned to the variable in var_declaration, if present. If the loop exits due to the 'continue' or 'break' keywords, the return value of the loop is the variable that was last assigned before the loop exited.
continue - A keyword that can only be used in loops. It causes the next iteration of the loop to be executed.
break - The keyword to exit the loop.
Allows to modify elements of an array or their size within a loop.
Here, we use the one-argument form of for...in to determine, for each bar, how many bars have an OHLC value greater than the SMA of the 'close' value:
Example
            pine

            // Here we determine on each bar how many of the bar's OHLC values are greater than the SMA of 'close' values
float[ ] ohlcValues = array.from(open, high, low, close)
qtyGreaterThan(value, array) =>
    int result = 0
    for currentElement in array
        if currentElement > value
            result += 1
        result
plot(qtyGreaterThan(ta.sma(close, 20), ohlcValues))
Here, we use the two-argument form of for...in to set the values of our isPos array to true when their corresponding values in our valuesArray array are positive:
Example
            pine

            // for...in
var valuesArray = array.from(4, -8, 11, 78, -16, 34, 7, 99, 0, 55)
var isPos = array.new_bool(10, false)

for [index, value] in valuesArray
    if value > 0
        array.set(isPos, index, true)

if barstate.islastconfirmedhistory
    runtime.log(str.tostring(isPos))
See also
for while array.sum array.min array.max
while
The while statement allows conditional iteration of native code blocks.
            variable_declaration = while boolean_expression
    ...
    continue
    ...
    break
    ...
    return_expression
Explanation:
variable_declaration - Optional variable declaration. return expression can provide an initialization value for this variable.
boolean_expression - If true, execute the local block of the while statement. If false, script execution continues after the while statement.
continue - The continue keyword causes the loop to branch to the next iteration.
break - The break keyword causes the loop to terminate. Execution of the script resumes after the while statement.
return_expression - Optional line providing the return value of the while statement.
Example
            pine

            // This is a simple example of calculating a factorial using a while loop.
int i_n = input.int(10, "Factorial Size", minval=0)
int counter   = i_n
int factorial = 1
while counter > 0
    factorial := factorial * counter
    counter   := counter - 1

plot(factorial)
Remarks
The native code block after the initial while line must be indented by four spaces or a tab. To terminate a while loop, the boolean expression following while must eventually become false, or break must be executed.
switch
The switch operator transfers control to one of several statements based on the condition and the value of the expression.
            [variable_declaration = ] switch expression
    value1 => local_block
    value2 => local_block
    ...
    => default_local_block

[variable_declaration = ] switch
    boolean_expression1 => local_block
    boolean_expression2 => local_block
    ...
    => default_local_block
switch with expression:
Example
            pine

            // Switch using an expression

string i_maType = input.string("EMA", "MA type", options = ["EMA", "SMA", "RMA", "WMA"])

float ma = switch i_maType
    "EMA" => ta.ema(close, 10)
    "SMA" => ta.sma(close, 10)
    "RMA" => ta.rma(close, 10)
    // Default used when the three first cases do not match.
    => ta.wma(close, 10)

plot(ma)
switch without expression:
Example
            pine

            strategy("Switch without an expression", overlay = true)

bool longCondition  = ta.crossover( ta.sma(close, 14), ta.sma(close, 28))
bool shortCondition = ta.crossunder(ta.sma(close, 14), ta.sma(close, 28))

switch
    longCondition  => strategy.entry("Long ID", strategy.long)
    shortCondition => strategy.entry("Short ID", strategy.short)
Returns
The value of the last expression in the executed local statement block.
Remarks
Only one of local_block instances or default_local_block can be executed. default_local_block is only introduced with the => tag, and is only executed if the preceding block is not executed. If the result of a switch statement is assigned to a variable and default_local_block is not specified, the statement returns na if local_block is not executed. When assigning the result of a switch statement to a variable, all local_block instances must return a value of the same type.
series
series is a keyword that indicates the data series type. It is usually unnecessary to explicitly use the series keyword.
Operator
=
Used to assign values to variables, but only when the variable is declared (first used).
:=
The assignment operator assigns a value to the variable on the left. Used to assign values to previously declared variables.
!=
Not equal to. Applicable to expressions of any type.
expr1 != expr2
Returns
Boolean value, or a sequence of Boolean values.
%
Modulo (integer remainder). Applicable to numerical expressions.
expr1 % expr2
Returns
Integer or float value, or series of values.
Remarks
In Pine Script, when the integer remainder is calculated, the quotient is truncated, i.e. rounded towards the lowest absolute value. The resulting value will have the same sign as the dividend.
Example: -1 % 9 = -1 - 9 * truncate(-1/9) = -1 - 9 * truncate(-0.111) = -1 - 9 * 0 = -1.
%=
Modulo assignment. Applicable to numerical expressions.
expr1 %= expr2
Example
            pine

            // Equals to expr1 = expr1 % expr2.
a = 3
b = 3
a %= b
// Result: a = 0.
plot(a)
Returns
Integer or float value, or series of values.
*
Multiplication assignment. Applicable to numerical expressions.
expr1 * expr2
Returns
Integer or float value, or series of values.
*=
Multiplication assignment. Applicable to numerical expressions.
expr1 *= expr2
Example
            pine

            // Equals to expr1 = expr1 * expr2.
a = 2
b = 3
a *= b
// Result: a = 6.
plot(a)
Returns
Integer or float value, or series of values.
+
Addition or unary plus. Applicable to numerical expressions or strings.
expr1 + expr2
+ expr
Returns
The binary + of the string returns the combination of expr1 and expr2
Number returns an integer or floating point value, or a sequence of values:
Binary '+' returns expr1 plus expr2.
Unary "+" returns expr (nothing is added to unary operator symmetry).
Remarks
You may use arithmetic operators with numbers as well as with series variables. In case of usage with series the operators are applied elementwise.
+=
Additive assignment. Applies to numeric expressions or strings.
expr1 += expr2
Example
            pine

            // Equals to expr1 = expr1 + expr2.
a = 2
b = 3
a += b
// Result: a = 5.
plot(a)
Returns
For strings, returns the concatenation of expr1 and expr2. For numbers, returns an integer or float value, or series of values.
Remarks
You may use arithmetic operators with numbers as well as with series variables. In case of usage with series the operators are applied elementwise.
-
Subtraction or unary minus. Applicable to numerical expressions.
expr1 - expr2
- expr
Returns
Return an integer or floating-point value, or series of values:
Binary '+' returns expr1 minus expr2.
Unary - returns the negation of expr.
Remarks
You may use arithmetic operators with numbers as well as with series variables. In case of usage with series, the operators are applied elementwise.
-=
Subtraction assignment. Applicable to numerical expressions.
expr1 -= expr2
Example
            pine

            // Equals to expr1 = expr1 - expr2.
a = 2
b = 3
a -= b
// Result: a = -1.
plot(a)
Returns
Integer or float value, or series of values.
/
Division assignment. Applicable to numerical expressions.
expr1 / expr2
Returns
Integer or float value, or series of values.
/=
Division assignment. Applicable to numerical expressions.
expr1 /= expr2
Example
            pine

            // Equals to expr1 = expr1 / expr2.
a = 3
b = 3
a /= b
// Result: a = 1.
plot(a)
Returns
Integer or float value, or series of values.
<
Less than. Applicable to numerical expressions.
expr1 < expr2
Returns
Boolean value, or series of boolean values.
<=
Less than or equal to. Applicable to numerical expressions.
expr1 <= expr2
Returns
Boolean value, or series of boolean values.
==
Equal to. Applicable to expressions of any type.
expr1 == expr2
Returns
Boolean value, or series of boolean values.
=>
The '=>' operator is used in user-defined function declarations and in switch statements.
The function declaration grammar is:
            <identifier>([<argument_name>[=<default_value>]], ...) =>
    <local_block>
    <function_result>
A <local_block> is zero or more Pine Script statements.
<function_result> is a variable, an expression, or a tuple.
Example
            pine

            // single-line function
f1(x, y) => x + y
// multi-line function
f2(x, y) =>
    sum = x + y
    sumChange = ta.change(sum, 10)
    // Function automatically returns the last expression used in it
plot(f1(30, 8) + f2(1, 3))
Reamrks
You can learn more about user-defined functions in the User Manual's pages on Declaring functions and Script libraries.
>
Greater than. Applicable to numerical expressions.
expr1 > expr2
Returns
Boolean value, or series of boolean values.
>=
Greater than or equal to. Applicable to numerical expressions.
expr1 >= expr2
Returns
Boolean value, or series of boolean values.
?:
Ternary conditional operator.
expr1 ? expr2 : expr3
Example
            pine

            // Draw circles at the bars where open crosses close
s2 = ta.cross(open, close) ? math.avg(open,close) : na
plot(s2, style=plot.style_circles, linewidth=2, color=color.red)

// Combination of ?: operators for 'switch'-like logic
c = timeframe.isintraday ? color.red : timeframe.isdaily ? color.green : timeframe.isweekly ? color.blue : color.gray
plot(hl2, color=c)
Returns
expr2 if expr1 is evaluated to true, expr3 otherwise. Zero value (0 and also NaN, +Infinity, -Infinity) is considered to be false, any other value is true.
Remarks
Use na for 'else' branch if you do not need it.
You can combine two or more ?: operators to achieve the equivalent of a 'switch'-like statement (see examples above).
You may use arithmetic operators with numbers as well as with series variables. In case of usage with series the operators are applied elementwise.
See also
na
[]
Series subscript. Provides access to previous values of series expr1. expr2 is the number of bars in the past, and it must be numerical. Floats will be rounded down.
expr1[expr2]
Example
            pine

            // [] can be used to "save" variable value between bars
a = 0.0 // declare `a`
a := a[1] // immediately set current value to the same as previous. `na` in the beginning of history
if high == low // if some condition - change `a` value to another
    a := low
plot(a)
Returns
A series of values.
See also
math.floor
and
Logical AND. Applicable to boolean expressions.
expr1 and expr2
Returns
Boolean value, or series of boolean values.
or
Logical OR. Applicable to boolean expressions.
expr1 or expr2
Returns
Boolean value, or series of boolean values.
not
Logical negation (NOT). Applicable to boolean expressions.
not expr1
Returns
Boolean value, or series of boolean values.
Data type keywords
bool
Keyword used to explicitly declare the "bool" (boolean) type of a variable or an argument. "Bool" variables can have values: true, false or na.
Example
            pine

            // bool
bool b = true    // Same as `b = true`
b := na
plot(b ? open : close)
Remarks
Explicitly mentioning the type in a variable declaration is optional, except when it is initialized with na. Learn more about Pine Script types in the User Manual page on the Type System.
See also
var varip int float color string true false
int
Keyword used to explicitly declare the "int" (integer) type of a variable or an argument.
Example
            pine

            // int
int i = 14    // Same as `i = 14`
i := na
plot(i)
Remarks
Explicitly mentioning the type in a variable declaration is optional, except when it is initialized with na. Learn more about Pine Script types in the User Manual page on the Type System.
See also
var varip float bool color string
float
Keyword used to explicitly declare the "float" (floating point) type of a variable or an argument.
Example
            pine

            // float
float f = 3.14    // Same as `f = 3.14`
f := na
plot(f)
Remarks
Explicitly mentioning the type in a variable declaration is optional, except when it is initialized with na.
See also
var varip int bool color string
string
Keyword used to explicitly declare the "string" type of a variable or an argument.
Example
            pine

            // string
string s = "Hello World!"    // Same as `s = "Hello world!"`
// string s = na // same as ""
plot(na, title=s)
Remarks
Explicitly mentioning the type in a variable declaration is optional, except when it is initialized with na. Learn more about Pine Script types in the User Manual page on the Type System.
See also
var varip int float bool str.tostring str.format
color
Keyword used to explicitly declare the "color" type of a variable or an argument.
Example
            pine

            // color
color textColor = color.green
if barstate.islastconfirmedhistory
    runtime.log("test", textcolor = textColor)
Remarks
Color literals have the following format: #RRGGBB or #RRGGBBAA. The letter pairs represent 00 to FF hexadecimal values (0 to 255 in decimal) where RR, GG and BB pairs are the values for the color's red, green and blue components. AA is an optional value for the color's transparency (or alpha component) where 00 is invisible and FF opaque. When no AA pair is supplied, FF is used. The hexadecimal letters can be upper or lower case.
Explicitly mentioning the type in a variable declaration is optional, except when it is initialized with na. Learn more about Pine Script types in the User Manual page on the Type System.
See also
var varip int float string color.rgb color.new
array
Keyword used to explicitly declare the "array" type of a variable or an argument. Array objects (or IDs) can be created with the array.new<type>, array.from function.
Example
            pine

            // array
array<float> a = na
a := array.new<float>(1, close)
plot(array.get(a, 0))
Remarks
Array objects are always of "series" form.
See also
var array.new array.from
Objects
Objects in the PINE language are instances of user-defined types (UDTs), which can be understood as methodless classes that allow users to create custom types in strategies to organize different values in an entity.
Defining types
Let's define an order type to store order information:
            pine

            type order
    float price
    float amount
    string symbol
- Types are declared using the
typekeyword. - The type keyword is followed by the type name.
- The first line type defines the type name, indented four spaces, and defines the fields contained in the type.
- Each field needs to declare its data type, such as int, float, string.
Creating objects
Using the declared type, call the new() function to create an object:
            pine

            order1 = order.new()
            pine

            order1 = order.new(100, 0.1, "BTC_USDT")
            pine

            order1 = order.new(amount = 0.1, symbol = "BTC_USDT", price = 100)
You can also create empty objects:
            pine

            order order1 = na
Let's look at a practical example:
            pine

            type order
    float price
    float amount
    string symbol

if strategy.position_size == 0 and open > close
    strategy.entry("long", strategy.long, 1)

order1 = order.new(strategy.opentrades.entry_price(strategy.opentrades - 1), strategy.opentrades.size(strategy.opentrades - 1), syminfo.ticker)
// runtime.log(order1)   // Output {"data":{"price":46002.8,"amount":1,"symbol":"swap"},"_meta":0,"_type":"order"}
In this example:
            pine

            order1 = order.new(strategy.opentrades.entry_price(strategy.opentrades - 1), strategy.opentrades.size(strategy.opentrades - 1), syminfo.ticker)
It can also be written as:
            pine

            order order1 = na
order1 := order.new(strategy.opentrades.entry_price(strategy.opentrades - 1), strategy.opentrades.size(strategy.opentrades - 1), syminfo.ticker)
Object type for the use of var keyword
            pine

            //@version=5
indicator("Objects using `var` demo")

//@type A custom type to hold index, price, and volume information.
type BarInfo
    int   index = bar_index
    float price = close
    float vol   = volume

//@variable A `BarInfo` instance whose fields persist through all iterations, starting from the first bar.
var BarInfo firstBar = BarInfo.new()
//@variable A `BarInfo` instance declared on every bar.
BarInfo currentBar = BarInfo.new()

// Plot the `index` fields of both instances to compare the difference.
plot(firstBar.index, "firstBar")
plot(currentBar.index, "currentBar")
When you use the var keyword to declare a variable assigned to an object of a user-defined type, the keyword automatically applies to all fields of the object. This means that an object declared via the var keyword will maintain its state between each iteration without the need to reinitialize its field values in each iteration.
- The firstBar object is declared using the var keyword, so its fields (index, price, vol) will retain their values in each iteration, starting from the first entry and ending with the last entry.
- The currentBar object is not declared with the var keyword, so its fields will be reinitialized on each entry and you will have a new object on each iteration.
By plotting the index fields of the two objects, you can compare the differences between them. firstBar.index will maintain the previously set value in each iteration, while currentBar.index will be reinitialized in each iteration to the bar_index value of the current entry.
Object types for use of the varip keyword
            pine

            //@version=5
indicator("Objects using `varip` fields demo")

//@type A custom type that counts the bars and ticks in the script's execution.
type Counter
    int       bars  = 0
    varip int ticks = 0

//@variable A `Counter` object whose reference persists throughout all bars.
var Counter counter = Counter.new()

// Add 1 to the `bars` and `ticks` fields. The `ticks` field is not subject to rollback on unconfirmed bars.
counter.bars  += 1
counter.ticks += 1

// Plot both fields for comparison.
plot(counter.bars, "Bar counter", color.blue, 3)
plot(counter.ticks, "Tick counter", color.purple, 3)
In Pine, the varip keyword is used to indicate that an object's fields persist throughout the script execution and do not roll back on unconfirmed bars.
In the declaration of the Counter type, the bars field does not use the varip keyword, so it rolls back on each unconfirmed bar. The ticks field uses the varip keyword, so it does not roll back on unconfirmed bars.
The counter object is declared using the var keyword, so it persists throughout the script execution.
In each iteration, both the bars field and the ticks field are incremented by 1. The bars field rolls back on each unconfirmed bar, while the ticks field does not roll back.
Finally, by plotting the counter.bars and counter.ticks fields, you can compare the difference between them. The value of counter.bars rolls back on each unconfirmed bar, while the value of counter.ticks continues to increase until the end of the script execution.
Modify field values
            pine

            type order
    float price
    float amount
    string symbol

if strategy.position_size == 0 and open > close
    strategy.entry("long", strategy.long, 1)

order1 = order.new(strategy.opentrades.entry_price(strategy.opentrades - 1), strategy.opentrades.size(strategy.opentrades - 1), syminfo.ticker)

if strategy.position_size != 0
    runtime.log(order1)
    order1.price := 999
    order1.amount := 100
    runtime.log(order1)
    runtime.error("stop")
The value of an object field can be changed using the := reassignment operator.
Object collection
The example declares an empty array that will hold objects of the user-defined order type:
            pine

            type order
    float price
    float amount
    string symbol

arrOrder = array.new<order>()

order1 = order.new(99, 1, "BTC_USDT")
order2 = order.new(100, 2, "ETH_USDT")

array.push(arrOrder, order1)
array.push(arrOrder, order2)

runtime.log(arrOrder)
runtime.error("stop")
or
            pine

            type order
    float price
    float amount
    string symbol

var array<order> arrOrder = na
arrOrder := array.new<order>()

order1 = order.new(99, 1, "BTC_USDT")
order2 = order.new(100, 2, "ETH_USDT")

array.push(arrOrder, order1)
array.push(arrOrder, order2)

runtime.log(arrOrder)
runtime.error("stop")
Copy object
In Pine, objects are assigned by reference. When an existing object is assigned to a new variable, both refer to the same object.
            pine

            //@version=5
indicator("")
type pivotPoint
    int x
    float y
pivot1 = pivotPoint.new()
pivot1.x := 1000
pivot2 = pivot1
pivot2.x := 2000
// Both plot the value 2000.
plot(pivot1.x)
plot(pivot2.x)
In the following example, we create a pivot1 object and set its x field to 1000. We then declare a pivot2 variable that contains a reference to the pivot1 object, so both of them point to the same instance. Therefore, changing pivot2.x also changes pivot1.x, because both refer to the x field of the same object.
To create a copy that is independent of the original object, in this case we can use the built-in copy() method. In this example, we declare the variable pivot2 to refer to the copied instance of the pivot1 object. Now, changing pivot2.x will not change pivot1.x, because it refers to the x field of a separate object:
            pine

            //@version=5
indicator("")
type pivotPoint
    int x
    float y
pivot1 = pivotPoint.new()
pivot1.x := 1000
pivot2 = pivotPoint.copy(pivot1)
pivot2.x := 2000
// Plots 1000 and 2000.
plot(pivot1.x)
plot(pivot2.x)
It should be noted that TradingView's copy method is a shallow copy. If an object has special types of fields (array, etc.), these fields in the shallow copy of the object will point to the same instance as the object.
FMZ platform directly implements deep copying, and no additional processing is required. You can refer to the following example:
Deep copy
            pine

            //@version=5

indicator("test deepCopy")

type orderInfo
    float price
    float amount

type labelInfo
    orderInfo order
    string labelMsg

labelInfo1 = labelInfo.new(orderInfo.new(100, 0.1), "test labelInfo1")
labelInfo2 = labelInfo.copy(labelInfo1)

labelInfo1.labelMsg := "labelInfo1->2"    // Modify the base type field of labelInfo1 to see if it affects labelInfo2
labelInfo1.order.price := 999             // Modify the composite type field of labelInfo1 to see if it affects labelInfo2

runtime.log(labelInfo1)
runtime.log(labelInfo2)
runtime.error("stop")
The test results show that labelInfo.copy(labelInfo1) is a deep copy when executed, and modifying any field of labelInfo1 will not affect labelInfo2.
Methods
Methods in the Pine language are specialized functions associated with a specific instance of a built-in or user-defined type. In most respects, they are essentially the same as regular functions, but provide a shorter, more convenient syntax. Users can access methods directly on variables using dot notation, just like accessing fields of Pine objects. Pine includes built-in methods for all special types, including arrays, matrices, maps, lines, fill lines, and more. These methods provide users with a more concise way to call specialized programs of these types in scripts.
Built-in methods
For example, a script code like this:
            pine

            //@version=5
indicator("Custom Sample BB", overlay = true)

float sourceInput  = input.source(close, "Source")
int   samplesInput = input.int(20, "Samples")
int   n            = input.int(10, "Bars")
float multiplier   = input.float(2.0, "StdDev")

var array<float> sourceArray = array.new<float>(samplesInput)
var float        sampleMean  = na
var float        sampleDev   = na

// Identify if `n` bars have passed.
if bar_index % n == 0
    // Update the queue.
    array.push(sourceArray, sourceInput)
    array.shift(sourceArray)
    // Update the mean and standard deviaiton values.
    sampleMean := array.avg(sourceArray)
    sampleDev  := array.stdev(sourceArray) * multiplier

// Calculate bands.
float highBand = sampleMean + sampleDev
float lowBand  = sampleMean - sampleDev

plot(sampleMean, "Basis", color.orange)
plot(highBand, "Upper", color.lime)
plot(lowBand, "Lower", color.red)
Can be rewritten equivalently as:
            pine

            //@version=5
indicator("Custom Sample BB", overlay = true)

float sourceInput  = input.source(close, "Source")
int   samplesInput = input.int(20, "Samples")
int   n            = input.int(10, "Bars")
float multiplier   = input.float(2.0, "StdDev")

var array<float> sourceArray = array.new<float>(samplesInput)
var float        sampleMean  = na
var float        sampleDev   = na

// Identify if `n` bars have passed.
if bar_index % n == 0
    // Update the queue.
    sourceArray.push(sourceInput)
    sourceArray.shift()
    // Update the mean and standard deviaiton values.
    sampleMean := sourceArray.avg()
    sampleDev  := sourceArray.stdev() * multiplier

// Calculate band values.
float highBand = sampleMean + sampleDev
float lowBand  = sampleMean - sampleDev

plot(sampleMean, "Basis", color.orange)
plot(highBand, "Upper", color.lime)
plot(lowBand, "Lower", color.red)
You can see that after PINE supports Methods, the code array.avg(sourceArray) can be written in the form of methods: sourceArray.avg().
Note that FMZ does not support calls like array.avg currently.
User defined methods
Pine allows users to define custom methods that work with objects of any built-in or user-defined type. Defining a method is essentially the same as defining a function, with two key differences:
- The method keyword must be included before the function name.
- The type of the first parameter of the method must be explicitly declared because it represents the type of object that the method will be associated with.
For example, in the following code, the code for calculating the Bollinger indicator is encapsulated as a user-defined method:
            pine

            //@version=5
indicator("Custom Sample BB", overlay = true)

float sourceInput  = input.source(close, "Source")
int   samplesInput = input.int(20, "Samples")
int   n            = input.int(10, "Bars")
float multiplier   = input.float(2.0, "StdDev")

var array<float> sourceArray = array.new<float>(samplesInput)
var float        sampleMean  = na
var float        sampleDev   = na

// Identify if `n` bars have passed.
if bar_index % n == 0
    // Update the queue.
    sourceArray.push(sourceInput)
    sourceArray.shift()
    // Update the mean and standard deviaiton values.
    sampleMean := sourceArray.avg()
    sampleDev  := sourceArray.stdev() * multiplier

// Calculate band values.
float highBand = sampleMean + sampleDev
float lowBand  = sampleMean - sampleDev

plot(sampleMean, "Basis", color.orange)
plot(highBand, "Upper", color.lime)
plot(lowBand, "Lower", color.red)
Modified to:
            pine

            //@version=5
indicator("Custom Sample BB", overlay = true)

float sourceInput  = input.source(close, "Source")
int   samplesInput = input.int(20, "Samples")
int   n            = input.int(10, "Bars")
float multiplier   = input.float(2.0, "StdDev")

var array<float> sourceArray = array.new<float>(samplesInput)
method maintainQueue(array<float> srcArray, float value, bool takeSample = true) =>
    if takeSample
        srcArray.push(value)
        srcArray.shift()
    srcArray

method calcBB(array<float> srcArray, float mult, bool calculate = true) =>
    var float mean = na
    var float dev  = na
    if calculate
        mean := srcArray.avg()
        dev  := srcArray.stdev() * mult
    [mean, mean + dev, mean - dev]

bool newSample = bar_index % n == 0

[sampleMean, highBand, lowBand] = sourceArray.maintainQueue(sourceInput, newSample).calcBB(multiplier, newSample)

plot(sampleMean, "Basis", color.orange)
plot(highBand, "Upper", color.lime)
plot(lowBand, "Lower", color.red)
You can see that the first parameter in the parameter list of the user-defined methods declared with the keyword method: maintainQueue and calcBB is of type array<float>, which means that the method is a method of a variable of type array<float>, so you can see that the following code is called to calculate the Bollinger indicator.
            pine

            [sampleMean, highBand, lowBand] = sourceArray.maintainQueue(sourceInput, newSample).calcBB(multiplier, newSample)
Methods overloading
User-defined methods can override and overload existing built-in methods and user-defined methods with the same identifier. This feature allows users to define multiple routines associated with different argument signatures under the same method name. As a simple example, suppose we want to define a method to identify the type of a variable. Since we must explicitly specify the object type associated with a user-defined method, we need to define overloads for each type we want it to recognize. Next we define a getType() method that returns a string representation of a variable's type and has overloads for the five basic types:
            pine

            //@version=5
indicator("Type Inspection")

// @function   Identifies an object's type.
// @param this Object to inspect.
// @returns    (string) A string representation of the type.
method getType(int this) =>
    na(this) ? "int(na)" : "int"

method getType(float this) =>
    na(this) ? "float(na)" : "float"

method getType(bool this) =>
    na(this) ? "bool(na)" : "bool"

method getType(color this) =>
    na(this) ? "color(na)" : "color"

method getType(string this) =>
    na(this) ? "string(na)" : "string"

a = 1             // a.getType(): float
b = 1.0           // b.getType(): float
c = true          // c.getType(): bool
d = color.white   // d.getType(): string(na)
e = "1"           // e.getType(): string

runtime.log("a.getType():", a.getType())
runtime.log("b.getType():", b.getType())
runtime.log("c.getType():", c.getType())
runtime.log("d.getType():", d.getType())
runtime.log("e.getType():", e.getType())
runtime.error("stop")
The base type of each variable determines which overload of getType() will be used. On the FMZ platform, since the underlying implementation of PINE scripts is Javascript, the numeric type will be judged as floating point data (float).
Built-in function
When calling a function, you can pass arguments. You can assign argument names to assign values. You can directly pass variables in the corresponding argument positions. Mixed use is also supported. For example:
            pine

            plot(close, title="test plot")     // Pass the argument close directly; specify the argument title and assign the string "test plot"
After specifying the argument name assignment, you can no longer directly pass the variable as an argument, and the subsequent arguments must be written in the form of argument name assignment.
            pine

            // plot(close, title="test", color.red)    // Although the third argument of plot is the color value, but this will report an error
plot(close, title="test", color=color.red) // Correct writing
plot(close, "test", color.red)             // Correct writing
timeframe
timeframe.in_seconds
Convert the time period passed to the timeframe argument into seconds.
timeframe.in_seconds(timeframe)
Example
            pine

            // Get chart timeframe:
i_tf = input.timeframe("1D")

// Convert timeframe to the int value (number of seconds in 1 Day):
tf = timeframe.in_seconds(i_tf)

plot(tf)
Returns
An int representation of the number of seconds in one bar of a timeframe.
Arguments
timeframe(simple string) Timeframe. Optional. The default is timeframe.period.
Remarks
For the timeframe >= '1M' function calculates number of seconds based on 30.4167 (365/12) days in month.
See also
input.timeframe timeframe.period
ticker
ticker.heikinashi
Creates a ticker identifier for requesting a smoothed average int representation value.
ticker.heikinashi(symbol)
Example
            pine

            heikinashi_close = request.security(ticker.heikinashi(syminfo.tickerid), timeframe.period, close)

heikinashi_aapl_60_close = request.security(ticker.heikinashi(syminfo.tickerid), "60", close)
plot(heikinashi_close)
plot(heikinashi_aapl_60_close)
Returns
String value of the stock code that can be supplied to request.security function.
Arguments
symbol(simple string) product code identifier.
See also
syminfo.tickerid syminfo.ticker request.security
request
request.data
Request external data.
request.data(url, attribute)
Example
            pine

            /*backtest
start: 2024-09-01 16:00:00
end: 2024-10-10 08:00:00
period: 1d
basePeriod: 1d
exchanges: [{"eid":"Futures_Binance","currency":"BTC_USDT"}]
args: [["RunMode",1,358374],["ZPrecision",0,358374]]
*/

var chart_data = "https://www.datadata.com/api/v1/query/ebe46218-c5c6-4366-8c72-413694417976/data"
spotPrice = request.data(chart_data, "$.spot_close_price")
futuresPrice = request.data(chart_data, "$.future_close_price")
diff = futuresPrice - spotPrice

plot(diff, "perpetual-spot difference")
plot(futuresPrice, "futures prices", overlay=true)
plot(spotPrice, "spot prices", overlay=true)

if diff > 80 and strategy.position_size >= 0
    runtime.log("diff > 80")
    strategy.entry("Enter Short", strategy.short)
if diff < 60 and strategy.position_size <= 0
    runtime.log("diff < 60")
    strategy.entry("Enter Short", strategy.long)
Return value
The attribute argument specifies the data series.
Arguments
-
url(simple string) The requested data source url and the data format of the data source response must meet the requirements (including at least the time and data attributes):{"data": [], "schema": ["time", "data"]}. You can refer to the data format in the example:json{ "data": [ [1720051200000, "{\"spot_close_price\" : 57050.01, \"future_close_price\" : 57045.9}"], [1720137600000, "{\"spot_close_price\" : 56628.79, \"future_close_price\" : 56604.9}"], // ... ], "schema": ["time", "data"] } -
attribute(simple string) specifies the attribute name and returns the required data. For example:"$.spot_close_price", use$.as the prefix, and the attribute name is consistent with the attribute in the data field in the data in the response when requesting the data source
If an error is prompted, you need to check whether the time range requested by request.data is consistent with the time range set for the backtest. If no data can be queried in the backtest time series, an error will be reported.
The data-data data query SQL statement in this example is:
            sql

            WITH latest_data AS (
    SELECT
        klines.spot_1d.Time AS time,
        CONCAT('{\"spot_close_price\" : ', klines.spot_1d.Close, ', \"future_close_price\" : ', klines.future_1d.Close, '}') AS data
    FROM
        klines.spot_1d
    JOIN
        klines.future_1d
    ON
        klines.spot_1d.Time = klines.future_1d.Time
    WHERE
        klines.spot_1d.Symbol = 'btc_usdt'
    AND
        klines.future_1d.Symbol = 'btc_usdt.swap'
    AND
        klines.spot_1d.Exchange = 'Binance'
    AND
        klines.future_1d.Exchange = 'Binance'
    ORDER BY
        klines.spot_1d.Time DESC
    LIMIT 100
)
SELECT * FROM latest_data
ORDER BY time ASC;
You can query and create data links on the Data Exploration page of the FMZ platform, which is the https://www.datadata.com/api/v1/query/ebe46218-c5c6-4366-8c72-413694417976/data used in the example.
request.security
Ask for another variety/resolution.
request.security(symbol, timeframe, expression, gaps, lookahead, ignore_invalid_symbol, currency)
Example
            pine

            s = request.security(syminfo.tickerid, "D", close) // 1 Day
plot(s)

expr = ta.sma(close, 10)
s1 = request.security(syminfo.tickerid, "240", expr) // 240 Minutes
plot(s1)

// To avoid difference in calculation on history/realtime you can request not latest values and use merge strategy flags as follows:
s2 = request.security(syminfo.tickerid, "D", close[1], barmerge.gaps_off, barmerge.lookahead_on)
plot(s2)
f() => [open, high]
[o, h] = request.security(syminfo.tickerid, "D", f())
[l, c] = request.security(syminfo.tickerid, "D", [low, close])
plot((o + h + l + c) / 4)
            pine

            closePrice = close
runtime.log("syminfo.tickerid:", syminfo.tickerid, ", close:", closePrice)
refSymbol = "SOL_USDT.swap"   // futures
// refSymbol = "SOL_USDT"     // spot
refClose = request.security(str.split(syminfo.tickerid, ":")[0] + ":" + refSymbol, "D", close)
runtime.error(refSymbol + ", close:" + refClose)
Returns
Requested series
Arguments
symbol(simple string) Symbol.timeframe(simple string) Time Period. An empty string is interpreted as the current resolution of the chart.expression(series int/float/bool/color) An expression can be calculated and returned from the request.security call. It can be a series or a tuple containing elements that can be cast to series.gaps(barmerge_gaps) Merge strategy for the requested data (requested data automatically merges with the main series OHLC data). Possible values: barmerge.gaps_on, barmerge.gaps_off. barmerge.gaps_on - requested data is merged with possible gaps (na values). barmerge.gaps_off - requested data is merged continuously without gaps, all the gaps are filled with the previous nearest existing values. Default value is barmerge.gaps_off.lookahead(barmerge_lookahead) Merge strategy for the requested data position. Possible values: barmerge.lookahead_on, barmerge.lookahead_off. Default value is barmerge.lookahead_off starting from version 3. Note that behavour is the same on real-time, and differs only on history.ignore_invalid_symbol(const bool) An optional argument. Determines the behavior of the function if the specified symbol is not found: if false, the script will halt and return a runtime error; if true, the function will return na and execution will continue. The default value is false.currency(simple string) Currency into which the symbol's currency-related values (e.g. OHLC) are to be converted. Theexpressionis then calculated based on the converted values. The conversion rates used are based on the FX_IDC pairs' daily rates of the previous day (relative to the bar where the calculation is done). Optional. The default is syminfo.currency. Possible values: a three-letter string with the currency code in the ISO 4217 format (e.g. "USD") or one of the constants in the currency.* namespace, e.g. currency.USD.
Remarks
PineScript code that uses this function could calculate differently on history and real-time data.
If you want to specify additional arguments for the requested symbol, e.g. session or adjustment type, you can use the ticker.new() function.
It is not possible to pass a spread to this function using the 'ticker' variable. You can use the 'ticker.new' variable or a string representation of the ticker, e.g. "AAPL+MSFT*TSLA".
At the moment, up to 40 request.security calls can be present in a script.
Please note that using this variable/function can cause indicator repainting.
The resolution argument allowable values are:
1S, 5S, 15S, 30S - for seconds intervals (chart resolution should be less than or equal to the requested resolution)
from 1 to 1440 for minutes
from 1D to 365D for days
from 1W to 52W for weeks
from 1M to 12M for months
See also
syminfo.ticker syminfo.tickerid timeframe.period ta.correlation barmerge.lookahead_off barmerge.lookahead_on
str
str.contains
Returns true if the source string contains the str substring, false otherwise.
str.contains(source, str)
Example
            pine

            // If the current chart is a continuous futures chart, e.g "BTC1!", then the function will return true, false otherwise.
var isFutures = str.contains(syminfo.tickerid, "!")
plot(isFutures ? 1 : 0)
Returns
True if the str was found in the source string, false otherwise.
Arguments
source(series string) Source string.str(series string) The substring to search for.
str.endswith
Returns true if the source string ends with the substring specified in str, false otherwise.
str.endswith(source, str)
Returns
True if the source string ends with the substring specified in str, false otherwise.
Arguments
source(series string) Source string.str(series string) The substring to search for.
See also
str.startswith
str.startswith
Returns true if the source string starts with the substring specified in str, false otherwise.
str.startswith(source, str)
Returns
True if the source string starts with the substring specified in str, false otherwise.
Arguments
source(series string) Source string.str(series string) The substring to search for.
See also
str.endswith
str.substring
Returns a new string that is a substring of the source string. The substring begins with the character at the index specified by begin_pos and extends to 'end_pos - 1' of the source string.
str.substring(source, begin_pos)
str.substring(source, begin_pos, end_pos)
Example
            pine

            sym= "EXCHANGE_NAME:SYMBOL_NAME"
pos = str.pos(sym, ":")        // Get position of ":" character
tkr= str.substring(sym, pos+1) // "SYMBOL_NAME"
if barstate.islastconfirmedhistory
    runtime.log(tkr)
Returns
The substring extracted from the source string.
Arguments
source(series string) Source string from which to extract the substring.begin_pos(series int) The beginning position of the extracted substring. It is inclusive (the extracted substring includes the character at that position).end_pos(series int) The ending position. It is exclusive (the extracted string does NOT include that position's character). Optional. The default is the length of thesourcestring.
Remarks
Strings indexing starts from 0. If begin_pos is equal to end_pos, the function returns an empty string.
See also
str.contains str.pos str.match
str.tonumber
str.tonumber(string)
Returns
A float version of the string if it contains a valid number, na otherwise.
Arguments
string(series string) String representation of an int or float.
str.format
Converts the formatting string and value(s) into a formatted string. The formatting string can contain literal text and one placeholder in curly braces {} for each value to be formatted. Each placeholder consists of the index of the required argument (beginning at 0) that will replace it, and an optional format specifier. The index represents the position of that argument in the str.format argument list.
str.format(formatString, arg0, arg1, ...)
Example
            pine

            // The format specifier inside the curly braces accepts certain modifiers:
// - Specify the number of decimals to display:
s1 = str.format("{0,number,#.#}", 1.34) // returns: 1.3
runtime.log(s1)

// - Round a float value to an integer:
s2 = str.format("{0,number,integer}", 1.34) // returns: 1
runtime.log(s2)

// - Display a number in currency:
s3 = str.format("{0,number,currency}", 1.34) // returns: $1.34
runtime.log(s3)

// - Display a number as a percentage:
s4 = str.format("{0,number,percent}", 0.5) // returns: 50%
runtime.log(s4)

// EXAMPLES WITH SEVERAL ARGUMENTS
// returns: Number 1 is not equal to 4
s5 = str.format("Number {0} is not {1} to {2}", 1, "equal", 4)
runtime.log(s5)

// returns: 1.34 != 1.3
s6 = str.format("{0} != {0, number, #.#}", 1.34)
runtime.log(s6)

// returns: 1 is equal to 1, but 2 is equal to 2
s7 = str.format("{0, number, integer} is equal to 1, but {1, number, integer} is equal to 2", 1.34, 1.52)
runtime.log(s7)

// returns: The cash turnover amounted to $1,340,000.00
s8 = str.format("The cash turnover amounted to {0, number, currency}", 1340000)
runtime.log(s8)

// returns: Expected return is 10% - 20%
s9 = str.format("Expected return is {0, number, percent} - {1, number, percent}", 0.1, 0.2)
runtime.log(s9)
Returns
The formatted string.
Arguments
formatString(series string) Format string.arg0, arg1, ...(series int/float/bool/string/na/int[]/float[]/bool[]/string[]) Values to format.
Remarks
Any curly braces within an unquoted pattern must be balanced. For example, "ab {0} de" and "ab '}' de" are valid patterns, but "ab {0'}' de", "ab } de" and "''{''" are not.
str.length
Returns an integer corresponding to the amount of chars in that string.
str.length(string)
Returns
The number of chars in source string.
Arguments
string(series string) Source string.
str.lower
Returns a new string with all letters converted to lowercase.
str.lower(source)
Returns
A new string with all letters converted to lowercase.
Arguments
source(series string) String to be converted.
See also
str.upper
str.upper
Returns a new string with all letters converted to uppercase.
str.upper(source)
Returns
A new string with all letters converted to uppercase.
Arguments
source(series string) String to be converted.
See also
str.lower
str.match
Returns the new substring of the source string if it matches a regex regular expression, 'na' otherwise.
str.match(source, regex)
Example
            pine

            s = input.string("It's time to sell some EXCHANGE_NAME:SYMBOL_NAME!")

// finding first substring that matches regular expression "[\w]+:[\w]+"
var string tickerid = str.match(s, "[\\w]+:[\\w]+")

if barstate.islastconfirmedhistory
    runtime.log(tickerid) // "EXCHANGE_NAME:SYMBOL_NAME"
Returns
The new substring of the source string if it matches a regex regular expression, 'na' otherwise.
Arguments
source(series string) Source string.regex(series string) The regular expression to which this string is to be matched.
Remarks
Function returns first occurrence of the regular expression in the source string.
The backslash "" symbol in the regex string needs to be escaped with additional backslash, e.g. "\d" stands for regular expression "\d".
See also
str.contains str.substring
str.pos
Returns the position of the first occurrence of the str string in the source string, 'na' otherwise.
str.pos(source, str)
Returns
Position of the str string in the source string.
Arguments
source(series string) Source string.str(series string) The substring to search for.
Remarks
Strings indexing starts at 0.
See also
str.contains str.match str.substring
str.replace
Returns a new string with the N+1th occurrence of the target string and the previous occurrence of target string replaced by the replacement string, where N is specified in occurrence. N is the matching index of the target string to be replaced in the source string.
str.replace(source, target, replacement, occurrence)
Example
            pine

            var source = "EXCHANGE1:SYMBOL1 / EXCHANGE1:SYMBOL2"

// Replace first occurrence of "EXCHANGE1" with "EXCHANGE2" replacement string
var newSource = str.replace(source, "EXCHANGE1",  "EXCHANGE2", 0)

if barstate.islastconfirmedhistory
    // Display "EXCHANGE1:SYMBOL1 / EXCHANGE1:SYMBOL2"
    runtime.log(newSource)
Returns
Processed string.
Arguments
source(series string) Source string.target(series string) String to be replaced.replacement(series string) String to be inserted instead of the target string.occurrence(series int) The matching index of the occurrence of the target string to be replaced in the source string Indexing starts at 0 for the first match. Optional. Default value is 0.
See also
str.replace_all str.match
str.replace_all
Replaces each occurrence of the target string in the source string with the replacement string.
str.replace_all(source, target, replacement)
Returns
Processed string.
Arguments
source(series string) Source string.target(series string) String to be replaced.replacement(series string) String to be substituted for each occurrence of target string.
str.split
Divides a string into an array of substrings and returns its array ID.
str.split(string, separator)
Returns
The ID of an array of strings.
Arguments
string(series string) Source string.separator(series string) The string separating each substring.
str.tostring
str.tostring(value)
str.tostring(value, format)
str.tostring(value[])
str.tostring(value[], format)
Returns
The string representation of the value argument.
If the value argument is a string, it is returned as is.
When the value is na, the function returns the string "NaN".
Arguments
value(series int/float/bool/string/int[]/float[]/bool[]/string[]) Value or array ID whose elements are converted to a string.format(series string) Format string. Accepts these format.* constants: format.mintick, format.percent, format.volume. Optional. The default value is '#.##########'.
Remarks
The formatting of float values will also round those values when necessary, e.g. str.tostring(3.99, '#') will return "4".
To display trailing zeros, use '0' instead of '#'. For example, '#.000'.
When using format.mintick, the value will be rounded to the nearest number that can be divided by syminfo.mintick without the remainder. The string is returned with trailing zeroes.
If the x argument is a string, the same string value will be returned.
Bool type arguments return "true" or "false".
When x is na, the function returns "NaN".
color
color.new
Function color applies the specified transparency to the given color.
color.new(color, transp)
Example
            pine

            plot(close, color=color.new(color.red, 50))
Returns
Color with specified transparency.
Arguments
color(series color)transp(series int/float) Possible values are from 0 (not transparent) to 100 (invisible).
Remarks
Using arguments that are not constants (e.g., 'simple', 'input' or 'series') will have an impact on the colors displayed in the script's "Settings/Style" tab. See the User Manual for more information.
color.rgb
Creates a new color with transparency using the RGB color model.
color.rgb(red, green, blue, transp)
Example
            pine

            plot(close, color=color.rgb(255, 0, 0, 50))
Returns
Color with specified transparency.
Arguments
red(series int/float) Red color component. Possible values are from 0 to 255.green(series int/float) Green color component. Possible values are from 0 to 255.blue(series int/float) Blue color component. Possible values are from 0 to 255.transp(series int/float) Optional. Color transparency. Possible values are from 0 (opaque) to 100 (invisible). Default value is 0.
Remarks
Using arguments that are not constants (e.g., "simple", "input" or "series") will have an impact on the colors displayed in the script's "Settings/Style" tab. See the User Manual for more information.
runtime
runtime.debug
Print variable information to the console.
FMZ PINE language specific functions, runtime.debug(value), with only an argument.
runtime.log
Output content in the log.
FMZ PINE language specific functions, runtime.log(1, 2, 3, close, high, ...), you can pass multiple arguments.
runtime.error
When called, causes a runtime error with the error message specified in the message argument.
runtime.error(message)
Arguments
message (series string) Error message.
input
input
Adds an input to the Inputs tab of your script's Settings, which allows you to provide configuration options to script users. This function automatically detects the type of the argument used for "defval" and uses the corresponding input widget.
input(defval, title, tooltip, inline, group)
input(defval, title, inline, group, tooltip)
Example
            pine

            i_switch = input(true, "On/Off")     // Set true, the default is checked.
plot(i_switch ? open : na)

i_len = input(7, "Length")
i_src = input(close, "Source")       // Drop-down box, select close by default.
plot(ta.sma(i_src, i_len))

i_col = input(color.red, "Plot Color")
plot(close, color=i_col)

i_text = input("Hello!", "Message")
runtime.log(i_text)
Returns
Value of input variable.
Arguments
defval(const int/float/bool/string/color or source-type built-ins) Determines the default value of the input variable proposed in the script's "Settings/Inputs" tab, from where script users can change it. Source-type built-ins are built-in series float variables that specify the source of the calculation:close,hlc3, etc.title(const string) Title of the input. If not specified, the variable name is used as the input's title. If the title is specified, but it is empty, the name will be an empty string.tooltip(const string) The string that will be shown to the user when hovering over the tooltip icon.inline(const string) Combines all the input calls using the same argument in one line. The string used as an argument is not displayed. It is only used to identify inputs belonging to the same line.group(const string) Creates a header above all inputs using the same group argument string. The string is also used as the header's text.
Remarks
Result of input function always should be assigned to a variable, see examples above.
See also
input.bool input.color input.int input.float input.string input.timeframe input.source
input.source
Adds an input to the Inputs tab of your script's Settings, which allows you to provide configuration options to script users. This function adds a dropdown that allows the user to select a source for the calculation, e.g. close, hl2, etc. If the script includes only one input.source() call, the user can also select an output from another indicator on their chart as the source.
input.source(defval, title, tooltip, inline, group)
Example
            pine

            i_src = input.source(close, "Source")
plot(i_src)
Returns
Value of input variable.
Arguments
defval(series int/float) Determines the default value of the input variable proposed in the script's "Settings/Inputs" tab, from where the user can change it.title(const string) Title of the input. If not specified, the variable name is used as the input's title. If the title is specified, but it is empty, the name will be an empty string.tooltip(const string) The string that will be shown to the user when hovering over the tooltip icon.inline(const string) Combines all the input calls using the same argument in one line. The string used as an argument is not displayed. It is only used to identify inputs belonging to the same line.group(const string) Creates a header above all inputs using the same group argument string. The string is also used as the header's text.
Remarks
Result of input.source function always should be assigned to a variable, see examples above.
See also
input.bool input.int input.float input.string input.timeframe input.color input
input.string
Adds an input to the Inputs tab of your script's Settings, which allows you to provide configuration options to script users. This function adds a field for a string input to the script's inputs.
input.string(defval, title, options, tooltip, inline, group, confirm)
Example
            pine

            i_text = input.string("Hello!", "Message")
runtime.log(i_text)
Returns
Value of input variable.
Arguments
defval(const string) Determines the default value of the input variable proposed in the script's "Settings/Inputs" tab, from where the user can change it. When a list of values is used with theoptionsargument, the value must be one of them.title(const string) Title of the input. If not specified, the variable name is used as the input's title. If the title is specified, but it is empty, the name will be an empty string.options(List of constants: [<type>...]) A list of options to choose from.tooltip(const string) The string that will be shown to the user when hovering over the tooltip icon.inline(const string) Combines all the input calls using the same argument in one line. The string used as an argument is not displayed. It is only used to identify inputs belonging to the same line.group(const string) Creates a header above all inputs using the same group argument string. The string is also used as the header's text.confirm(const bool) If true, then user will be asked to confirm input value before indicator is added to chart. Default value is false.
Remarks
Result of input.string function always should be assigned to a variable, see examples above.
See also
input.bool input.int input.float input.timeframe input.source input.color input
input.bool
Adds an input to the Inputs tab of your script's Settings, which allows you to provide configuration options to script users. This function adds a checkmark to the script's inputs.
input.bool(defval, title, tooltip, inline, group, confirm)
Example
            pine

            i_switch = input.bool(true, "On/Off")
plot(i_switch ? open : na)
Returns
Value of input variable.
Arguments
defval(const bool) Determines the default value of the input variable proposed in the script's "Settings/Inputs" tab, from where the user can change it.title(const string) Title of the input. If not specified, the variable name is used as the input's title. If the title is specified, but it is empty, the name will be an empty string.tooltip(const string) The string that will be shown to the user when hovering over the tooltip icon.inline(const string) Combines all the input calls using the same argument in one line. The string used as an argument is not displayed. It is only used to identify inputs belonging to the same line.group(const string) Creates a header above all inputs using the same group argument string. The string is also used as the header's text.confirm(const bool) If true, then user will be asked to confirm input value before indicator is added to chart. Default value is false.
Remarks
Result of input.bool function always should be assigned to a variable, see examples above.
See also
input.int input.float input.string input.timeframe input.source input.color input
input.int
Adds an input to the Inputs tab of your script's Settings, which allows you to provide configuration options to script users. This function adds a field for an integer input to the script's inputs.
input.int(defval, title, minval, maxval, step, tooltip, inline, group, confirm)
input.int(defval, title, options, tooltip, inline, group, confirm)
Example
            pine

            i_len1 = input.int(10, "Length 1", minval=5, maxval=21, step=1)
plot(ta.sma(close, i_len1))

i_len2 = input.int(10, "Length 2", options=[5, 10, 21])
plot(ta.sma(close, i_len2))
Returns
Value of input variable.
Arguments
defval(const int) Determines the default value of the input variable proposed in the script's "Settings/Inputs" tab, from where script users can change it. When a list of values is used with theoptionsargument, the value must be one of them.title(const string) Title of the input. If not specified, the variable name is used as the input's title. If the title is specified, but it is empty, the name will be an empty string.minval(const int) Minimal possible value of the input variable. Optional.maxval(const int) Maximum possible value of the input variable. Optional.step(const int) Step value used for incrementing/decrementing the input. Optional. The default is 1.options(tuple of const int values: [val1, val2, ...]) A list of options to choose from a dropdown menu, separated by commas and enclosed in square brackets: [val1, val2, ...]. When using this argument, theminval,maxvalandsteparguments cannot be used.tooltip(const string) The string that will be shown to the user when hovering over the tooltip icon.inline(const string) Combines all the input calls using the same argument in one line. The string used as an argument is not displayed. It is only used to identify inputs belonging to the same line.group(const string) Creates a header above all inputs using the same group argument string. The string is also used as the header's text.confirm(const bool) If true, then user will be asked to confirm input value before indicator is added to chart. Default value is false.
Remarks
Result of input.int function always should be assigned to a variable, see examples above.
See also
input.bool input.float input.string input.timeframe input.source input.color input
input.float
Adds an input to the Inputs tab of your script's Settings, which allows you to provide configuration options to script users. This function adds a field for a float input to the script's inputs.
input.float(defval, title, minval, maxval, step, tooltip, inline, group, confirm)
input.float(defval, title, options, tooltip, inline, group, confirm)
Example
            pine

            i_angle1 = input.float(0.5, "Sin Angle", minval=-3.14, maxval=3.14, step=0.02)
plot(math.sin(i_angle1) > 0 ? close : open, "sin", color=color.green)

i_angle2 = input.float(0, "Cos Angle", options=[-3.14, -1.57, 0, 1.57, 3.14])
plot(math.cos(i_angle2) > 0 ? close : open, "cos", color=color.red)
Returns
Value of input variable.
Arguments
defval(const int/float) Determines the default value of the input variable proposed in the script's "Settings/Inputs" tab, from where script users can change it. When a list of values is used with theoptionsargument, the value must be one of them.title(const string) Title of the input. If not specified, the variable name is used as the input's title. If the title is specified, but it is empty, the name will be an empty string.minval(const int/float) Minimal possible value of the input variable. Optional.maxval(const int/float) Maximum possible value of the input variable. Optional.step(const int/float) Step value used for incrementing/decrementing the input. Optional. The default is 1.options(tuple of const int/float values: [val1, val2, ...]) A list of options to choose from a dropdown menu, separated by commas and enclosed in square brackets: [val1, val2, ...]. When using this argument, theminval,maxvalandsteparguments cannot be used.tooltip(const string) The string that will be shown to the user when hovering over the tooltip icon.inline(const string) Combines all the input calls using the same argument in one line. The string used as an argument is not displayed. It is only used to identify inputs belonging to the same line.group(const string) Creates a header above all inputs using the same group argument string. The string is also used as the header's text.confirm(const bool) If true, then user will be asked to confirm input value before indicator is added to chart. Default value is false.
Remarks
Result of input.float function always should be assigned to a variable, see examples above.
See also
input.bool input.int input.string input.timeframe input.source input.color input
input.color
Adds an input to the Inputs tab of your script's Settings, which allows you to provide configuration options to script users. This function adds a color picker that allows the user to select a color and transparency, either from a palette or a hex value.
input.color(defval, title, tooltip, inline, group, confirm)
Example
            pine

            i_col = input.color(color.red, "Plot Color")
plot(close, color=i_col)
Returns
Value of input variable.
Arguments
defval(const color) Determines the default value of the input variable proposed in the script's "Settings/Inputs" tab, from where the user can change it.title(const string) Title of the input. If not specified, the variable name is used as the input's title. If the title is specified, but it is empty, the name will be an empty string.tooltip(const string) The string that will be shown to the user when hovering over the tooltip icon.inline(const string) Combines all the input calls using the same argument in one line. The string used as an argument is not displayed. It is only used to identify inputs belonging to the same line.group(const string) Creates a header above all inputs using the same group argument string. The string is also used as the header's text.confirm(const bool) If true, then user will be asked to confirm input value before indicator is added to chart. Default value is false.
Remarks
Result of input.color function always should be assigned to a variable, see examples above.
See also
input.bool input.int input.float input.string input.timeframe input.source input
input.price
Adds a price input to the script's "Settings/Inputs" tab. Using confirm = true activates the interactive input mode where a price is selected by clicking on the chart.
input.price(defval, title, tooltip, inline, group, confirm)
Example
            pine

            price1 = input.price(title="Date", defval=42)
plot(price1)

price2 = input.price(54, title="Date")
plot(price2)
Returns
Value of input variable.
Arguments
defval(const int/float) Determines the default value of the input variable proposed in the script's "Settings/Inputs" tab, from where the user can change it.title(const string) Title of the input. If not specified, the variable name is used as the input's title. If the title is specified, but it is empty, the name will be an empty string.tooltip(const string) The string that will be shown to the user when hovering over the tooltip icon.inline(const string) Combines all the input calls using the same argument in one line. The string used as an argument is not displayed. It is only used to identify inputs belonging to the same line.group(const string) Creates a header above all inputs using the same group argument string. The string is also used as the header's text.confirm(const bool) If true, the interactive input mode is enabled and the selection is done by clicking on the chart when the indicator is added to the chart, or by selecting the indicator and moving the selection after that. Optional. The default is false.
Remarks
When using interactive mode, a time input can be combined with a price input if both function calls use the same argument for their inline argument.
See also
input.bool input.int input.float input.string input.resolution input.source input.color input
input.timeframe
Adds an input to the Inputs tab of your script's Settings, which allows you to provide configuration options to script users. This function adds a dropdown that allows the user to select a specific timeframe via the timeframe selector and returns it as a string. The selector includes the custom timeframes a user may have added using the chart's Timeframe dropdown.
input.timeframe(defval, title, options, tooltip, inline, group, confirm)
Example
            pine

            i_res = input.timeframe('D', "Resolution", options=['D', 'W', 'M'])
s = request.security("syminfo.tickerid", i_res, close)
plot(s)
Returns
Value of input variable.
Arguments
defval(const string) Determines the default value of the input variable proposed in the script's "Settings/Inputs" tab, from where the user can change it. When a list of values is used with theoptionsargument, the value must be one of them.title(const string) Title of the input. If not specified, the variable name is used as the input's title. If the title is specified, but it is empty, the name will be an empty string.options(tuple of const string values: [val1, val2, ...]) A list of options to choose from.tooltip(const string) The string that will be shown to the user when hovering over the tooltip icon.inline(const string) Combines all the input calls using the same argument in one line. The string used as an argument is not displayed. It is only used to identify inputs belonging to the same line.group(const string) Creates a header above all inputs using the same group argument string. The string is also used as the header's text.confirm(const bool) If true, then user will be asked to confirm input value before indicator is added to chart. Default value is false.
Remarks
Result of input.timeframe function always should be assigned to a variable, see examples above.
See also
input.bool input.int input.float input.string input.source input.color input
input.integer
Not available.
input.resolution
Not available.
ta
ta.alma
Arnaud Legoux Moving Average. It uses Gaussian distribution as weights for moving average.
ta.alma(series, length, offset, sigma)
ta.alma(series, length, offset, sigma, floor)
Example
            pine

            plot(ta.alma(close, 9, 0.85, 6))

// same on pine, but much less efficient
pine_alma(series, windowsize, offset, sigma) =>
    m = offset * (windowsize - 1)
    //m = math.floor(offset * (windowsize - 1)) // Used as m when math.floor=true
    s = windowsize / sigma
    norm = 0.0
    sum = 0.0
    for i = 0 to windowsize - 1
        weight = math.exp(-1 * math.pow(i - m, 2) / (2 * math.pow(s, 2)))
        norm := norm + weight
        sum := sum + series[windowsize - i - 1] * weight
    sum / norm
plot(pine_alma(close, 9, 0.85, 6))
Returns
Arnaud Legoux Moving Average.
Arguments
series(series int/float) Series of values to process.length(series int) Number of bars (length).offset(simple int/float) Controls tradeoff between smoothness (closer to 1) and responsiveness (closer to 0).sigma(simple int/float) Changes the smoothness of ALMA. The larger sigma the smoother ALMA.floor(simple bool) An optional argument. Specifies whether the offset calculation is floored before ALMA is calculated. Default value is false.
See also
ta.sma ta.ema ta.rma ta.wma ta.vwma ta.swma
ta.sma
The sma function returns the moving average, that is the sum of last y values of x, divided by y.
ta.sma(source, length)
Example
            pine

            plot(ta.sma(close, 15))

// same on pine, but much less efficient
pine_sma(x, y) =>
    sum = 0.0
    for i = 0 to y - 1
        sum := sum + x[i] / y
    sum
plot(pine_sma(close, 15))
Returns
Simple moving average of source for length bars back.
Arguments
source(series int/float) Series of values to process.length(series int) Number of bars (length).
See also
ta.ema ta.rma ta.wma ta.vwma ta.swma ta.alma
ta.cog
The cog (center of gravity) is an indicator based on statistics and the Fibonacci golden ratio.
ta.cog(source, length)
Example
            pine

            plot(ta.cog(close, 10))

// the same on pine
pine_cog(source, length) =>
    sum = math.sum(source, length)
    num = 0.0
    for i = 0 to length - 1
        price = source[i]
        num := num + price * (i + 1)
    -num / sum

plot(pine_cog(close, 10))
Returns
Center of Gravity.
Arguments
source(series int/float) Series of values to process.length(series int) Number of bars (length).
See also
ta.stoch
ta.dev
Measure of difference between the series and it's ta.sma
ta.dev(source, length)
Example
            pine

            plot(ta.dev(close, 10))

// the same on pine
pine_dev(source, length) =>
    mean = ta.sma(source, length)
    sum = 0.0
    for i = 0 to length - 1
        val = source[i]
        sum := sum + math.abs(val - mean)
    dev = sum/length
plot(pine_dev(close, 10))
Returns
Deviation of source for length bars back.
Arguments
source(series int/float) Series of values to process.length(series int) Number of bars (length).
See also
ta.variance ta.stdev
ta.stdev
ta.stdev(source, length, biased)
Example
            pine

            plot(ta.stdev(close, 5))

//the same on pine
isZero(val, eps) => math.abs(val) <= eps

SUM(fst, snd) =>
    EPS = 1e-10
    res = fst + snd
    if isZero(res, EPS)
        res := 0
    else
        if not isZero(res, 1e-4)
            res := res
        else
            15

pine_stdev(src, length) =>
    avg = ta.sma(src, length)
    sumOfSquareDeviations = 0.0
    for i = 0 to length - 1
        sum = SUM(src[i], -avg)
        sumOfSquareDeviations := sumOfSquareDeviations + sum * sum

    stdev = math.sqrt(sumOfSquareDeviations / length)
plot(pine_stdev(close, 5))
Returns
Standard deviation.
Arguments
source(series int/float) Series of values to process.length(series int) Number of bars (length).biased(series bool) Determines which estimate should be used. Optional. The default is true.
Remarks
If biased is true, function will calculate using a biased estimate of the entire population, if false - unbiased estimate of a sample.
See also
ta.dev ta.variance
ta.ema
The ema function returns the exponentially weighted moving average. In ema weighting factors decrease exponentially. It calculates by using a formula: EMA = alpha * source + (1 - alpha) * EMA[1], where alpha = 2 / (length + 1).
ta.ema(source, length)
Example
            pine

            plot(ta.ema(close, 15))

//the same on pine
pine_ema(src, length) =>
    alpha = 2 / (length + 1)
    sum = 0.0
    sum := na(sum[1]) ? src : alpha * src + (1 - alpha) * nz(sum[1])
plot(pine_ema(close,15))
Returns
Exponential moving average of source with alpha = 2 / (length + 1).
Arguments
source(series int/float) Series of values to process.length(simple int) Number of bars (length).
Remarks
Please note that using this variable/function can cause indicator repainting.
See also
ta.sma ta.rma ta.wma ta.vwma ta.swma ta.alma
ta.wma
The wma function returns weighted moving average of source for length bars back. In wma weighting factors decrease in arithmetical progression.
ta.wma(source, length)
Example
            pine

            plot(ta.wma(close, 15))

// same on pine, but much less efficient
pine_wma(x, y) =>
    norm = 0.0
    sum = 0.0
    for i = 0 to y - 1
        weight = (y - i) * y
        norm := norm + weight
        sum := sum + x[i] * weight
    sum / norm
plot(pine_wma(close, 15))
Returns
Weighted moving average of source for length bars back.
Arguments
source(series int/float) Series of values to process.length(series int) Number of bars (length).
See also
ta.sma ta.ema ta.rma ta.vwma ta.swma ta.alma
ta.swma
Symmetrically weighted moving average with fixed length: 4. Weights: [1/6, 2/6, 2/6, 1/6].
ta.swma(source)
Example
            pine

            plot(ta.swma(close))

// same on pine, but less efficient
pine_swma(x) =>
    x[3] * 1 / 6 + x[2] * 2 / 6 + x[1] * 2 / 6 + x[0] * 1 / 6
plot(pine_swma(close))
Returns
Symmetrically weighted moving average.
Arguments
source(series int/float) Source series.
See also
ta.sma ta.ema ta.rma ta.wma ta.vwma ta.alma
ta.hma
The hma function returns the Hull Moving Average.
ta.hma(source, length)
Example
            pine

            src = input(defval=close, title="Source")
length = input(defval=9, title="Length")
hmaBuildIn = ta.hma(src, length)
plot(hmaBuildIn, title="Hull MA", color=#674EA7)
Returns
Hull moving average of 'source' for 'length' bars back.
Arguments
source(series int/float) Series of values to process.length(simple int) Number of bars.
See also
ta.ema ta.rma ta.wma ta.vwma ta.sma
ta.rma
Moving average used in RSI. It is the exponentially weighted moving average with alpha = 1 / length.
ta.rma(source, length)
Example
            pine

            plot(ta.rma(close, 15))

//the same on pine
pine_rma(src, length) =>
  alpha = 1/length
  sum = 0.0
  sum := na(sum[1]) ? ta.sma(src, length) : alpha * src + (1 - alpha) * nz(sum[1])
plot(pine_rma(close, 15))
Returns
Exponential moving average of source with alpha = 1 / length.
Arguments
source(series int/float) Series of values to process.length(simple int) Number of bars (length).
See also
ta.sma ta.ema ta.wma ta.vwma ta.swma ta.alma ta.rsi
ta.rsi
Relative strength index. It is calculated using the ta.rma() of upward and downward changes of source over the last length bars.
ta.rsi(source, length)
Example
            pine

            plot(ta.rsi(close, 7))

// same on pine, but less efficient
pine_rsi(x, y) =>
    u = math.max(x - x[1], 0) // upward ta.change
    d = math.max(x[1] - x, 0) // downward ta.change
    rs = ta.rma(u, y) / ta.rma(d, y)
    res = 100 - 100 / (1 + rs)
    res

plot(pine_rsi(close, 7))
Returns
Relative strength index.(RSI)
Arguments
source(series int/float) Series of values to process.length(simple int) Number of bars (length).
See also
ta.rma
ta.tsi
True strength index. It uses moving averages of the underlying momentum of a financial instrument.
ta.tsi(source, short_length, long_length)
Returns
True strength index. A value in range [-1, 1].
Arguments
source(series int/float) Source series.short_length(simple int) Short length.long_length(simple int) Long length.
ta.roc
Function roc (rate of change) showing the difference between current value of source and the value of source that was length days ago.
It is calculated by the formula: 100 * change(src, length) / src[length].
ta.roc(source, length)
Returns
The rate of change of source for length bars back.
Arguments
source(series int/float) Series of values to process.length(series int) Number of bars (length).
ta.range
Returns the difference between the min and max values in a series.
ta.range(source, length)
Returns
The difference between the min and max values in the series.
Arguments
source(series int/float) Series of values to process.length(series int) Number of bars (length).
ta.macd
MACD (moving average convergence/divergence). It is supposed to reveal changes in the strength, direction, momentum, and duration of a trend in a stock's price.
ta.macd(source, fastlen, slowlen, siglen)
Example
            pine

            [macdLine, signalLine, histLine] = ta.macd(close, 12, 26, 9)
plot(macdLine, color=color.blue)
plot(signalLine, color=color.orange)
plot(histLine, color=color.red, style=plot.style_histogram)
If you need only one value, use placeholders '_' like this:
Example
            pine

            [_, signalLine, _] = ta.macd(close, 12, 26, 9)
plot(signalLine, color=color.orange)
Returns
Tuple of three MACD series: MACD line, signal line and histogram line.
Arguments
source(series int/float) Series of values to process.fastlen(simple int) Fast Length argument.slowlen(simple int) Slow Length argument.siglen(simple int) Signal Length argument.
ta.mode
Returns the mode of the series. If there are several values with the same frequency, it returns the smallest value.
ta.mode(source, length)
Returns
The mode of the series.
Arguments
source(series int/float) Series of values to process.length(series int) Number of bars (length).
ta.median
Returns the median of the series.
ta.median(source, length)
Returns
The median of the series.
Arguments
source(series int/float) Series of values to process.length(series int) Number of bars (length).
ta.linreg
Linear regression curve. A line that best fits the prices specified over a user-defined time period. It is calculated using the least squares method. The result of this function is calculated using the formula: linreg = intercept + slope * (length - 1 - offset), where intercept and slope are the values calculated with the least squares method on source series.
ta.linreg(source, length, offset)
Returns
Linear regression curve.
Arguments
source(series int/float) Source series.length(series int)offset(simple int) Offset.
ta.bb
Bollinger Bands. A Bollinger Band is a technical analysis tool defined by a set of lines plotted two standard deviations (positively and negatively) away from a simple moving average (SMA) of the security's price, but can be adjusted to user preferences.
ta.bb(series, length, mult)
Example
            pine

            [middle, upper, lower] = ta.bb(close, 5, 4)
plot(middle, color=color.yellow)
plot(upper, color=color.yellow)
plot(lower, color=color.yellow)

// the same on pine
f_bb(src, length, mult) =>
    float basis = ta.sma(src, length)
    float dev = mult * ta.stdev(src, length)
    [basis, basis + dev, basis - dev]

[pineMiddle, pineUpper, pineLower] = f_bb(close, 5, 4)

plot(pineMiddle)
plot(pineUpper)
plot(pineLower)
Returns
Bollinger Bands.
Arguments
series(series int/float) Series of values to process.length(series int) Number of bars (length).mult(simple int/float) Standard deviation factor.
See also
ta.sma ta.stdev ta.kc
ta.bbw
Bollinger Bands Width. The Bollinger Band Width is the difference between the upper and the lower Bollinger Bands divided by the middle band.
ta.bbw(series, length, mult)
Example
            pine

            plot(ta.bbw(close, 5, 4), color=color.yellow)

// the same on pine
f_bbw(src, length, mult) =>
    float basis = ta.sma(src, length)
    float dev = mult * ta.stdev(src, length)
    ((basis + dev) - (basis - dev)) / basis

plot(f_bbw(close, 5, 4))
Returns
Bollinger Bands Width.
Arguments
series(series int/float) Series of values to process.length(series int) Number of bars (length).mult(simple int/float) Standard deviation factor.
See also
ta.bb ta.sma ta.stdev
ta.cci
The CCI (commodity channel index) is calculated as the difference between the typical price of a commodity and its simple moving average, divided by the mean absolute deviation of the typical price. The index is scaled by an inverse factor of 0.015 to provide more readable numbers.
ta.cci(source, length)
Returns
Commodity channel index of source for length bars back.
Arguments
source(series int/float) Series of values to process.length(series int) Number of bars (length).
ta.change
The difference between the current value and the previous value, source - source [length].
ta.change(source, length)
ta.change(source)
Returns
The result of subtraction.
Arguments
source(series int/float) Source series.length(series int) Offset from the current bar to the previous bar. Optional, if not given, length=1 is used.
ta.mom
Momentum of source price and source price length bars ago. This is simply a difference: source - source[length].
ta.mom(source, length)
Returns
Momentum of source price and source price length bars ago.
Arguments
source(series int/float) Series of values to process.length(series int) Offset from the current bar to the previous bar.
See also
ta.change
ta.cmo
Chande Momentum Oscillator. Calculates the difference between the sum of recent gains and the sum of recent losses and then divides the result by the sum of all price movement over the same period.
ta.cmo(series, length)
Example
            pine

            plot(ta.cmo(close, 5), color=color.yellow)

// the same on pine
f_cmo(src, length) =>
    float mom = ta.change(src)
    float sm1 = math.sum((mom >= 0) ? mom : 0.0, length)
    float sm2 = math.sum((mom >= 0) ? 0.0 : -mom, length)
    100 * (sm1 - sm2) / (sm1 + sm2)

plot(f_cmo(close, 5))
Returns
Chande Momentum Oscillator.
Arguments
series(series int/float) Series of values to process.length(series int) Number of bars (length).
See also
ta.rsi ta.stoch math.sum
ta.percentile_linear_interpolation
Calculates percentile using method of linear interpolation between the two nearest ranks.
ta.percentile_linear_interpolation(source, length, percentage)
Returns
P-th percentile of source series for length bars back.
Arguments
source(series int/float) Series of values to process (source).length(series int) Number of bars back (length).percentage(simple int/float) Percentage, a number from range 0..100.
Remarks
Note that a percentile calculated using this method will NOT always be a member of the input data set.
See also
ta.percentile_nearest_rank
ta.percentile_nearest_rank
Calculates percentile using method of Nearest Rank.
ta.percentile_nearest_rank(source, length, percentage)
Returns
P-th percentile of source series for length bars back.
Arguments
source(series int/float) Series of values to process (source).length(series int) Number of bars back (length).percentage(simple int/float) Percentage, a number from range 0..100.
Remarks
Using the Nearest Rank method on lengths less than 100 bars back can result in the same number being used for more than one percentile.
A percentile calculated using the Nearest Rank method will always be a member of the input data set.
The 100th percentile is defined to be the largest value in the input data set.
See also
ta.percentile_linear_interpolation
ta.percentrank
Percent rank is the percents of how many previous values was less than or equal to the current value of given series.
ta.percentrank(source, length)
Returns
Percent rank of source for length bars back.
Arguments
source(series int/float) Series of values to process.length(series int) Number of bars (length).
ta.variance
Variance is the expectation of the squared deviation of a series from its mean (ta.sma), and it informally measures how far a set of numbers are spread out from their mean.
ta.variance(source, length, biased)
Returns
Variance of source for length bars back.
Arguments
source(series int/float) Series of values to process.length(series int) Number of bars (length).biased(series bool) Determines which estimate should be used. Optional. The default is true.
Remarks
If biased is true, function will calculate using a biased estimate of the entire population, if false - unbiased estimate of a sample.
ta.tr
ta.tr(handle_na)
Returns
True range. It is math.max(high - low, math.abs(high - close[1]), math.abs(low - close[1])).
Arguments
handle_na(simple bool) How NaN values are handled. if true, and previous day's close is NaN then tr would be calculated as current day high-low. Otherwise (if false) tr would return NaN in such cases. Also note, that ta.atr uses ta.tr(true).
Remarks
ta.tr(false) is exactly the same as ta.tr.
See also
ta.atr
ta.mfi
Money Flow Index. The Money Flow Index (MFI) is a technical oscillator that uses price and volume for identifying overbought or oversold conditions in an asset.
ta.mfi(series, length)
Example
            pine

            plot(ta.mfi(hlc3, 14), color=color.yellow)

// the same on pine
pine_mfi(src, length) =>
    float upper = math.sum(volume * (ta.change(src) <= 0.0 ? 0.0 : src), length)
    float lower = math.sum(volume * (ta.change(src) >= 0.0 ? 0.0 : src), length)
    mfi = 100.0 - (100.0 / (1.0 + upper / lower))
    mfi

plot(pine_mfi(hlc3, 14))
Returns
Money Flow Index.
Arguments
series(series int/float) Series of values to process.length(series int) Number of bars (length).
ta.kc
Keltner Channels. Keltner channel is a technical analysis indicator showing a central moving average line plus channel lines at a distance above and below.
ta.kc(series, length, mult)
ta.kc(series, length, mult, useTrueRange)
Example
            pine

            [middle, upper, lower] = ta.kc(close, 5, 4)
plot(middle, color=color.yellow)
plot(upper, color=color.yellow)
plot(lower, color=color.yellow)


// the same on pine
f_kc(src, length, mult, useTrueRange) =>
    float basis = ta.ema(src, length)
    float span = (useTrueRange) ? ta.tr : (high - low)
    float rangeEma = ta.ema(span, length)
    [basis, basis + rangeEma * mult, basis - rangeEma * mult]

[pineMiddle, pineUpper, pineLower] = f_kc(close, 5, 4, true)

plot(pineMiddle)
plot(pineUpper)
plot(pineLower)
Returns
Keltner Channels.
Arguments
series(series int/float) Series of values to process.length(simple int) Number of bars (length).mult(simple int/float) Standard deviation factor.useTrueRange(simple bool) An optional argument. Specifies if True Range is used; default is true. If the value is false, the range will be calculated with the expression (high - low).
ta.kcw
Keltner Channels Width. The Keltner Channels Width is the difference between the upper and the lower Keltner Channels divided by the middle channel.
ta.kcw(series, length, mult)
ta.kcw(series, length, mult, useTrueRange)
Example
            pine

            plot(ta.kcw(close, 5, 4), color=color.yellow)

// the same on pine
f_kcw(src, length, mult, useTrueRange) =>
    float basis = ta.ema(src, length)
    float span = (useTrueRange) ? ta.tr : (high - low)
    float rangeEma = ta.ema(span, length)

    ((basis + rangeEma * mult) - (basis - rangeEma * mult)) / basis

plot(f_kcw(close, 5, 4, true))
Returns
Keltner Channels Width.
Arguments
series(series int/float) Series of values to process.length(simple int) Number of bars (length).mult(simple int/float) Standard deviation factor.useTrueRange(simple bool) An optional argument. Specifies if True Range is used; default is true. If the value is false, the range will be calculated with the expression (high - low).
See also
ta.kc ta.ema ta.atr ta.bb
ta.correlation
Correlation coefficient. Describes the degree to which two series tend to deviate from their ta.sma values.
ta.correlation(source1, source2, length)
Returns
Correlation coefficient.
Arguments
source1(series int/float) Source series.source2(series int/float) Target series.length(series int) Length (number of bars back).
See also
request.security
ta.cross
ta.cross(source1, source2)
Returns
true if two series have crossed each other, otherwise false.
Arguments
source1(series int/float) First data series.source2(series int/float) Second data series.
See also
ta.change
ta.crossover
The source1-series is defined as having crossed over source2 -series if, on the current bar, the value of source1 is greater than the value of source2, and on the previous bar, the value of source1 was less than the value of source2.
ta.crossover(source1, source2)
Returns
true if source1 crossed over source2 otherwise false.
Arguments
source1(series int/float) First data series.source2(series int/float) Second data series.
ta.crossunder
The source1 -series is defined as having crossed under source2 -series if, on the current bar, the value of source1 is less than the value of source2, and on the previous bar, the value of source1 was greater than the value of source2.
ta.crossunder(source1, source2)
Returns
true if source1 crossed under source2 otherwise false.
Arguments
source1(series int/float) First data series.source2(series int/float) Second data series.
ta.atr
Function atr (average true range) returns the RMA of true range. True range is max(high - low, abs(high - close[1]), abs(low - close[1])).
ta.atr(length)
Example
            pine

            plot(ta.atr(14))

//the same on pine
pine_atr(length) =>
    trueRange = na(high[1])? high-low : math.max(math.max(high - low, math.abs(high - close[1])), math.abs(low - close[1]))
    //true range can be also calculated with ta.tr(true)
    ta.rma(trueRange, length)

plot(pine_atr(14))
Returns
Average true range. (ATR)
Arguments
length (simple int) Length (number of bars back).
ta.sar
Parabolic SAR (parabolic stop and reverse) is a method devised by J. Welles Wilder, Jr., to find potential reversals in the market price direction of traded goods.
ta.sar(start, inc, max)
Example
            pine

            plot(ta.sar(0.02, 0.02, 0.2), style=plot.style_cross, linewidth=3)

// The same on Pine
pine_sar(start, inc, max) =>
  var float result = na
  var float maxMin = na
  var float acceleration = na
  var bool isBelow = na
  bool isFirstTrendBar = false

  if bar_index == 1
    if close > close[1]
      isBelow := true
      maxMin := high
      result := low[1]
    else
      isBelow := false
      maxMin := low
      result := high[1]
    isFirstTrendBar := true
    acceleration := start

  result := result + acceleration * (maxMin - result)

  if isBelow
    if result > low
      isFirstTrendBar := true
      isBelow := false
      result := math.max(high, maxMin)
      maxMin := low
      acceleration := start
  else
    if result < high
      isFirstTrendBar := true
      isBelow := true
      result := math.min(low, maxMin)
      maxMin := high
      acceleration := start

  if not isFirstTrendBar
    if isBelow
      if high > maxMin
        maxMin := high
        acceleration := math.min(acceleration + inc, max)
    else
      if low < maxMin
        maxMin := low
        acceleration := math.min(acceleration + inc, max)

  if isBelow
    result := math.min(result, low[1])
    if bar_index > 1
      result := math.min(result, low[2])

  else
    result := math.max(result, high[1])
    if bar_index > 1
      result := math.max(result, high[2])

  result

plot(pine_sar(0.02, 0.02, 0.2), style=plot.style_cross, linewidth=3)
Returns
Parabolic SAR.
Arguments
start(simple int/float) Start.inc(simple int/float) Increment.max(simple int/float) Maximum.
ta.barssince
Counts the number of bars since the last time the condition was true.
ta.barssince(condition)
Example
            pine

            // get number of bars since last color.green bar
plot(ta.barssince(close >= open))
Returns
Number of bars since condition was true.
Remarks
If the condition has never been met prior to the current bar, the function returns na.
Please note that using this variable/function can cause indicator repainting.
See also
ta.lowestbars ta.highestbars ta.valuewhen ta.highest ta.lowest
ta.cum
Cumulative (total) sum of source. In other words it's a sum of all elements of source.
ta.cum(source)
Returns
Total sum series.
Arguments
source(series int/float)
See also
math.sum
ta.dmi
The dmi function returns the directional movement index(DMI).
ta.dmi(diLength, adxSmoothing)
Example
            pine

            len = input.int(17, minval=1, title="DI Length")
lensig = input.int(14, title="ADX Smoothing", minval=1, maxval=50)
[diplus, diminus, adx] = ta.dmi(len, lensig)
plot(adx, color=color.red, title="ADX")
plot(diplus, color=color.blue, title="+DI")
plot(diminus, color=color.orange, title="-DI")
Returns
Tuple of three DMI series: Positive Directional Movement (+DI), Negative Directional Movement (-DI) and Average Directional Movement Index (ADX).
Arguments
diLength(simple int) DI Period.adxSmoothing(simple int) ADX Smoothing Period.
ta.falling
Test if the source series is now falling for length bars long.
ta.falling(source, length)
Returns
true if current source value is less than any previous source value for length bars back, false otherwise.
Arguments
source(series int/float) Series of values to process.length(series int) Number of bars (length).
See also
ta.rising
ta.rising
Test if the source series is now rising for length bars long.
ta.rising(source, length)
Returns
true if current source is greater than any previous source for length bars back, false otherwise.
Arguments
source(series int/float) Series of values to process.length(series int) Number of bars (length).
See also
ta.falling
ta.pivothigh
This function returns price of the pivot high point. It returns 'NaN', if there was no pivot high point.
ta.pivothigh(source, leftbars, rightbars)
ta.pivothigh(leftbars, rightbars)
Example
            pine

            leftBars = input(2)
rightBars=input(2)
ph = ta.pivothigh(leftBars, rightBars)
plot(ph, style=plot.style_cross, linewidth=3, color= color.red, offset=-rightBars)
Returns
Price of the point or 'NaN'.
Arguments
source(series int/float) An optional argument. Data series to calculate the value. 'High' by default.leftbars(series int/float) Left strength.rightbars(series int/float) Right length.
Remarks
If arguments 'leftbars' or 'rightbars' are series you should use max_bars_back function for the 'source' variable.
ta.pivotlow
This function returns price of the pivot low point. It returns 'NaN', if there was no pivot low point.
ta.pivotlow(source, leftbars, rightbars)
ta.pivotlow(leftbars, rightbars)
Example
            pine

            leftBars = input(2)
rightBars=input(2)
pl = ta.pivotlow(close, leftBars, rightBars)
plot(pl, style=plot.style_cross, linewidth=3, color= color.blue, offset=-rightBars)
Returns
Price of the point or 'NaN'.
Arguments
source(series int/float) An optional argument. Data series to calculate the value. "Low" by default.leftbars(series int/float) Left strength.rightbars(series int/float) Right length.
Remarks
If arguments 'leftbars' or 'rightbars' are series you should use max_bars_back function for the 'source' variable.
ta.highest
Highest value for a given number of bars back.
ta.highest(source, length)
ta.highest(length)
Returns
Highest value in the series.
Arguments
source(series int/float) Series of values to process.length(series int) Number of bars (length).
Remarks
Two args version: source is a series and length is the number of bars back.
One arg version: length is the number of bars back. Algorithm uses high as a source series.
See also
ta.lowest ta.lowestbars ta.highestbars ta.valuewhen ta.barssince
ta.highestbars
Highest value offset for a given number of bars back.
ta.highestbars(source, length)
ta.highestbars(length)
Returns
Offset to the highest bar.
Arguments
source(series int/float) Series of values to process.length(series int) Number of bars (length).
Remarks
Two args version: source is a series and length is the number of bars back.
One arg version: length is the number of bars back. Algorithm uses high as a source series.
See also
ta.lowest ta.highest ta.lowestbars ta.barssince ta.valuewhen
ta.stoch
Stochastic. It is calculated by a formula: 100 * (close - lowest(low, length)) / (highest(high, length) - lowest(low, length)).
ta.stoch(source, high, low, length)
Returns
Stochastic.
Arguments
source(series int/float) Source series.high(series int/float) Series of high.low(series int/float) Series of low.length(series int) Length (number of bars back).
See also
ta.cog
ta.supertrend
The Supertrend Indicator. The Supertrend is a trend following indicator.
ta.supertrend(factor, atrPeriod)
Example
            pine

            //@version=5
indicator("Pine Script™ Supertrend")

[supertrend, direction] = ta.supertrend(3, 10)
plot(direction < 0 ? supertrend : na, "Up direction", color = color.green, style=plot.style_linebr)
plot(direction > 0 ? supertrend : na, "Down direction", color = color.red, style=plot.style_linebr)

// The same on Pine Script™
pine_supertrend(factor, atrPeriod) =>
  src = hl2
  atr = ta.atr(atrPeriod)
  upperBand = src + factor * atr
  lowerBand = src - factor * atr
  prevLowerBand = nz(lowerBand[1])
  prevUpperBand = nz(upperBand[1])

  lowerBand := lowerBand > prevLowerBand or close[1] < prevLowerBand ? lowerBand : prevLowerBand
  upperBand := upperBand < prevUpperBand or close[1] > prevUpperBand ? upperBand : prevUpperBand
  int direction = na
  float superTrend = na
  prevSuperTrend = superTrend[1]
  if na(atr[1])
    direction := 1
  else if prevSuperTrend == prevUpperBand
    direction := close > upperBand ? -1 : 1
  else
    direction := close < lowerBand ? 1 : -1
  superTrend := direction == -1 ? lowerBand : upperBand
  [superTrend, direction]

[pineSupertrend, pineDirection] = pine_supertrend(3, 10)
plot(pineDirection < 0 ? pineSupertrend : na, "Up direction", color = color.green, style=plot.style_linebr)
plot(pineDirection > 0 ? pineSupertrend : na, "Down direction", color = color.red, style=plot.style_linebr)
Returns
Tuple of two supertrend series: supertrend line and direction of trend. Possible values are 1 (down direction) and -1 (up direction).
Arguments
factor(series int/float) The multiplier by which the ATR will get multiplied.atrPeriod(simple int) Length of ATR
See also
ta.macd
ta.lowest
Lowest value for a given number of bars back.
ta.lowest(source, length)
ta.lowest(length)
Returns
Lowest value in the series.
Arguments
source(series int/float) Series of values to process.length(series int) Number of bars (length).
Remarks
Two args version: source is a series and length is the number of bars back.
One arg version: length is the number of bars back. Algorithm uses low as a source series.
See also
ta.highest ta.lowestbars ta.highestbars ta.valuewhen ta.barssince
ta.lowestbars
Lowest value offset for a given number of bars back.
ta.lowestbars(source, length)
ta.lowestbars(length)
Returns
Offset to the lowest bar.
Arguments
source(series int/float) Series of values to process.length(series int) Number of bars back.
Remarks
Two args version: source is a series and length is the number of bars back.
One arg version: length is the number of bars back. Algorithm uses low as a source series.
See also
ta.lowest ta.highest ta.highestbars ta.barssince ta.valuewhen
ta.valuewhen
Returns the value of the "source" series on the bar where the "condition" was true on the nth most recent occurrence.
ta.valuewhen(condition, source, occurrence)
Example
            pine

            slow = ta.sma(close, 7)
fast = ta.sma(close, 14)
// Get value of `close` on second most recent cross
plot(ta.valuewhen(ta.cross(slow, fast), close, 1))
Arguments
condition(series bool) The condition to search for.source(series int/float/bool/color) The value to be returned from the bar where the condition is met.occurrence(simple int) The occurrence of the condition. The numbering starts from 0 and goes back in time, so "0" is the most recent occurrence of "condition", "1" is the second most recent and so forth. Must be an integer >= 0.
Remarks
This function requires execution on every bar. It is not recommended to use it inside a for or while loop structure, where its behavior can be unexpected. Please note that using this function can cause indicator repainting.
See also
ta.lowestbars ta.highestbars ta.barssince ta.highest ta.lowest
ta.vwap
Volume weighted average price.
ta.vwap(source)
Returns
Volume weighted average.
Arguments
source(series int/float) Source series.
See also
ta.vwap
ta.vwma
The vwma function returns volume-weighted moving average of source for length bars back. It is the same as: sma(source * volume, length) / sma(volume, length).
ta.vwma(source, length)
Example
            pine

            plot(ta.vwma(close, 15))

// same on pine, but less efficient
pine_vwma(x, y) =>
    ta.sma(x * volume, y) / ta.sma(volume, y)
plot(pine_vwma(close, 15))
Returns
Volume-weighted moving average of source for length bars back.
Arguments
source(series int/float) Series of values to process.length(series int) Number of bars (length).
See also
ta.sma ta.ema ta.rma ta.wma ta.swma ta.alma
ta.wpr
Williams %R. The oscillator shows the current closing price in relation to the high and low of the past "period of time" bars.
ta.wpr(length)
Example
            pine

            plot(ta.wpr(14), title="%R", color=color.new(#ff6d00, 0))
Returns
Williams %R.
Arguments
length(series int) Number of bars.
plot
plot
Plots a series of data on the chart.
plot(series, title, color, linewidth, style, trackprice, histbase, offset, join, editable, show_last, display)
Example
            pine

            plot(high+low, title='Title', color=color.new(#00ffaa, 70), linewidth=2, style=plot.style_area, offset=15, trackprice=true)

// You may fill the background between any two plots with a fill() function:
p1 = plot(open)
p2 = plot(close)
fill(p1, p2, color=color.new(color.green, 90))
Returns
A plot object, that can be used in fill.
Arguments
series(series int/float) Series of data to be plotted. Required argument.title(const string) Title of the plot.color(series color) Color of the plot. You can use constants like 'color=color.red' or 'color=#ff001a' as well as complex expressions like 'color = close >= open ? color.green : color.red'. Optional argument.linewidth(input int) Width of the plotted line. Default value is 1. Not applicable to every style.style(plot_style) Type of plot. Possible values are: plot.style_line, plot.style_stepline, plot.style_stepline_diamond, plot.style_histogram, plot.style_cross, plot.style_area, plot.style_columns, plot.style_circles, plot.style_linebr, plot.style_areabr. Default value is plot.style_line.trackprice(input bool) If true then a horizontal price line will be shown at the level of the last indicator value. Default is false.histbase(input int/float) The price value used as the reference level when rendering plot with plot.style_histogram, plot.style_columns or plot.style_area style. Default is 0.0.offset(series int) Shifts the plot to the left or to the right on the given number of bars. Default is 0.join(input bool) If true then plot points will be joined with line, applicable only to plot.style_cross and plot.style_circles styles. Default is false.editable(const bool) If true then plot style will be editable in Format dialog. Default is true.show_last(input int) If set, defines the number of bars (from the last bar back to the past) to plot on chart.display(plot_display) Controls where the plot is displayed. Possible values are: display.none, display.all. Default is display.all.overlay(const bool) is the extension argument of FMZ platform, it is used to set the current function to be displayed on the main image (set to true) or sub-image (set to false), the default value is false. If this argument is not specified, it will be set according to theoverlayargument instrategyorindicator, ifstrategyorindicatordoes not set theoverlayargument, it will be processed according to the default arguments.
See also
plotshape plotchar bgcolor
plotshape
Plots visual shapes on the chart.
plotshape(series, title, style, location, color, offset, text, textcolor, editable, size, show_last, display)
Example
            pine

            data = close >= open
plotshape(data, style=shape.xcross)
Arguments
series(series bool) Series of data to be plotted as shapes. Series is treated as a series of boolean values for all location values except location.absolute. Required argument.title(const string) Title of the plot.style(input string) Type of plot. Possible values are: shape.xcross, shape.cross, shape.triangleup, shape.triangledown, shape.flag, shape.circle, shape.arrowup, shape.arrowdown, shape.labelup, shape.labeldown, shape.square, shape.diamond. Default value is shape.xcross.location(input string) Location of shapes on the chart. Possible values are: location.abovebar, location.belowbar, location.top, location.bottom, location.absolute. Default value is location.abovebar.color(series color) Color of the shapes. You can use constants like 'color=color.red' or 'color=#ff001a' as well as complex expressions like 'color = close >= open ? color.green : color.red'. Optional argument.offset(series int) Shifts shapes to the left or to the right on the given number of bars. Default is 0.text(const string) Text to display with the shape. You can use multiline text, to separate lines use '\n' escape sequence. Example: 'line one\nline two'.textcolor(series color) Color of the text. You can use constants like 'textcolor=color.red' or 'textcolor=#ff001a' as well as complex expressions like 'textcolor = close >= open ? color.green : color.red'. Optional argument.editable(const bool) If true then plotshape style will be editable in Format dialog. Default is true.show_last(input int) If set, defines the number of shapes (from the last bar back to the past) to plot on chart.size(const string) Size of shapes on the chart. Possible values are: size.auto, size.tiny, size.small, size.normal, size.large, size.huge. Default is size.auto.display(plot_display) Controls where the plot is displayed. Possible values are: display.none, display.all. Default is display.all.overlay(const bool) is the extension argument of FMZ platform, it is used to set the current function to be displayed on the main image (set to true) or sub-image (set to false), the default value is false. If this argument is not specified, it will be set according to theoverlayargument instrategyorindicator, ifstrategyorindicatordoes not set theoverlayargument, it will be processed according to the default arguments.
See also
plot plotchar bgcolor
plotchar
Plots visual shapes using any given one Unicode character on the chart.
plotchar(series, title, char, location, color, offset, text, textcolor, editable, size, show_last, display)
Example
            pine

            data = close >= open
plotchar(data, char='❄')
Arguments
series(series bool) Series of data to be plotted as shapes. Series is treated as a series of boolean values for all location values except location.absolute. Required argument.title(const string) Title of the plot.char(input string) Character to use as a visual shape.location(input string) Location of shapes on the chart. Possible values are: location.abovebar, location.belowbar, location.top, location.bottom, location.absolute. Default value is location.abovebar.color(series color) Color of the shapes. You can use constants like 'color=color.red' or 'color=#ff001a' as well as complex expressions like 'color = close >= open ? color.green : color.red'. Optional argument.offset(series int) Shifts shapes to the left or to the right on the given number of bars. Default is 0.text(const string) Text to display with the shape. You can use multiline text, to separate lines use '\n' escape sequence. Example: 'line one\nline two'.textcolor(series color) Color of the text. You can use constants like 'textcolor=color.red' or 'textcolor=#ff001a' as well as complex expressions like 'textcolor = close >= open ? color.green : color.red'. Optional argument.editable(const bool) If true then plotchar style will be editable in Format dialog. Default is true.show_last(input int) If set, defines the number of chars (from the last bar back to the past) to plot on chart.size(const string) Size of characters on the chart. Possible values are: size.auto, size.tiny, size.small, size.normal, size.large, size.huge. Default is size.auto.display(plot_display) Controls where the plot is displayed. Possible values are: display.none, display.all. Default is display.all.overlay(const bool) is the extension argument of FMZ platform, it is used to set the current function to be displayed on the main image (set to true) or sub-image (set to false), the default value is false. If this argument is not specified, it will be set according to theoverlayargument instrategyorindicator, ifstrategyorindicatordoes not set theoverlayargument, it will be processed according to the default arguments.
See also
plot plotshape bgcolor
plotcandle
Plots candles on the chart.
plotcandle(open, high, low, close, title, color, wickcolor, editable, show_last, bordercolor, display)
Example
            pine

            indicator("plotcandle example", overlay=true)
plotcandle(open, high, low, close, title='Title', color = open < close ? color.green : color.red, wickcolor=color.black)
Arguments
open(series int/float) Open series of data to be used as open values of candles. Required argument.high(series int/float) High series of data to be used as high values of candles. Required argument.low(series int/float) Low series of data to be used as low values of candles. Required argument.close(series int/float) Close series of data to be used as close values of candles. Required argument.title(const string) Title of the plotcandles. Optional argument.color(series color) Color of the candles. You can use constants like 'color=color.red' or 'color=#ff001a' as well as complex expressions like 'color = close >= open ? color.green : color.red'. Optional argument.wickcolor(series color) The color of the wick of candles. An optional argument.editable(const bool) If true then plotcandle style will be editable in Format dialog. Default is true.show_last(input int) If set, defines the number of candles (from the last bar back to the past) to plot on chart.bordercolor(series color) The border color of candles. An optional argument.display(plot_display) Controls where the plot is displayed. Possible values are: display.none, display.all. Default is display.all.overlay(const bool) is the extension argument of FMZ platform, it is used to set the current function to be displayed on the main image (set to true) or sub-image (set to false), the default value is false. If this argument is not specified, it will be set according to theoverlayargument instrategyorindicator, ifstrategyorindicatordoes not set theoverlayargument, it will be processed according to the default arguments.
Remarks
Even if one value of open, high, low or close equal NaN, then the bar need no draw.
The maximal value of open, high, low or close will be set as "high", and the minimal value will be set as "low".
See also
plotbar
plotarrow
Plots up and down arrows on the chart. Up arrow is drawn at every indicator positive value, down arrow is drawn at every negative value. If indicator returns na then no arrow is drawn. Arrows has different height, the more absolute indicator value the longer arrow is drawn.
plotarrow(series, title, colorup, colordown, offset, minheight, maxheight, editable, show_last, display)
Example
            codiff = close - open
plotarrow(codiff, colorup=color.new(color.teal,40), colordown=color.new(color.orange, 40), overlay=true)
Arguments
series(series int/float) Series of data to be plotted as arrows. Required argument.title(const string) Title of the plot.colorup(series color) Color of the up arrows. Optional argument.colordown(series color) Color of the down arrows. Optional argument.offset(series int) Shifts arrows to the left or to the right on the given number of bars. Default is 0.minheight(input int) Minimal possible arrow height in pixels. Default is 5.maxheight(input int) Maximum possible arrow height in pixels. Default is 100.editable(const bool) If true then plotarrow style will be editable in Format dialog. Default is true.show_last(input int) If set, defines the number of arrows (from the last bar back to the past) to plot on chart.display(plot_display) Controls where the plot is displayed. Possible values are: display.none, display.all. Default is display.all.overlay(const bool) is the extension argument of FMZ platform, it is used to set the current function to be displayed on the main image (set to true) or sub-image (set to false), the default value is false. If this argument is not specified, it will be set according to theoverlayargument instrategyorindicator, ifstrategyorindicatordoes not set theoverlayargument, it will be processed according to the default arguments.
See also
plot plotshape plotchar barcolor bgcolor
array
array.pop
The function removes the last element from an array and returns its value.
array.pop(id)
Example
            pine

            // array.pop example
a = array.new_float(5,high)
removedEl = array.pop(a)
plot(array.size(a))
plot(removedEl)
Returns
The value of the removed element.
Arguments
id(any array type) An array object.
See also
array.new_float array.set array.push array.remove array.insert array.shift
array.shift
The function removes an array's first element and returns its value.
array.shift(id)
Example
            pine

            // array.shift example
a = array.new_float(5,high)
removedEl = array.shift(a)
plot(array.size(a))
plot(removedEl)
Returns
The value of the removed element.
Arguments
id(any array type) An array object.
See also
array.unshift array.set array.push array.remove array.includes
array.unshift
The function inserts the value at the beginning of the array.
array.unshift(id, value)
Example
            pine

            // array.unshift example
a = array.new_float(5, 0)
array.unshift(a, open)
plot(array.get(a, 0))
Arguments
id(any array type) An array object.value(series <type of the array's elements>) The value to add to the start of the array.
See also
array.shift array.set array.insert array.remove array.indexof
array.size
The function returns the number of elements in an array.
array.size(id)
Example
            pine

            // array.size example
a = array.new_float(0)
for i = 0 to 9
    array.push(a, close[i])
// note that changes in slice also modify original array
slice = array.slice(a, 0, 5)
array.push(slice, open)
// size was changed in slice and in original array
plot(array.size(a))
plot(array.size(slice))
Returns
The number of elements in the array.
Arguments
id(any array type) An array object.
See also
array.new_float array.sum array.slice array.sort
array.slice
The function creates a slice from an existing array. If an object from the slice changes, the changes are applied to both the new and the original arrays.
array.slice(id, index_from, index_to)
Example
            pine

            // array.slice example
a = array.new_float(0)
for i = 0 to 9
    array.push(a, close[i])
// take elements from 0 to 4
// *note that changes in slice also modify original array
slice = array.slice(a, 0, 5)
plot(array.sum(a) / 10)
plot(array.sum(slice) / 5)
Returns
A shallow copy of an array's slice.
Arguments
id(any array type) An array object.index_from(series int) Zero-based index at which to begin extraction.index_to(series int) Zero-based index before which to end extraction. The function extracts up to but not including the element with this index.
See also
array.new_float array.get array.sort
array.abs
Returns an array containing the absolute value of each element in the original array.
array.abs(id)
Arguments
id(int[]/float[]) An array object.
See also
array.new_float array.insert array.slice array.reverse order.ascending order.descending
array.binary_search
The function returns the index of the value, or -1 if the value is not found. The array to search must be sorted in ascending order.
array.binary_search(id, val)
Example
            pine

            // array.binary_search
a = array.from(5, -2, 0, 9, 1)
array.sort(a) // [-2, 0, 1, 5, 9]
position = array.binary_search(a, 0) // 1
plot(position)
Arguments
id(int[]/float[]) An array object.val(series int/float) The value to search for in the array.
Remarks
A binary search works on arrays pre-sorted in ascending order. It begins by comparing an element in the middle of the array with the target value. If the element matches the target value, its position in the array is returned. If the element's value is greater than the target value, the search continues in the lower half of the array. If the element's value is less than the target value, the search continues in the upper half of the array. By doing this recursively, the algorithm progressively eliminates smaller and smaller portions of the array in which the target value cannot lie.
See also
array.new_float array.insert array.slice array.reverse order.ascending order.descending
array.binary_search_leftmost
The function returns the index of the value if it is found. When the value is not found, the function returns the index of the next smallest element to the left of where the value would lie if it was in the array. The array to search must be sorted in ascending order.
array.binary_search_leftmost(id, val)
Example
            pine

            // array.binary_search_leftmost
a = array.from(5, -2, 0, 9, 1)
array.sort(a) // [-2, 0, 1, 5, 9]
position = array.binary_search_leftmost(a, 3) // 2
plot(position)
Arguments
id(int[]/float[]) An array object.val(series int/float) The value to search for in the array.
Remarks
A binary search works on arrays pre-sorted in ascending order. It begins by comparing an element in the middle of the array with the target value. If the element matches the target value, its position in the array is returned. If the element's value is greater than the target value, the search continues in the lower half of the array. If the element's value is less than the target value, the search continues in the upper half of the array. By doing this recursively, the algorithm progressively eliminates smaller and smaller portions of the array in which the target value cannot lie.
See also
array.new_float array.insert array.slice array.reverse order.ascending order.descending
array.binary_search_rightmost
The function returns the index of the value if it is found. When the value is not found, the function returns the index of the element to the right of where the value would lie if it was in the array. The array must be sorted in ascending order.
array.binary_search_rightmost(id, val)
Example
            pine

            // array.binary_search_rightmost
a = array.from(5, -2, 0, 9, 1)
array.sort(a) // [-2, 0, 1, 5, 9]
position = array.binary_search_rightmost(a, 3) // 3
plot(position)
Arguments
id(int[]/float[]) An array object.val(series int/float) The value to search for in the array.
Remarks
A binary search works on sorted arrays in ascending order. It begins by comparing an element in the middle of the array with the target value. If the element matches the target value, its position in the array is returned. If the element's value is greater than the target value, the search continues in the lower half of the array. If the element's value is less than the target value, the search continues in the upper half of the array. By doing this recursively, the algorithm progressively eliminates smaller and smaller portions of the array in which the target value cannot lie.
See also
array.new_float array.insert array.slice array.reverse order.ascending order.descending
array.sort
The function sorts the elements of an array.
array.sort(id, order)
Example
            pine

            // array.sort example
a = array.new_float(0,0)
for i = 0 to 5
    array.push(a, high[i])
array.sort(a, order.descending)
if barstate.islast
    runtime.log(str.tostring(a))
Arguments
id(int[]/float[]/string[]) An array object.order(sort_order) The sort order: order.ascending (default) or order.descending.
See also
array.new_float array.insert array.slice array.reverse order.ascending order.descending
array.sort_indices
Returns an array of indices which, when used to index the original array, will access its elements in their sorted order. It does not modify the original array.
array.sort_indices(id, order)
Example
            pine

            // array.sort_indices
a = array.from(5, -2, 0, 9, 1)
sortedIndices = array.sort_indices(a) // [1, 2, 4, 0, 3]
indexOfSmallestValue = array.get(sortedIndices, 0) // 1
smallestValue = array.get(a, indexOfSmallestValue) // -2
plot(smallestValue)
Arguments
id(int[]/float[]/string[]) An array object.order(sort_order) The sort order: order.ascending or order.descending. Optional. The default is order.ascending.
See also
array.new_float array.insert array.slice array.reverse order.ascending order.descending
array.clear
The function removes all elements from an array.
array.clear(id)
Example
            pine

            // array.clear example
a = array.new_float(5,high)
array.clear(a)
array.push(a, close)
plot(array.get(a,0))
plot(array.size(a))
Arguments
id(any array type) An array object.
See also
array.new_float array.insert array.push array.remove array.pop
array.concat
The function is used to merge two arrays. It pushes all elements from the second array to the first array, and returns the first array.
array.concat(id1, id2)
Example
            pine

            // array.concat example
a = array.new_float(0,0)
b = array.new_float(0,0)
for i = 0 to 4
    array.push(a, high[i])
    array.push(b, low[i])
c = array.concat(a,b)
plot(array.size(a))
plot(array.size(b))
plot(array.size(c))
Returns
The first array with merged elements from the second array.
Arguments
id1(any array type) The first array object.id2(any array type) The second array object.
See also
array.new_float array.insert array.slice
array.copy
The function creates a copy of an existing array.
array.copy(id)
Example
            pine

            // array.copy example
length = 5
a = array.new_float(length, close)
b = array.copy(a)
a := array.new_float(length, open)
plot(array.sum(a) / length)
plot(array.sum(b) / length)
Returns
A copy of an array.
Arguments
id(any array type) An array object.
See also
array.new_float array.get array.slice array.sort
array.stdev
The function returns the standard deviation of an array's elements.
array.stdev(id, biased)
Example
            pine

            // array.stdev example
a = array.new_float(0)
for i = 0 to 9
    array.push(a, close[i])
plot(array.stdev(a))
Returns
The standard deviation of the array's elements.
Arguments
id(int[]/float[]) An array object.biased(series bool) Determines which estimate should be used. Optional. The default is true.
Remarks
If biased is true, function will calculate using a biased estimate of the entire population, if false - unbiased estimate of a sample.
See also
array.new_float array.max array.min array.avg
array.standardize
The function returns the array of standardized elements.
array.standardize(id)
Example
            pine

            // array.standardize example
a = array.new_float(0)
for i = 0 to 9
    array.push(a, close[i])
b = array.standardize(a)
plot(array.min(b))
plot(array.max(b))
Returns
The array of standardized elements.
Arguments
id(int[]/float[]) An array object.
See also
array.max array.min array.mode array.avg array.variance array.stdev
array.variance
The function returns the variance of an array's elements.
array.variance(id, biased)
Example
            pine

            // array.variance example
a = array.new_float(0)
for i = 0 to 9
    array.push(a, close[i])
plot(array.variance(a))
Returns
The variance of the array's elements.
Arguments
id(int[]/float[]) An array object.biased(series bool) Determines which estimate should be used. Optional. The default is true.
Remarks
If biased is true, function will calculate using a biased estimate of the entire population, if false - unbiased estimate of a sample.
See also
array.new_float array.stdev array.min array.avg array.covariance
array.covariance
The function returns the covariance of two arrays.
array.covariance(id1, id2, biased)
Example
            pine

            // array.covariance example
a = array.new_float(0)
b = array.new_float(0)
for i = 0 to 9
    array.push(a, close[i])
    array.push(b, open[i])
plot(array.covariance(a, b))
Returns
The covariance of two arrays.
Arguments
id1(int[]/float[]) An array object.id2(int[]/float[]) An array object.biased(series bool) Determines which estimate should be used. Optional. The default is true.
Remarks
If biased is true, function will calculate using a biased estimate of the entire population, if false - unbiased estimate of a sample.
See also
array.new_float array.max array.stdev array.avg array.variance
array.fill
The function sets elements of an array to a single value. If no index is specified, all elements are set. If only a start index (default 0) is supplied, the elements starting at that index are set. If both index arguments are used, the elements from the starting index up to but not including the end index (default na) are set.
array.fill(id, value, index_from, index_to)
Example
            pine

            // array.fill example
a = array.new_float(10)
array.fill(a, close)
plot(array.sum(a))
Arguments
id(any array type) An array object.value(series <type of the array's elements>) Value to fill the array with.index_from(series int) Start index, default is 0.index_to(series int) End index, default is na. Must be one greater than the index of the last element to set.
See also
array.new_float array.set array.slice
array.includes
The function returns true if the value was found in an array, false otherwise.
array.includes(id, value)
Example
            pine

            // array.includes example
a = array.new_float(5,high)
p = close
if array.includes(a, high)
    p := open
plot(p)
Returns
True if the value was found in the array, false otherwise.
Arguments
id(any array type) An array object.value(series <type of the array's elements>) The value to search in the array.
See also
array.new_float array.indexof array.shift array.remove array.insert
array.insert
The function changes the contents of an array by adding new elements in place.
array.insert(id, index, value)
Example
            pine

            // array.insert example
a = array.new_float(5, close)
array.insert(a, 0, open)
plot(array.get(a, 5))
Arguments
id(any array type) An array object.index(series int) The index at which to insert the value.value(series <type of the array's elements>) The value to add to the array.
See also
array.new_float array.set array.push array.remove array.pop array.unshift
array.join
The function creates and returns a new string by concatenating all the elements of an array, separated by the specified separator string.
array.join(id, separator)
Example
            pine

            // array.join example
a = array.new_float(5, 5)
runtime.log(array.join(a, ","))
Arguments
id(int[]/float[]/string[]) An array object.separator(series string) The string used to separate each array element.
See also
array.new_float array.set array.insert array.remove array.pop array.unshift
array.lastindexof
The function returns the index of the last occurrence of the value, or -1 if the value is not found.
array.lastindexof(id, value)
Example
            pine

            // array.lastindexof example
a = array.new_float(5,high)
index = array.lastindexof(a, high)
plot(index)
Returns
The index of an element.
Arguments
id(any array type) An array object.value(series <type of the array's elements>) The value to search in the array.
See also
array.new_float array.set array.push array.remove array.insert
array.max
The function returns the greatest value, or the nth greatest value in a given array.
array.max(id, nth)
Example
            pine

            // array.max
a = array.from(5, -2, 0, 9, 1)
secondHighest = array.max(a, 2) // 1
plot(secondHighest)
Returns
The greatest or the nth greatest value in the array.
Arguments
id(int[]/float[]) An array object.nth(series int) The nth greatest value to return, where zero is the greatest. Optional. The default is zero.
See also
array.new_float array.min array.sum
array.min
The function returns the smallest value, or the nth smallest value in a given array.
array.min(id, nth)
Example
            pine

            // array.min
a = array.from(5, -2, 0, 9, 1)
secondLowest = array.min(a, 1) // 0
plot(secondLowest)
Returns
The smallest or the nth smallest value in the array.
Arguments
id(int[]/float[]) An array object.nth(series int) The nth smallest value to return, where zero is the smallest. Optional. The default is zero.
See also
array.new_float array.max array.sum
array.median
The function returns the median of an array's elements.
array.median(id)
Example
            pine

            // array.median example
a = array.new_float(0)
for i = 0 to 9
    array.push(a, close[i])
plot(array.median(a))
Returns
The median of the array's elements.
Arguments
id(int[]/float[]) An array object.
See also
array.avg array.variance array.min
array.mode
The function returns the mode of an array's elements. If there are several values with the same frequency, it returns the smallest value.
array.mode(id)
Example
            pine

            // array.mode example
a = array.new_float(0)
for i = 0 to 9
    array.push(a, close[i])
plot(array.mode(a))
Returns
The mode of the array's elements.
Arguments
id(int[]/float[]) An array object.
See also
array.new_float array.avg array.variance array.min
array.percentile_linear_interpolation
Returns the value for which the specified percentage of array values (percentile) are less than or equal to it, using linear interpolation.
array.percentile_linear_interpolation(id, percentage)
Arguments
id(int[]/float[]) An array object.percentage(series int/float) The percentage of values that must be equal or less than the returned value.
Remarks
In statistics, the percentile is the percent of ranking items that appear at or below a certain score. This measurement shows the percentage of scores within a standard frequency distribution that is lower than the percentile rank you're measuring. Linear interpolation estimates the value between two ranks.
See also
array.new_float array.insert array.slice array.reverse order.ascending order.descending
array.percentile_nearest_rank
Returns the value for which the specified percentage of array values (percentile) are less than or equal to it, using the nearest-rank method.
array.percentile_nearest_rank(id, percentage)
Arguments
id(int[]/float[]) An array object.percentage(series int/float) The percentage of values that must be equal or less than the returned value.
Remarks
In statistics, the percentile is the percent of ranking items that appear at or below a certain score. This measurement shows the percentage of scores within a standard frequency distribution that is lower than the percentile rank you're measuring.
See also
array.new_float array.insert array.slice array.reverse order.ascending order.descending
array.percentrank
Returns the percentile rank of a value in the array.
array.percentrank(id, index)
Arguments
id(int[]/float[]) An array object.index(series int) The value for which to calculate its percentile rank.
Remarks
Percentile rank is the percentage of how many elements in the array are less than or equal to the reference value.
See also
array.new_float array.insert array.slice array.reverse order.ascending order.descending
array.range
The function returns the difference between the min and max values from a given array.
array.range(id)
Example
            pine

            // array.range example
a = array.new_float(0)
for i = 0 to 9
    array.push(a, close[i])
plot(array.range(a))
Returns
The difference between the min and max values in the array.
Arguments
id(int[]/float[]) An array object.
See also
array.new_float array.min array.max array.sum
array.remove
The function changes the contents of an array by removing the element with the specified index.
array.remove(id, index)
Example
            pine

            // array.remove example
a = array.new_float(5,high)
removedEl = array.remove(a, 0)
plot(array.size(a))
plot(removedEl)
Returns
The value of the removed element.
Arguments
id(any array type) An array object.index(series int) The index of the element to remove.
See also
array.new_float array.set array.push array.insert array.pop array.shift
array.reverse
The function reverses an array. The first array element becomes the last, and the last array element becomes the first.
array.reverse(id)
Example
            pine

            // array.reverse example
a = array.new_float(0)
for i = 0 to 9
    array.push(a, close[i])
plot(array.get(a, 0))
array.reverse(a)
plot(array.get(a, 0))
Arguments
id(any array type) An array object.
See also
array.new_float array.sort array.push array.set array.avg
array.from
The function takes a variable number of arguments with one of the types: int, float, bool, string, label, line, color, box, table, linefill, and returns an array of the corresponding type.
array.from(arg0, arg1, ...)
Example
            pine

            // array.from_example
arr = array.from("Hello", "World!") // arr (string[]) will contain 2 elements: {Hello}, {World!}.
plot(close)
Returns
The array element's value.
Arguments
arg0, arg1, ...(series int/float/bool/color/string/line/linefill) Array arguments.
array.new
The function creates a new array object of <type> elements.
array.new(size, initial_value)
Example
            pine

            // array.new<string> example
a = array.new<string>(1, "Hello, World!")
runtime.log(array.get(a, 0))
Example
            pine

            // array.new<color> example
a = array.new<color>()
array.push(a, color.red)
array.push(a, color.green)
plot(close, color = array.get(a, close > open ? 1 : 0))
Example
            pine

            // array.new<float> example
length = 5
var a = array.new<float>(length, close)
if array.size(a) == length
  array.remove(a, 0)
  array.push(a, close)
plot(array.sum(a) / length, "SMA")
Example
            pine

            // array.new<line> example
// draw last 15 lines
var a = array.new<line>()
array.push(a, line.new(bar_index - 1, close[1], bar_index, close))
if array.size(a) > 15
    ln = array.shift(a)
    line.delete(ln)
Returns
The ID of an array object which may be used in other array.*() functions.
Arguments
size(series int) Initial size of an array. Optional. The default is 0.initial_value(series <type>) Initial value of all array elements. Optional. The default is "na".
Remarks
An array index starts from 0.
If you want to initialize an array and specify all its elements at the same time, then use the function array.from.
See also
array.from array.push array.get array.size array.remove array.shift array.sum
array.new_bool
The function creates a new array object of bool type elements.
array.new_bool(size, initial_value)
Example
            pine

            // array.new_bool example
length = 5
a = array.new_bool(length, close > open)
plot(array.get(a, 0) ? close : open)
Returns
The ID of an array object which may be used in other array.*() functions.
Arguments
size(series int) Initial size of an array. Optional. The default is 0.initial_value(series bool) Initial value of all array elements. Optional. The default is "na".
Remarks
The array index starts at 0.
See also
array.new_float array.get array.slice array.sort
array.new_float
The function creates a new array object of float type elements.
array.new_float(size, initial_value)
Example
            pine

            // array.new_float example
length = 5
a = array.new_float(length, close)
plot(array.sum(a) / length)
Returns
The ID of an array object which may be used in other array.*() functions.
Arguments
size(series int) Initial size of an array. Optional. The default is 0.initial_value(series int/float) Initial value of all array elements. Optional. The default is "na".
Remarks
An array index starts from 0.
See also
array.new_bool array.get array.slice array.sort
array.new_int
The function creates a new array object of int type elements.
array.new_int(size, initial_value)
Example
            pine

            // array.new_int example
length = 5
a = array.new_int(length, int(close))
plot(array.sum(a) / length)
Returns
The ID of an array object which may be used in other array.*() functions.
Arguments
size(series int) Initial size of an array. Optional. The default is 0.initial_value(series int) Initial value of all array elements. Optional. The default is "na".
Remarks
An array index starts from 0.
See also
array.new_float array.get array.slice array.sort
array.new_string
The function creates a new array object of string type elements.
array.new_string(size, initial_value)
Example
            pine

            // array.new_string example
length = 5
a = array.new_string(length, "text")
runtime.log(array.get(a, 0))
Returns
The ID of an array object which may be used in other array.*() functions.
Arguments
size(series int) Initial size of an array. Optional. The default is 0.initial_value(series string) Initial value of all array elements. Optional. The default is "na".
Remarks
An array index starts from 0.
See also
array.new_float array.get array.slice
array.get
The function returns the value of the element at the specified index.
array.get(id, index)
Example
            pine

            // array.get example
a = array.new_float(0)
for i = 0 to 9
  array.push(a, close[i] - open[i])
plot(array.get(a, 9))
Returns
The array element's value.
Arguments
id(any array type) An array object.index(series int) The index of the element whose value is to be returned.
See also
array.new_float array.set array.slice array.sort
array.push
The function appends a value to an array.
array.push(id, value)
Example
            pine

            // array.push example
a = array.new_float(5, 0)
array.push(a, open)
plot(array.get(a, 5))
Arguments
id(any array type) An array object.value(series <type of the array's elements>) The value of the element added to the end of the array.
See also
array.new_float array.set array.insert array.remove array.pop array.unshift
array.set
The function sets the value of the element at the specified index.
array.set(id, index, value)
Example
            pine

            // array.set example
a = array.new_float(10)
for i = 0 to 9
  array.set(a, i, close[i])
plot(array.sum(a) / 10)
Arguments
id(any array type) An array object.index(series int) The index of the element to be modified.value(series <type of the array's elements>) The new value to be set.
See also
array.new_float array.get array.slice
array.sum
The function returns the sum of an array's elements.
array.sum(id)
Example
            pine

            // array.sum example
a = array.new_float(0)
for i = 0 to 9
  array.push(a, close[i])
plot(array.sum(a))
Returns
The sum of the array's elements.
Arguments
id(int[]/float[]) An array object.
See also
array.new_float array.max array.min
array.avg
The function returns the mean of an array's elements.
array.avg(id)
Example
            pine

            // array.avg example
a = array.new_float(0)
for i = 0 to 9
  array.push(a, close[i])
plot(array.avg(a))
Returns
Mean of array's elements.
Arguments
id(int[]/float[]) An array object.
See also
array.new_float array.max array.min array.stdev
array.indexof
The function returns the index of the first occurrence of the value, or -1 if the value is not found.
array.indexof(id, value)
Example
            pine

            // array.indexof example
a = array.new_float(5,high)
index = array.indexof(a, high)
plot(index)
Returns
The index of an element.
Arguments
id(any array type) An array object.value(series <type of the array's elements>) The value to search in the array.
See also
array.lastindexof array.get array.lastindexof array.remove array.insert
strategy
In the built-in functions related to strategy, the stop loss points and take profit points are defined as multiples of one price jump. For example, the profit and loss arguments of the strategy.exit function represent stop loss and take profit in points, and the argument profit is set to 10, that is the price jump is multiplied by 10 as the take profit spread, and the price jump is the built-in variable syminfo.mintick.
strategy
The function sets a number of strategy properties.
Note that only title, shorttitle, overlay, pyramiding, default_qty_type, default_qty_value arguments are supported for passing arguments. Other arguments can be set through the interface arguments of the PINE language strategy.
strategy(title, shorttitle, overlay, format, precision, scale, pyramiding, calc_on_order_fills, calc_on_every_tick, max_bars_back, backtest_fill_limits_assumption, default_qty_type, default_qty_value, initial_capital, currency, slippage, commission_type, commission_value, process_orders_on_close, close_entries_rule, margin_long, margin_short, explicit_plot_zorder, max_lines_count, max_labels_count, max_boxes_count, risk_free_rate)
Example
            pine

            strategy("Strategy", overlay = true)

// Enter long by market if current open is greater than previous high.
strategy.entry("Long", strategy.long, 1, when = open > high[1])
// Generate a full exit bracket (profit 10 points, loss 5 points per contract) from the entry named "Long".
strategy.exit("Exit", "Long", profit = 10, loss = 5)
Arguments
title(const string) indicator title that would be seen in Indicators/Strategies widget. Argument IS REQUIRED.shorttitle(const string) indicator short title that would be seen in the chart legend. Argument is optional.overlay(const bool) if true the indicator will be added as an overlay for the main series. If false - it would be added on a separate chart pane. Default is false.formatprecisionscalepyramiding(const int) The maximum number of entries allowed in the same direction. If the value is 0, only one entry order in the same direction can be opened, and additional entry orders are rejected. The default value is 0.calc_on_order_fills(const bool) Additional one time intrabar order calculation. If the argument is set to "true", then the strategy is recalculated once intrabar after an order is filled (not only at close of the bar). The default value is "false".calc_on_every_tickmax_bars_backbacktest_fill_limits_assumptiondefault_qty_type(const string) Determines what the value used for theqtyargument represents in strategy.entry or strategy.order functions. Possible values are: strategy.fixed for contracts/shares/lots, strategy.cash for amounts in currency, or strategy.percent_of_equity for a percentage of the available equity.default_qty_value(const int/float) The default quantity to trade in strategy.entry or strategy.order functions when their 'qty' argument is not defined, in units determined by the argument used with the 'default_qty_type' argument.currencyslippagecommission_typecommission_valueprocess_orders_on_closetrue, generates an additional attempt to execute orders after a bar closes and strategy calculations are completed. If the orders are market orders, the broker emulator executes them before the next bar's open. If the orders are conditional on price, they will only be filled if the price conditions are met. This option is useful if you wish to close positions on the current bar. The default value is 'false'.close_entries_rulemax_lines_countmax_labels_countmax_boxes_countmargin_long
-~~margin_short~~ (const int/float) Margin short is the percentage of the purchase price of a security that must be covered by cash or collateral for short positions. Must be a non-negative number. Optional. The default is 100.explicit_plot_zorderfalse.initial_capitalcurrency. Optional. The default is 1000000.risk_free_rate
Remarks
Every strategy script must have one strategy call.
Pine Script code that uses argument calc_on_every_tick = true could calculate differently on history and real-time data.
When using non-standard types of chart as a basis for strategy, you need to realize that the result will be different. The orders will be executed at the prices of this chart (e.g.for Heikin Ashi it’ll take Heikin Ashi prices (the average ones) not the real market prices). Therefore we highly recommend you to use standard chart type for strategies.
See also
indicator
strategy.entry
It is a command to enter market position. If an order with the same ID is already pending, it is possible to modify the order. If there is no order with the specified ID, a new order is placed. To deactivate an entry order, the command strategy.cancel or strategy.cancel_all should be used. In comparison to the function strategy.order, the function strategy.entry is affected by pyramiding and it can reverse market position correctly. If both 'limit' and 'stop' arguments are 'NaN', the order type is market order.
strategy.entry(id, direction, qty, limit, stop, oca_name, oca_type, comment, when, alert_message)
Example
            pine

            strategy(title = "simple strategy entry example")
strategy.entry("enter long", strategy.long, 1, when = open > high[1]) // enter long by market if current open great then previous high
strategy.entry("enter short", strategy.short, 1, when = open < low[1]) // enter short by market if current open less then previous low
Arguments
id(series string) A required argument. The order identifier. It is possible to cancel or modify an order by referencing its identifier.direction(strategy_direction) A required argument. Market position direction: 'strategy.long' is for long, 'strategy.short' is for short.qty(series int/float) An optional argument. Number of contracts/shares/lots/units to trade. The default value is 'NaN'.limit(series int/float) An optional argument. Limit price of the order. If it is specified, the order type is either 'limit', or 'stop-limit'. 'NaN' should be specified for any other order type.stop(series int/float) An optional argument. Stop price of the order. If it is specified, the order type is either 'stop', or 'stop-limit'. 'NaN' should be specified for any other order type.oca_nameoca_typecomment(series string) An optional argument. Additional notes on the order.when(series bool) An optional argument. Condition of the order. The order is placed if condition is 'true'. If condition is 'false', nothing happens (the previously placed order with the same ID is not cancelled). Default value is 'true'.alert_message(series string) An optional argument which replaces the {{strategy.order.alert_message}} placeholder when it is used in the "Create Alert" dialog box's "Message" field.
strategy.close
It is a command to exit from the entry with the specified ID. If there were multiple entry orders with the same ID, all of them are exited at once. If there are no open entries with the specified ID by the moment the command is triggered, the command will not come into effect. The command uses market order. Every entry is closed by a separate market order.
strategy.close(id, when, comment, qty, qty_percent, alert_message)
Example
            pine

            strategy("closeEntry Demo", overlay=false)
strategy.entry("buy", strategy.long, when = open > close)
strategy.close("buy", when = open < close, qty_percent = 50, comment = "close buy entry for 50%")
plot(strategy.position_size)
Arguments
id(series string) A required argument. The order identifier. It is possible to close an order by referencing its identifier.when(series bool) An optional argument. Condition of the command.qty(series int/float) An optional argument. Number of contracts/shares/lots/units to exit a trade with. The default value is 'NaN'.qty_percent(series int/float) Defines the percentage (0-100) of the position to close. Its priority is lower than that of the 'qty' argument. Optional. The default is 100.comment(series string) An optional argument. Additional notes on the order.alert_message(series string) An optional argument which replaces the {{strategy.order.alert_message}} placeholder when it is used in the "Create Alert" dialog box's "Message" field.
strategy.close_all
Exits the current market position, making it flat.
strategy.close_all(when, comment, alert_message)
Example
            pine

            strategy("closeAll Demo", overlay=false)
strategy.entry("buy", strategy.long, when = open > close)
strategy.close_all(when = open < close, comment = "close all entries")
plot(strategy.position_size)
Arguments
when(series bool) An optional argument. Condition of the command.comment(series string) An optional argument. Additional notes on the order.alert_message(series string) An optional argument which replaces the {{strategy.order.alert_message}} placeholder when it is used in the "Create Alert" dialog box's "Message" field.
strategy.exit
It is a command to exit either a specific entry, or whole market position. If an order with the same ID is already pending, it is possible to modify the order. If an entry order was not filled, but an exit order is generated, the exit order will wait till entry order is filled and then the exit order is placed. To deactivate an exit order, the command strategy.cancel or strategy.cancel_all should be used. If the function strategy.exit is called once, it exits a position only once. If you want to exit multiple times, the command strategy.exit should be called multiple times. If you use a stop loss and a trailing stop, their order type is 'stop', so only one of them is placed (the one that is supposed to be filled first). If all the following arguments 'profit', 'limit', 'loss', 'stop', 'trail_points', 'trail_offset' are 'NaN', the command will fail. To use market order to exit, the command strategy.close or strategy.close_all should be used.
strategy.exit(id, from_entry, qty, qty_percent, profit, limit, loss, stop, trail_price, trail_points, trail_offset, oca_name, comment, when, alert_message)
Example
            pine

            strategy(title = "simple strategy exit example")
strategy.entry("long", strategy.long, 1, when = open > high[1]) // enter long by market if current open great then previous high
strategy.exit("exit", "long", profit = 10, loss = 5) // generate full exit bracket (profit 10 points, loss 5 points per contract) from entry with name "long"
Arguments
id(series string) A required argument. The order identifier. It is possible to cancel or modify an order by referencing its identifier.from_entry(series string) An optional argument. The identifier of a specific entry order to exit from it. To exit all entries an empty string should be used. The default values is empty string.qty(series int/float) An optional argument. Number of contracts/shares/lots/units to exit a trade with. The default value is 'NaN'.qty_percent(series int/float) Defines the percentage of (0-100) the position to close. Its priority is lower than that of the 'qty' argument. Optional. The default is 100.profit(series int/float) An optional argument. Profit target (specified in ticks). If it is specified, a limit order is placed to exit market position when the specified amount of profit (in ticks) is reached. The default value is 'NaN'.limit(series int/float) An optional argument. Profit target (requires a specific price). If it is specified, a limit order is placed to exit market position at the specified price (or better). Priority of the argument 'limit' is higher than priority of the argument 'profit' ('limit' is used instead of 'profit', if its value is not 'NaN'). The default value is 'NaN'.loss(series int/float) An optional argument. Stop loss (specified in ticks). If it is specified, a stop order is placed to exit market position when the specified amount of loss (in ticks) is reached. The default value is 'NaN'.stop(series int/float) An optional argument. Stop loss (requires a specific price). If it is specified, a stop order is placed to exit market position at the specified price (or worse). Priority of the argument 'stop' is higher than priority of the argument 'loss' ('stop' is used instead of 'loss', if its value is not 'NaN'). The default value is 'NaN'.trail_price(series int/float) An optional argument. Trailing stop activation level (requires a specific price). If it is specified, a trailing stop order will be placed when the specified price level is reached. The offset (in ticks) to determine initial price of the trailing stop order is specified in the 'trail_offset' argument: X ticks lower than activation level to exit long position; X ticks higher than activation level to exit short position. The default value is 'NaN'.trail_points(series int/float) An optional argument. Trailing stop activation level (profit specified in ticks). If it is specified, a trailing stop order will be placed when the calculated price level (specified amount of profit) is reached. The offset (in ticks) to determine initial price of the trailing stop order is specified in the 'trail_offset' argument: X ticks lower than activation level to exit long position; X ticks higher than activation level to exit short position. The default value is 'NaN'.trail_offset(series int/float) An optional argument. Trailing stop price (specified in ticks). The offset in ticks to determine initial price of the trailing stop order: X ticks lower than 'trail_price' or 'trail_points' to exit long position; X ticks higher than 'trail_price' or 'trail_points' to exit short position. The default value is 'NaN'.oca_namecomment(series string) An optional argument. Additional instructions for the order.when(series bool) An optional argument. Condition of the order. The order is placed if condition is "true". If condition is "false", nothing happens (the previously placed order with the same ID is not cancelled). Default value is "true".alert_message(series string) An optional argument when using the {{strategy.order.alert_message}} placeholder in the "Message" field of the "Create Alert" dialog.
strategy.cancel
It is a command to cancel/deactivate pending orders by referencing their names, which were generated by the functions: strategy.order, strategy.entry and strategy.exit.
strategy.cancel(id, when)
Example
            pine

            strategy(title = "simple order cancellation example")
conditionForBuy = open > high[1]
strategy.entry("long", strategy.long, 1, limit = low, when = conditionForBuy) // enter long using limit order at low price of current bar if conditionForBuy is true
strategy.cancel("long", when = not conditionForBuy) // cancel the entry order with name "long" if conditionForBuy is false
Arguments
id(series string) A required argument. The order identifier. It is possible to cancel an order by referencing its identifier.when(series bool) An optional argument. Condition to cancel an order with specified ID. If condition is "true", then the order with specified ID will be cancelled. Default value is "true".
strategy.cancel_all
It is a command to cancel/deactivate all pending orders, which were generated by the functions: strategy.order, strategy.entry and strategy.exit.
strategy.cancel_all(when)
Example
            pine

            strategy(title = "simple all orders cancellation example")
conditionForBuy1 = open > high[1]
strategy.entry("long entry 1", strategy.long, 1, limit = low, when = conditionForBuy1) // enter long by limit if conditionForBuy1 is true
conditionForBuy2 = conditionForBuy1 and open[1] > high[2]
strategy.entry("long entry 2", strategy.long, 1, limit = ta.lowest(low, 2), when = conditionForBuy2) // enter long by limit if conditionForBuy2 is true
conditionForStopTrading = open < ta.lowest(low, 2)
strategy.cancel_all(conditionForStopTrading) // cancel both limit orders if the conditon conditionForStopTrading is true
Arguments
when(series bool) An optional argument. Condition to cancel all orders. If condition is true, then all active orders will be cancelled. Default value is 'true'.
strategy.order
It is a command to place order. If an order with the same ID is already pending, it is possible to modify the order. If there is no order with the specified ID, a new order is placed. To deactivate order, the command strategy.cancel or strategy.cancel_all should be used. In comparison to the function strategy.entry, the function strategy.order is not affected by pyramiding. If both 'limit' and 'stop' parameters are 'NaN', the order type is market order.
strategy.order(id, direction, qty, limit, stop, oca_name, oca_type, comment, when, alert_message)
Example
            strategy(title = "simple strategy order example")
strategy.order("buy", strategy.long, 1, when = open > high[1]) // buy by market if current open great then previous high
strategy.order("sell", strategy.short, 1, when = open < low[1]) // sell by market if current open less then previous low
Arguments
id(series string) A required parameter. The order identifier. It is possible to cancel or modify an order by referencing its identifier.direction(strategy_direction) A required parameter. Order direction: 'strategy.long' is for buy, 'strategy.short' is for sell.qty(series int/float) An optional parameter. Number of contracts/shares/lots/units to trade. The default value is 'NaN'.limit(series int/float) An optional parameter. Limit price of the order. If it is specified, the order type is either 'limit', or 'stop-limit'. 'NaN' should be specified for any other order type.stop(series int/float) An optional parameter. Stop price of the order. If it is specified, the order type is either 'stop', or 'stop-limit'. 'NaN' should be specified for any other order type.oca_nameoca_typecomment(series string) An optional parameter. Additional notes on the order.when(series bool) An optional parameter. Condition of the order. The order is placed if condition is "true". If condition is "false", nothing happens (the previously placed order with the same ID is not cancelled). Default value is "true".alert_message(series string) An optional parameter which replaces the {{strategy.order.alert_message}} placeholder when it is used in the "Create Alert" dialog box's "Message" field.
strategy.opentrades.entry_bar_index
Returns the bar_index of the open trade's entry.
strategy.opentrades.entry_bar_index(trade_num)
Wait for 10-bars and close the position.
Example
            pine

            strategy("`strategy.opentrades.entry_bar_index` Example")

barsSinceLastEntry() =>
    strategy.opentrades > 0 ? bar_index - strategy.opentrades.entry_bar_index(strategy.opentrades - 1) : na

// Enter a long position if there are no open positions.
if strategy.opentrades == 0
    strategy.entry("Long",  strategy.long)

// Close the long position after 10 bars.
if barsSinceLastEntry() >= 10
    strategy.close("Long")
Arguments
trade_num(series int) The trade number of the open trade. The number of the first trade is zero.
See also
strategy.closedtrades.entry_bar_index strategy.closedtrades.exit_bar_index
strategy.opentrades.entry_id
Returns the id of the open trade's entry.
strategy.opentrades.entry_id(trade_num)
Example
            pine

            strategy("`strategy.opentrades.entry_id` Example", overlay = true)

// We enter a long position when 14 period sma crosses over 28 period sma.
// We enter a short position when 14 period sma crosses under 28 period sma.
longCondition = ta.crossover(ta.sma(close, 14), ta.sma(close, 28))
shortCondition = ta.crossunder(ta.sma(close, 14), ta.sma(close, 28))

// Strategy calls to enter a long or short position when the corresponding condition is met.
if longCondition
    strategy.entry("Long entry at bar #" + str.tostring(bar_index), strategy.long)
if shortCondition
    strategy.entry("Short entry at bar #" + str.tostring(bar_index), strategy.short)

// Display ID of the latest open position.
if barstate.islastconfirmedhistory
    runtime.log("Last opened position is " + strategy.opentrades.entry_id(strategy.opentrades - 1))
Returns
Returns the ID of the open trade's entry.
Arguments
trade_num(series int) The trade number of the open trade. The number of the first trade is zero.
Remarks
The function returns na if trade_num is not in the range: 0 to strategy.opentrades-1.
See also
strategy.opentrades.entry_bar_index strategy.opentrades.entry_time
strategy.opentrades.entry_price
Returns the price of the open trade's entry.
strategy.opentrades.entry_price(trade_num)
Example
            pine

            strategy("strategy.closedtrades.entry_price Example 1")

// Strategy calls to enter long trades every 15 bars and exit long trades every 20 bars.
if bar_index % 15 == 0
    strategy.entry("Long", strategy.long)
if bar_index % 20 == 0
    strategy.close("Long")

// Return the entry price for the latest closed trade.
entryPrice = strategy.closedtrades.entry_price(strategy.closedtrades - 1)

plot(entryPrice, "Long entry price")
Calculate the average open position price.
Example
            pine

            strategy("strategy.opentrades.entry_price Example 2", pyramiding = 2)

// Strategy calls to enter long trades every 15 bars and exit long trades every 20 bars.
if bar_index % 15 == 0
    strategy.entry("Long", strategy.long)
if bar_index % 20 == 0
    strategy.close("Long")

// Calculate average open position price.
avgOpenPositionPrice() =>
    sumOpenPositionPrice = 0.0
    for tradeNo = 0 to strategy.opentrades - 1
        sumOpenPositionPrice += strategy.opentrades.entry_price(tradeNo) * strategy.opentrades.size(tradeNo) / strategy.position_size
    result = nz(sumOpenPositionPrice / strategy.opentrades)

plot(avgOpenPositionPrice())
Arguments
trade_num(series int) The trade number of the open trade. The number of the first trade is zero.
See also
strategy.closedtrades.exit_price
strategy.opentrades.entry_time
Returns the UNIX time of the open trade's entry.
strategy.opentrades.entry_time(trade_num)
Example
            pine

            strategy("strategy.opentrades.entry_time Example")

// Strategy calls to enter long trades every 15 bars and exit long trades every 20 bars.
if bar_index % 15 == 0
    strategy.entry("Long", strategy.long)
if bar_index % 20 == 0
    strategy.close("Long")

// Calculates duration in milliseconds since the last position was opened.
timeSinceLastEntry()=>
    strategy.opentrades > 0 ? (time - strategy.opentrades.entry_time(strategy.opentrades - 1)) : na

plot(timeSinceLastEntry() / 1000 * 60 * 60 * 24, "Days since last entry")
Arguments
trade_num(series int) The trade number of the open trade. The number of the first trade is zero.
See also
strategy.closedtrades.entry_time strategy.closedtrades.exit_time
strategy.opentrades.profit
Returns the profit/loss of the open trade. Losses are expressed as negative values.
strategy.opentrades.profit(trade_num)
Return the profit of the last opened trade.
Example
            pine

            strategy("`strategy.opentrades.profit` Example 1", commission_type = strategy.commission.percent, commission_value = 0.1)

// Strategy calls to enter long trades every 15 bars and exit long trades every 20 bars.
if bar_index % 15 == 0
    strategy.entry("Long", strategy.long)
if bar_index % 20 == 0
    strategy.close("Long")

plot(strategy.opentrades.profit(strategy.opentrades - 1), "Profit of the latest open trade")
Calculate the profit of all open positions.
Example
            pine

            strategy("`strategy.opentrades.profit` Example 2", pyramiding = 5)

// Strategy calls to enter 5 long positions every 2 bars.
if bar_index % 2 == 0
    strategy.entry("Long", strategy.long, qty = 5)

// Calculate open profit or loss for the open positions.
tradeOpenPL() =>
    sumProfit = 0.0
    for tradeNo = 0 to strategy.opentrades - 1
        sumProfit += strategy.opentrades.profit(tradeNo)
    result = sumProfit

plot(tradeOpenPL(), "Profit of all open trades")
Arguments
trade_num(series int) The trade number of the open trade. The number of the first trade is zero.
See also
strategy.closedtrades.profit strategy.openprofit strategy.netprofit strategy.grossprofit
strategy.opentrades.size
Returns the direction and the number of contracts traded in the open trade. If the value is > 0, the market position was long. If the value is < 0, the market position was short.
strategy.opentrades.size(trade_num)
Example
            pine

            strategy("`strategy.opentrades.size` Example 1")

// We calculate the max amt of shares we can buy.
amtShares = math.floor(strategy.equity / close)
// Strategy calls to enter long trades every 15 bars and exit long trades every 20 bars
if bar_index % 15 == 0
    strategy.entry("Long", strategy.long, qty = amtShares)
if bar_index % 20 == 0
    strategy.close("Long")

// Plot the number of contracts in the latest open trade.
plot(strategy.opentrades.size(strategy.opentrades - 1), "Amount of contracts in latest open trade")
Calculate the average profit percentage of open positions.
Example
            pine

            strategy("`strategy.opentrades.size` Example 2")

// Strategy calls to enter long trades every 15 bars and exit long trades every 20 bars.
if bar_index % 15 == 0
    strategy.entry("Long", strategy.long)
if bar_index % 20 == 0
    strategy.close("Long")

// Calculate profit for all open trades.
profitPct = 0.0
for tradeNo = 0 to strategy.opentrades - 1
    entryP = strategy.opentrades.entry_price(tradeNo)
    exitP = close
    profitPct += (exitP - entryP) / entryP * strategy.opentrades.size(tradeNo) * 100

// Calculate average profit percent for all open trades.
avgProfitPct = nz(profitPct / strategy.opentrades)
Arguments
trade_num(series int) The trade number of the open trade. The number of the first trade is zero.
See also
strategy.closedtrades.size strategy.position_size strategy.opentrades strategy.closedtrades
strategy.closedtrades.entry_bar_index
Returns the bar_index of the closed trade's entry.
strategy.closedtrades.entry_bar_index(trade_num)
Example
            pine

            strategy("strategy.closedtrades.entry_bar_index Example")
// Enter long trades on three rising bars; exit on two falling bars.
if ta.rising(close, 3)
    strategy.entry("Long", strategy.long)
if ta.falling(close, 2)
    strategy.close("Long")
// Function that calculates the average amount of bars in a trade.
avgBarsPerTrade() =>
    sumBarsPerTrade = 0
    for tradeNo = 0 to strategy.closedtrades - 1
        // Loop through all closed trades, starting with the oldest.
        sumBarsPerTrade += strategy.closedtrades.exit_bar_index(tradeNo) - strategy.closedtrades.entry_bar_index(tradeNo) + 1
    result = nz(sumBarsPerTrade / strategy.closedtrades)
plot(avgBarsPerTrade())
Arguments
trade_num(series int) The trade number of the closed trade. The number of the first trade is zero.
See also
strategy.closedtrades.exit_bar_index strategy.opentrades.entry_bar_index
strategy.closedtrades.exit_price
Returns the exit price of a closed trade.
strategy.closedtrades.exit_price(trade_num)
Example
            pine

            strategy("strategy.closedtrades.exit_price Example 1")

// We are creating a long trade every 5 bars
if bar_index % 5 == 0
    strategy.entry("Long",  strategy.long)
strategy.close("Long")

// Return the exit price from the latest closed trade.
exitPrice = strategy.closedtrades.exit_price(strategy.closedtrades - 1)

plot(exitPrice, "Long exit price")
Calculate the average profit percentage for all closed trades.
Example
            pine

            strategy("strategy.closedtrades.exit_price Example 2")

// Strategy calls to create single short and long trades.
if bar_index == last_bar_index - 15
    strategy.entry("Long Entry",  strategy.long)
else if bar_index == last_bar_index - 10
    strategy.close("Long Entry")
    strategy.entry("Short", strategy.short)
else if bar_index == last_bar_index - 5
    strategy.close("Short")

// Calculate profit for both closed trades.
profitPct = 0.0
for tradeNo = 0 to strategy.closedtrades - 1
    entryP = strategy.closedtrades.entry_price(tradeNo)
    exitP = strategy.closedtrades.exit_price(tradeNo)
    profitPct += (exitP - entryP) / entryP * strategy.closedtrades.size(tradeNo) * 100

// Calculate average profit percent for both closed trades.
avgProfitPct = nz(profitPct / strategy.closedtrades)

plot(avgProfitPct)
Arguments
trade_num(series int) Transaction number of the closed transaction. The number of the first transaction is zero.
See also
strategy.closedtrades.entry_price
strategy.closedtrades.exit_bar_index
Return the bar_index of the closed trade exit.
strategy.closedtrades.exit_bar_index(trade_num)
Example
            pine

            strategy("strategy.closedtrades.exit_bar_index Example 1")

// Strategy calls to place a single short trade. We enter the trade at the first bar and exit the trade at 10 bars before the last chart bar.
if bar_index == 0
    strategy.entry("Short",  strategy.short)
if bar_index == last_bar_index - 10
    strategy.close("Short")

// Calculate the amount of bars since the last closed trade.
barsSinceClosed = strategy.closedtrades > 0 ? bar_index - strategy.closedtrades.exit_bar_index(strategy.closedtrades - 1) : na

plot(barsSinceClosed, "Bars since last closed trade")
Calculate the average number of K-lines per transaction.
Example
            pine

            strategy("strategy.closedtrades.exit_bar_index Example 2")

// Enter long trades on three rising bars; exit on two falling bars.
if ta.rising(close, 3)
    strategy.entry("Long", strategy.long)
if ta.falling(close, 2)
    strategy.close("Long")

// Function that calculates the average amount of bars per trade.
avgBarsPerTrade() =>
    sumBarsPerTrade = 0
    for tradeNo = 0 to strategy.closedtrades - 1
        // Loop through all closed trades, starting with the oldest.
        sumBarsPerTrade += strategy.closedtrades.exit_bar_index(tradeNo) - strategy.closedtrades.entry_bar_index(tradeNo) + 1
    result = nz(sumBarsPerTrade / strategy.closedtrades)

plot(avgBarsPerTrade())
Arguments
trade_num(series int) The trade number of the closed trade. The number of the first trade is zero.
See also
bar_index
strategy.closedtrades.entry_id
Returns the id of the closed trade's entry.
strategy.closedtrades.entry_id(trade_num)
Example
            pine

            strategy("strategy.closedtrades.entry_id Example", overlay = true)
var isOpen = false
var openIndex = -1
// Enter a short position and close at the previous to last bar.
if not barstate.ishistory and not isOpen
    strategy.entry("Short at bar #" + str.tostring(bar_index), strategy.short)
    isOpen := true
    openIndex := bar_index
if openIndex != -1 and bar_index > openIndex + 100
    strategy.close_all()

// Display ID of the last entry position.
if barstate.islastconfirmedhistory
    runtime.log("Last Entry ID is: " + strategy.closedtrades.entry_id(strategy.closedtrades - 1))
Returns
Returns the id of the closed trade's entry.
Arguments
trade_num(series int) The trade number of the closed trade. The number of the first trade is zero.
Remarks
The function returns na if trade_num is not in the range: 0 to strategy.closedtrades-1.
See also
strategy.closedtrades.entry_bar_index strategy.closedtrades.entry_time
strategy.closedtrades.entry_price
Returns the price of the closed trade's entry.
strategy.closedtrades.entry_price(trade_num)
Example
            pine

            strategy("strategy.closedtrades.entry_price Example 1")

// Strategy calls to enter long trades every 15 bars and exit long trades every 20 bars.
if bar_index % 15 == 0
    strategy.entry("Long", strategy.long)
if bar_index % 20 == 0
    strategy.close("Long")

// Return the entry price for the latest  entry.
entryPrice = strategy.closedtrades.entry_price(strategy.closedtrades - 1)

plot(entryPrice, "Long entry price")
Calculate the average profit percentage for all closed trades.
Example
            pine

            strategy("strategy.closedtrades.entry_price Example 2")

// Strategy calls to create single short and long trades
if bar_index == last_bar_index - 15
    strategy.entry("Long Entry",  strategy.long)
else if bar_index == last_bar_index - 10
    strategy.close("Long Entry")
    strategy.entry("Short", strategy.short)
else if bar_index == last_bar_index - 5
    strategy.close("Short")

// Calculate profit for both closed trades.
profitPct = 0.0
for tradeNo = 0 to strategy.closedtrades - 1
    entryP = strategy.closedtrades.entry_price(tradeNo)
    exitP = strategy.closedtrades.exit_price(tradeNo)
    profitPct += (exitP - entryP) / entryP * strategy.closedtrades.size(tradeNo) * 100

// Calculate average profit percent for both closed trades.
avgProfitPct = nz(profitPct / strategy.closedtrades)

plot(avgProfitPct)
Arguments
trade_num(series int) The trade number of the closed trade. The number of the first trade is zero.
See also
strategy.closedtrades.exit_price strategy.closedtrades.size strategy.closedtrades
strategy.closedtrades.entry_time
Returns the UNIX time of the closed trade's entry.
strategy.closedtrades.entry_time(trade_num)
Example
pine
strategy("strategy.closedtrades.entry_time Example", overlay = true)
// Enter long trades on three rising bars; exit on two falling bars.
if ta.rising(close, 3)
strategy.entry("Long", strategy.long)
if ta.falling(close, 2)
strategy.close("Long")
// Calculate the average trade duration
avgTradeDuration() =>
sumTradeDuration = 0
for i = 0 to strategy.closedtrades - 1
sumTradeDuration += strategy.closedtrades.exit_time(i) - strategy.closedtrades.entry_time(i)
result = nz(sumTradeDuration / strategy.closedtrades)
// Display average duration converted to seconds and formatted using 2 decimal points
if barstate.islastconfirmedhistory
runtime.log(str.tostring(avgTradeDuration() / 1000, "#.##") + " seconds")
Arguments
trade_num(series int) The trade number of the closed trade. The number of the first trade is zero.
See also
strategy.opentrades.entry_time strategy.closedtrades.exit_time time
strategy.closedtrades.profit
Returns the profit/loss of the closed trade. Losses are expressed as negative values.
strategy.closedtrades.profit(trade_num)
Example
pine
strategy("`strategy.closedtrades.profit` Example")
// Strategy calls to enter long trades every 15 bars and exit long trades every 20 bars.
if bar_index % 15 == 0
strategy.entry("Long", strategy.long)
if bar_index % 20 == 0
strategy.close("Long")
// Calculate average gross profit by adding the difference between gross profit and commission.
avgGrossProfit() =>
sumGrossProfit = 0.0
for tradeNo = 0 to strategy.closedtrades - 1
sumGrossProfit += strategy.closedtrades.profit(tradeNo) - strategy.closedtrades.commission(tradeNo)
result = nz(sumGrossProfit / strategy.closedtrades)
plot(avgGrossProfit(), "Average gross profit")
Arguments
trade_num(series int) The trade number of the closed trade. The number of the first trade is zero.
See also
strategy.opentrades.profit strategy.closedtrades.commission
strategy.closedtrades.size
Returns the direction and the number of contracts traded in the closed trade. If the value is > 0, the market position was long. If the value is < 0, the market position was short.
strategy.closedtrades.size(trade_num)
Example
pine
strategy("`strategy.closedtrades.size` Example 1")
// We calculate the max amt of shares we can buy.
amtShares = math.floor(strategy.equity / close)
// Strategy calls to enter long trades every 15 bars and exit long trades every 20 bars
if bar_index % 15 == 0
strategy.entry("Long", strategy.long, qty = amtShares)
if bar_index % 20 == 0
strategy.close("Long")
// Plot the number of contracts traded in the last closed trade.
plot(strategy.closedtrades.size(strategy.closedtrades - 1), "Number of contracts traded")
Calculate the average profit percentage on closed trades.
Example
pine
strategy("`strategy.closedtrades.size` Example 2")
// Strategy calls to enter long trades every 15 bars and exit long trades every 20 bars.
if bar_index % 15 == 0
strategy.entry("Long", strategy.long)
if bar_index % 20 == 0
strategy.close("Long")
// Calculate profit for both closed trades.
profitPct = 0.0
for tradeNo = 0 to strategy.closedtrades - 1
entryP = strategy.closedtrades.entry_price(tradeNo)
exitP = strategy.closedtrades.exit_price(tradeNo)
profitPct += (exitP - entryP) / entryP * strategy.closedtrades.size(tradeNo) * 100
// Calculate average profit percent for both closed trades.
avgProfitPct = nz(profitPct / strategy.closedtrades)
plot(avgProfitPct)
Arguments
trade_num(series int) The trade number of the closed trade. The number of the first trade is zero.
See also
strategy.opentrades.size strategy.position_size strategy.closedtrades strategy.opentrades
strategy.closedtrades.exit_time
Returns the UNIX time of the closed trade's exit.
strategy.closedtrades.exit_time(trade_num)
Example
pine
strategy("strategy.closedtrades.exit_time Example 1")
// Enter long trades on three rising bars; exit on two falling bars.
if ta.rising(close, 3)
strategy.entry("Long", strategy.long)
if ta.falling(close, 2)
strategy.close("Long")
// Calculate the average trade duration.
avgTradeDuration() =>
sumTradeDuration = 0
for i = 0 to strategy.closedtrades - 1
sumTradeDuration += strategy.closedtrades.exit_time(i) - strategy.closedtrades.entry_time(i)
result = nz(sumTradeDuration / strategy.closedtrades)
// Display average duration converted to seconds and formatted using 2 decimal points.
if barstate.islastconfirmedhistory
label.new(bar_index, high, str.tostring(avgTradeDuration() / 1000, "#.##") + " seconds")
Reopen closed trades after X seconds.
Example
strategy("strategy.closedtrades.exit_time Example 2")
// Strategy calls to emulate a single long trade at the first bar.
if bar_index == 0
strategy.entry("Long", strategy.long)
reopenPositionAfter(timeSec) =>
if strategy.closedtrades > 0
if time - strategy.closedtrades.exit_time(strategy.closedtrades - 1) >= timeSec * 1000
strategy.entry("Long", strategy.long)
// Reopen last closed position after 120 sec.
reopenPositionAfter(120)
if ta.change(strategy.opentrades)
strategy.exit("Long", stop = low * 0.9, profit = high * 2.5)
Arguments
trade_num(series int) The trade number of the closed trade. The number of the first trade is zero.
See also
strategy.closedtrades.entry_time
strategy.risk.allow_entry_in
This function can be used to specify in which market direction the strategy.entry function is allowed to open positions.
strategy.risk.allow_entry_in(value)
Example
pine
strategy("strategy.risk.allow_entry_in")
strategy.risk.allow_entry_in(strategy.direction.long)
strategy.entry("Long", strategy.long, when = open > close)
// Instead of opening a short position with 10 contracts, this command will close long entries.
strategy.entry("Short", strategy.short, when = open < close, qty = 10)
Arguments
value(simple string) The allowed direction. Possible values:strategy.direction.all,strategy.direction.long,strategy.direction.short
strategy.risk.max_position_size
The purpose of this rule is to determine maximum size of a market position. The rule affects the following function: strategy.entry. The 'entry' quantity can be reduced (if needed) to such number of contracts/shares/lots/units, so the total position size doesn't exceed the value specified in 'strategy.risk.max_position_size'. If minimum possible quantity still violates the rule, the order will not be placed.
strategy.risk.max_position_size(contracts)
Example
pine
strategy("risk.max_position_size Demo", default_qty_value = 100)
strategy.risk.max_position_size(10)
strategy.entry("buy", strategy.long, when = open > close)
plot(strategy.position_size) // max plot value will be 10
Arguments
contracts(simple int/float) A required parameter. Maximum number of contracts/shares/lots/units in a position.
math
math.abs
Absolute value of number is number if number >= 0, or -number otherwise.
math.abs(number)
Returns
The absolute value of number.
math.acos
The acos function returns the arccosine (in radians) of number such that cos(acos(y)) = y for y in range [-1, 1].
math.acos(angle)
Returns
The arc cosine of a value; the returned angle is in the range [0, Pi], or na if y is outside of range [-1, 1].
math.random
Returns a pseudo-random value. The function will generate a different sequence of values for each script execution. Using the same value for the optional seed argument will produce a repeatable sequence.
math.random(min, max, seed)
Returns
A random value.
Arguments
min(series int/float) The lower bound of the range of random values. The value is not included in the range. The default is 0.max(series int/float) The upper bound of the range of random values. The value is not included in the range. The default is 1.seed(input int) Optional argument. When the same seed is used, allows successive calls to the function to produce a repeatable set of values.
math.asin
The asin function returns the arcsine (in radians) of number such that sin(asin(y)) = y for y in range [-1, 1].
math.asin(angle)
Returns
The arcsine of a value; the returned angle is in the range [-Pi/2, Pi/2], or na if y is outside of range [-1, 1].
math.atan
The atan function returns the arctangent (in radians) of number such that tan(atan(y)) = y for any y.
math.atan(angle)
Returns
The arc tangent of a value; the returned angle is in the range [-Pi/2, Pi/2].
math.ceil
The ceil function returns the smallest (closest to negative infinity) integer that is greater than or equal to the argument.
math.ceil(number)
Returns
The smallest integer less than or equal to the given number.
See also
math.floor math.round
math.cos
The cos function returns the trigonometric cosine of an angle.
math.cos(angle)
Returns
The trigonometric cosine of an angle.
Arguments
angle(series int/float) Angle, in radians.
math.exp
The exp function of number is e raised to the power of number, where e is Euler's number.
math.exp(number)
Returns
A value representing e raised to the power of number.
See also
math.pow
math.floor
math.floor(number)
Returns
The largest integer less than or equal to the given number.
See also
math.ceil math.round
math.log
Natural logarithm of any number > 0 is the unique y such that e^y = number.
math.log(number)
Returns
The natural logarithm of number.
See also
math.log10
math.log10
The common (or base 10) logarithm of number is the power to which 10 must be raised to obtain the number. 10^y = number.
math.log10(number)
Returns
The base 10 logarithm of number.
See also
math.log
math.pow
Mathematical power function.
math.pow(base, exponent)
Example
pine
// math.pow
plot(math.pow(close, 2))
Returns
base raised to the power of exponent. If base is a series, it is calculated elementwise.
Arguments
base(series int/float) Specify the base to use.exponent(series int/float) Specifies the exponent.
math.sign
Sign (signum) of "number" is zero if "number" is zero, 1.0 if "number" is greater than zero, -1.0 if "number" is less than zero.
math.sign(number)
Returns
The sign of the argument.
math.sin
The sin function returns the trigonometric sine of an angle.
math.sin(angle)
Returns
The trigonometric sine of an angle.
Arguments
angle(series int/float) Angle, in radians.
math.sqrt
Square root of any number >= 0 is the unique y >= 0 such that y^2 = number.
math.sqrt(number)
Returns
The square root of number.
See also
math.pow
math.tan
The tan function returns the trigonometric tangent of an angle.
math.tan(angle)
Returns
The trigonometric tangent of an angle.
Arguments
angle(series int/float) Angle, in radians.
math.round
Returns the value of number rounded to the nearest integer, with ties rounding up. If the precision parameter is used, returns a float value rounded to that amount of decimal places.
math.round(number)
math.round(number, precision)
Returns
The value of number rounded to the nearest integer, or according to precision.
Arguments
number(series int/float) The value to be rounded.precision(series int) Optional argument. Decimal places to whichnumberwill be rounded. When no argument is supplied, rounding is to the nearest integer.
Remarks
Note that for 'na' values function returns 'na'.
See also
math.ceil math.floor
math.max
Returns the greatest of multiple values.
math.max(number0, number1, ...)
Example
pine
// math.max
plot(math.max(close, open))
plot(math.max(close, math.max(open, 42)))
Returns
The greatest of multiple given values.
See also
math.min
math.min
Returns the smallest of multiple values.
math.min(number0, number1, ...)
Example
pine
// math.min
plot(math.min(close, open))
plot(math.min(close, math.min(open, 42)))
Returns
The smallest of multiple given values.
See also
math.max
math.avg
Calculates average of all given series (elementwise).
math.avg(number0, number1, ...)
Returns
Average.
See also
math.sum ta.cum ta.sma
math.round_to_mintick
Returns the value rounded to the symbol's mintick, i.e. the nearest value that can be divided by syminfo.mintick, without the remainder, with ties rounding up.
math.round_to_mintick(number)
Returns
The number rounded to tick precision.
Arguments
number(series int/float) The value to be rounded.
See also
math.ceil math.floor
math.sum
The sum function returns the sliding sum of last y values of x.
math.sum(source, length)
Returns
Sum of source for length bars back.
Arguments
source(series int/float) Series of values to process.length(series int) Number of bars (length).
math.todegrees
Returns an approximately equivalent angle in degrees from an angle measured in radians.
math.todegrees(radians)
Returns
The angle value in degrees.
Arguments
radians(series int/float) Angle in radians.
math.toradians
Returns an approximately equivalent angle in radians from an angle measured in degrees.
math.toradians(degrees)
Returns
The angle value in radians.
Arguments
degrees(series int/float) Angle in degrees.
others
fixnan
For a given series replaces NaN values with previous nearest non-NaN value.
fixnan(source)
Returns
Series without na gaps.
Arguments
source(series int/float/bool/color)
nz
Replaces NaN values with zeros (or given value) in a series.
nz(source, replacement)
nz(source)
Example
pine
// nz
plot(nz(ta.sma(close, 100)))
Returns
The value of source if it is not na. If the value of source is na, returns zero, or the replacement argument when one is used.
Arguments
source(series int/float/bool/color) Series of values to process.replacement(series int/float/bool/color) Value that will replace all ‘na’ values in thesourceseries.
na
Test value if it's a NaN.
na(x)
Returns
true if x is not a valid number (x is NaN), otherwise false.
int
Casts na or truncates float value to int.
int(x)
Returns
The value of the argument after casting to int.
See also
float bool color string
float
Casts na to float.
float(x)
Returns
The value of the argument after casting to float.
See also
int bool color string
alert
Triggers an alert event when called during the real-time bar and an alert based on alert function events was previously created for the indicator or strategy through the “Create Alert” dialog box.
alert(message, freq)
Example
pine
// alert() example
ma = ta.sma(close, 14)
xUp = ta.crossover(close, ma)
if xUp
// Trigger the alert the first time a cross occurs during the real-time bar.
alert("Price (" + str.tostring(close) + ") crossed over MA (" + str.tostring(ma) + ").", alert.freq_once_per_bar)
plot(ma)
plotchar(xUp, "xUp", "▲", location.top, size = size.tiny)
Arguments
message(series string)Message sent when the alert triggers. Required argument.freq(input string) The triggering frequency. Possible values are: alert.freq_all (all function calls trigger the alert), alert.freq_once_per_bar (the first function call during the bar triggers the alert), alert.freq_once_per_bar_close (the function call triggers the alert only when it occurs during the last script iteration of the real-time bar, when it closes). The default is alert.freq_once_per_bar.
Remarks
The Help Center explains how to create such alerts.
Contrary to alertcondition, alert calls do NOT count as an additional plot.
Function calls can be located in both global and local scopes.
Function calls do not display anything on the chart.
The 'freq' argument only affects the triggering frequency of the function call where it is used.
See also
alertcondition
alertcondition
Creates alert condition, that is available in Create Alert dialog. Please note, that alertcondition does NOT create an alert, it just gives you more options in Create Alert dialog. Also, alertcondition effect is invisible on chart.
alertcondition(condition, title, message)
Example
pine
// alertcondition
alertcondition(close >= open, title='Alert on Green Bar', message='Green Bar!')
Arguments
condition(series bool) Series of boolean values that is used for alert. True values mean alert fire, false - no alert. Required argument.title(const string) Title of the alert condition. Optional argument.message(const string) Message to display when alert fires. Optional argument.
Remarks
Please note that in Pine Script v4/v5 an alertcondition call generates an additional plot. All such calls are taken into account when we calculate the number of the output series per script.
See also
alert
indicator
In order to be compatible with the Trading View strategy code, it is not actually required to be called.
See also
strategy
time
The time function returns the UNIX time of the current bar for the specified timeframe and session or NaN if the time point is out of session. Note that FMZ does not support session arguments.
time(timeframe, session, timezone)
time(timeframe, session)
time(timeframe)
Example
pine
timeinrange(res, sess) => not na(time(res, sess, "America/New_York")) ? 1 : 0
plot(timeinrange("1", "1300-1400"), color=color.red)
// This plots 1.0 at every start of 10 minute bar on a 1 minute chart:
newbar(res) => ta.change(time(res)) == 0 ? 0 : 1
plot(newbar("10"))
While setting up a session you can specify not just the hours and minutes but also the days of the week that will be included in that session.
If the days aren't specified, the session is considered to have been set from Sunday (1) to Saturday (7), i.e. "1100-2000" is the same as "1100-1200:1234567".
You can change that by specifying the days. For example, on a symbol that is traded seven days a week with the 24-hour trading session the following script will not color Saturdays and Sundays:
Example
pine
// Time
t1 = time(timeframe.period, "0000-0000:23456")
bgcolor(t1 ? color.new(color.blue, 90) : na)
One session argument can include several different sessions, separated by commas. For example, the following script will highlight the bars from 10:00 to 11:00 and from 14:00 to 15:00 (workdays only):
Example
pine
// Time
t1 = time(timeframe.period, "1000-1100,1400-1500:23456")
bgcolor(t1 ? color.new(color.blue, 90) : na)
Returns
UNIX time.
Arguments
timeframe(simple string) Timeframe. An empty string is interpreted as the current timeframe of the chart.sessiontimezone(simple string) Timezone of thesessionargument. It can only be used when a "session" is specified. Optional. The default is syminfo.timezone. Can be specified in GMT notation (e.g. "GMT-5") or as an IANA time zone database name (e.g. "America/New_York").
Remarks
UNIX time is the number of milliseconds that have elapsed since 00:00:00 UTC, 1 January 1970.
year
year(time)
year(time, timezone)
Returns
Year (in exchange timezone) for provided UNIX time.
Arguments
time(series int) UNIX time in milliseconds.timezone(series string) An optional argument. Timezone.
Reamrks
UNIX time is the number of milliseconds that have elapsed since 00:00:00 UTC, 1 January 1970. By default, the Timezone is syminfo.timezone, possible values can be seen in timestamp.
Note that this function returns the year based on the time of the bar's open. For overnight sessions (e.g. EURUSD, where Monday session starts on Sunday, 17:00 UTC-4) this value can be lower by 1 than the year of the trading day.
See also
year time month dayofmonth dayofweek hour minute second
month
month(time)
month(time, timezone)
Returns
Month (in exchange timezone) for provided UNIX time.
Arguments
time(series int) UNIX time in milliseconds.timezone(series string) An optional argument. Timezone.
Remarks
UNIX time is the number of milliseconds that have elapsed since 00:00:00 UTC, 1 January 1970. By default, the Timezone is syminfo.timezone, possible values can be seen in timestamp.
Note that this function returns the month based on the time of the bar's open. For overnight sessions (e.g. EURUSD, where Monday session starts on Sunday, 17:00 UTC-4) this value can be lower by 1 than the month of the trading day.
See also
month time year dayofmonth dayofweek hour minute second
hour
hour(time)
hour(time, timezone)
Returns
Hour (in exchange timezone) for provided UNIX time.
Arguments
time(series int) UNIX time in milliseconds.timezone(series string) An optional parameter. Timezone.
Remarks
UNIX time is the number of milliseconds that have elapsed since 00:00:00 UTC, 1 January 1970. By default, the Timezone is syminfo.timezone, possible values can be seen in timestamp.
See also
hour time year month dayofmonth dayofweek minute second
minute
minute(time)
minute(time, timezone)
Returns
Minute (in exchange timezone) for provided UNIX time.
Arguments
time(series int) UNIX time in milliseconds.timezone(series string) An optional argument. Timezone.
Remarks
UNIX time is the number of milliseconds that have elapsed since 00:00:00 UTC, 1 January 1970. By default, the Timezone is syminfo.timezone, possible values can be seen in timestamp.
See also
minute time year month dayofmonth dayofweek hour second
second
second(time)
second(time, timezone)
Returns
Second (in exchange timezone) for provided UNIX time.
Arguments
time(series int) UNIX time in milliseconds.timezone(series string) An optional parameter. Timezone.
Remarks
UNIX time is the number of milliseconds that have elapsed since 00:00:00 UTC, 1 January 1970. By default, the Timezone is syminfo.timezone, possible values can be seen in timestamp.
See also
second time year month dayofmonth dayofweek hour minute
weekofyear
weekofyear(time)
weekofyear(time, timezone)
Returns
Week of year (in exchange timezone) for provided UNIX time.
Arguments
time(series int) UNIX time in milliseconds.timezone(series string) An optional parameter. Timezone.
Remarks
UNIX time is the number of milliseconds that have elapsed since 00:00:00 UTC, 1 January 1970. By default, the Timezone is syminfo.timezone, possible values can be seen in timestamp.
Note that this function returns the week based on the time of the bar's open. For overnight sessions (e.g. EURUSD, where Monday session starts on Sunday, 17:00) this value can be lower by 1 than the week of the trading day.
See also
weekofyear time year month dayofmonth dayofweek hour minute second
dayofweek
dayofweek(time)
dayofweek(time, timezone)
Returns
Day of week (in exchange timezone) for provided UNIX time.
Arguments
time(series int) UNIX time in milliseconds.timezone(series string) An optional parameter. Timezone.
Remarks
Note that this function returns the day based on the time of the bar's open. For overnight sessions (e.g. EURUSD, where Monday session starts on Sunday, 17:00) this value can be lower by 1 than the day of the trading day.
UNIX time is the number of milliseconds that have elapsed since 00:00:00 UTC, 1 January 1970. By default, the Timezone is syminfo.timezone, possible values can be seen in timestamp.
See also
time dayofmonth
dayofmonth
dayofmonth(time)
dayofmonth(time, timezone)
Returns
Day of month (in exchange timezone) for provided UNIX time.
Arguments
time(series int) unix time in milliseconds.timezone(series string) An optional parameter. Timezone.
Remarks
UNIX time is the number of milliseconds that have elapsed since 00:00:00 UTC, 1 January 1970. By default, the Timezone is syminfo.timezone, possible values can be seen in timestamp.
Note that this function returns the day based on the time of the bar's open. For overnight sessions (e.g. EURUSD, where Monday session starts on Sunday, 17:00 UTC-4) this value can be lower by 1 than the day of the trading day.
timestamp
Function timestamp returns UNIX time of specified date and time.
timestamp(dateString)
timestamp(year, month, day, hour, minute, second)
timestamp(timezone, year, month, day, hour, minute, second)
Example
pine
// timestamp
plot(timestamp(2016, 01, 19, 09, 30), linewidth=3, color=color.green)
plot(timestamp(syminfo.timezone, 2016, 01, 19, 09, 30), color=color.blue)
plot(timestamp(2016, 01, 19, 09, 30), color=color.yellow)
plot(timestamp("GMT+6", 2016, 01, 19, 09, 30))
plot(timestamp(2019, 06, 19, 09, 30, 15), color=color.lime)
plot(timestamp("GMT+3", 2019, 06, 19, 09, 30, 15), color=color.fuchsia)
plot(timestamp("Feb 01 2020 22:10:05"))
plot(timestamp("2011-10-10T14:48:00"))
plot(timestamp("04 Dec 1995 00:12:00 GMT+5"))
Returns
Unix time.
Arguments
timezone(series string) Timezone. Optional. The default is syminfo.timezone. Can be specified in GMT notation (e.g. "GMT-5") or as an IANA time zone database name (e.g. "America/New_York").year(series int) Year.month(series int) Month.day(series int) Day.hour(series int) (Optional argument) Hour. Default is 0.minute(series int) (Optional argument) Minute. Default is 0.second(series int) (Optional argument) Second. Default is 0.dateString(const string) A string containing the date and, optionally, the time and time zone. Its format must comply with either the IETF RFC 2822 or ISO 8601 standards ("DD MMM YYYY hh:mm:ss ±hhmm" or "YYYY-MM-DDThh:mm:ss±hh:mm", so "20 Feb 2020" or "2020-02-20"). If no time is supplied, "00:00" is used. If no time zone is supplied, GMT+0 will be used. Note that this diverges from the usual behavior of the function where it returns time in the exchange's timezone.
Remarks
UNIX time is the number of milliseconds that have elapsed since 00:00:00 UTC, 1 January 1970.
See also
time timenow syminfo.timezone
fill
Fills background between two plots or hlines with a given color.
fill(hline1, hline2, color, title, editable, fillgaps, display)
fill(plot1, plot2, color, title, editable, show_last, fillgaps, display)
Example
pine
h1 = hline(20)
h2 = hline(10)
fill(h1, h2, color=color.new(color.blue, 90))
p1 = plot(open)
p2 = plot(close)
fill(p1, p2, color=color.new(color.green, 90))
Arguments
hline1(hline) The first hline object. Required argument.hline2(hline) The second hline object. Required argument.plot1(plot) The first plot object. Required argument.plot2(plot) The second plot object. Required argument.color(series color) Color of the plot. You can use constants like 'color=color.red' or 'color=#ff001a' as well as complex expressions like 'color = close >= open ? color.green : color.red'. Optional argument.title(const string) Title of the created fill object. Optional argument.editable(const bool) If true then fill style will be editable in Format dialog. Default is true.show_last(input int) If set, defines the number of bars (from the last bar back to the past) to fill on chart.fillgaps(const bool) Controls continuing fills on gaps, i.e., when one of the plot() calls returns an na value. When true, the last fill will continue on gaps. The default is false.display(plot_display) Controls where the fill is displayed. Possible values are: display.none, display.all. Default is display.all.
See also
plot barcolor bgcolor hline
hline
Renders a horizontal line at a given fixed price level.
hline(price, title, color, linestyle, linewidth, editable, display)
Example
pine
// input.hline
hline(3.14, title='Pi', color=color.blue, linestyle=hline.style_dotted, linewidth=2)
// You may fill the background between any two hlines with a fill() function:
h1 = hline(20)
h2 = hline(10)
fill(h1, h2, color=color.new(color.green, 90))
Returns
An hline object, that can be used in fill.
Arguments
price(input int/float) Price value at which the object will be rendered. Required argument.title(const string) Title of the object.color(input color) Color of the rendered line. Must be a constant value (not an expression). Optional argument.linestyle(hline_style) Style of the rendered line. Possible values are: solid, dotted, dotted. Optional argument.linewidth(input int) Width of the rendered line. Default value is 1.editable(const bool) If true then hline style will be editable in Format dialog. Default is true.display(plot_display) Controls where the hline is displayed. Possible values are: display.none, display.all. Default is display.all.overlay(const bool) is the extension argument of FMZ platform, it is used to set the current function to be displayed on the main image (set to true) or sub-image (set to false), the default value is false. If this argument is not specified, it will be set according to theoverlayargument instrategyorindicator, ifstrategyorindicatordoes not set theoverlayargument, it will be processed according to the default arguments.
bgcolor
Fill background of bars with specified color.
bgcolor(color, offset, editable, show_last, title, display, overlay)
Example
pine
// bgcolor example
bgcolor(close < open ? color.new(color.red,70) : color.new(color.green, 70))
Arguments
color(series color) Color of the filled background. You can use constants like "red" or "#ff001a" as well as complex expressions like 'close >= open ? color.green : color.red'. Required argument.offset(series int) Shifts the color series to the left or to the right on the given number of bars. Default is 0.editable(const bool) If true then bgcolor style will be editable in Format dialog. Default is true.show_last(input int) If set, defines the number of bars (from the last bar back to the past) to fill on chart.title(const string) Title of the bgcolor. Optional argument.display(plot_display) Controls where the bgcolor is displayed. Possible values are: display.none, display.all. Default is display.all.overlay(const bool) is the extension argument of FMZ platform, it is used to set the current function to be displayed on the main image (set to true) or sub-image (set to false), the default value is false. If this argument is not specified, it will be set according to theoverlayargument instrategyorindicator, ifstrategyorindicatordoes not set theoverlayargument, it will be processed according to the default arguments.
See also
plot
barcolor
Set color of bars.
barcolor(color, offset, editable, show_last, title, display)
Example
pine
barcolor(close < open ? color.black : color.white)
Arguments
color(series color) Color of bars. You can use constants like 'red' or '#ff001a' as well as complex expressions like 'close >= open ? color.green : color.red'. Required argument.offset(series int) Shifts the color series to the left or to the right on the given number of bars. Default is 0.editable(const bool) If true then barcolor style will be editable in Format dialog. Default is true.show_last(input int) If set, defines the number of bars (from the last bar back to the past) to fill on chart.display(plot_display) Controls where the barcolor is displayed. Possible values are: display.none, display.all. Default is display.all.
error
Compatible with error of PINE v4, and the function is the same as runtime.error.
Built-in variables
order
order.ascending
Determines the sort order of the array from the smallest to the largest value.
Type
sort_order
See also
array.new_float array.sort
order.descending
Determines the sort order of the array from the largest to the smallest value.
Type
sort_order
See also
array.new_float array.sort
timeframe
timeframe.isdaily
Returns true if current resolution is a daily resolution, false otherwise.
Type
simple bool
See also
timeframe.isdwm timeframe.isintraday timeframe.isminutes timeframe.isseconds timeframe.isweekly timeframe.ismonthly
timeframe.isdwm
Returns true if current resolution is a daily or weekly or monthly resolution, false otherwise.
Type
simple bool
See also
timeframe.isintraday timeframe.isminutes timeframe.isseconds timeframe.isdaily timeframe.isweekly timeframe.ismonthly
timeframe.isintraday
Returns true if current resolution is an intraday (minutes or seconds) resolution, false otherwise.
Type
simple bool
See also
timeframe.isminutes timeframe.isseconds timeframe.isdwm timeframe.isdaily timeframe.isweekly timeframe.ismonthly
timeframe.isminutes
Returns true if current resolution is a minutes resolution, false otherwise.
Type
simple bool
See also
timeframe.isdwm timeframe.isintraday timeframe.isseconds timeframe.isdaily timeframe.isweekly timeframe.ismonthly
timeframe.ismonthly
Returns true if current resolution is a monthly resolution, false otherwise.
Type
simple bool
See also
timeframe.isdwm timeframe.isintraday timeframe.isminutes timeframe.isseconds timeframe.isdaily timeframe.isweekly
timeframe.isseconds
Returns true if current resolution is a seconds resolution, false otherwise.
Type
simple bool
See also
timeframe.isdwm timeframe.isintraday timeframe.isminutes timeframe.isdaily timeframe.isweekly timeframe.ismonthly
timeframe.isweekly
Returns true if current resolution is a weekly resolution, false otherwise.
Type
simple bool
See also
timeframe.isdwm timeframe.isintraday timeframe.isminutes timeframe.isseconds timeframe.isdaily timeframe.ismonthly
timeframe.multiplier
Multiplier of resolution, e.g. '60' - 60, 'D' - 1, '5D' - 5, '12M' - 12.
Type
simple int
See also
syminfo.ticker syminfo.tickerid timeframe.period
timeframe.period
Resolution, e.g. '60' - 60 minutes, 'D' - daily, 'W' - weekly, 'M' - monthly, '5D' - 5 days, '12M' - one year, '3M' - one quarter.
Type
simple string
See also
syminfo.ticker syminfo.tickerid timeframe.multiplier
display
display.none
A named constant that specifies where the plot is displayed. Display nowhere. Available in alert template message.
Type
plot_display
See also
plot plotshape plotchar
display.all
A named constant that specifies where the plot is displayed. Display everywhere.
Type
plot_display
See also
plot plotshape plotchar plotarrow plotbar plotcandle
shape
shape.xcross
Shape style for plotshape function.
Type
const string
See also
plotshape
shape.cross
Shape style for plotshape function.
Type
const string
See also
plotshape
shape.triangleup
Shape style for plotshape function.
Type
const string
See also
plotshape
shape.triangledown
Shape style for plotshape function.
Type
const string
See also
plotshape
shape.flag
Shape style for plotshape function.
Type
const string
See also
plotshape
shape.circle
Shape style for plotshape function.
Type
const string
See also
plotshape
shape.arrowup
Shape style for plotshape function.
Type
const string
See also
plotshape
shape.arrowdown
Shape style for plotshape function.
Type
const string
See also
plotshape
shape.labelup
Shape style for plotshape function.
Type
const string
See also
plotshape
shape.labeldown
Shape style for plotshape function.
Type
const string
See also
plotshape
shape.square
Shape style for plotshape function.
Type
const string
See also
plotshape
shape.diamond
Shape style for plotshape function.
Type
const string
See also
plotshape
color
color.aqua
Is a named constant for #00BCD4 color.
Type
const color
color.black
Is a named constant for #363A45 color.
Type
const color
color.blue
Is a named constant for #2962ff color.
Type
const color
color.fuchsia
Is a named constant for #E040FB color.
Type
const color
color.gray
Is a named constant for #787B86 color.
Type
const color
color.green
Is a named constant for #4CAF50 color.
Type
const color
color.lime
Is a named constant for #00E676 color.
Type
const color
color.maroon
Is a named constant for #880E4F color.
Type
const color
color.navy
Is a named constant for #311B92 color.
Type
const color
color.olive
Is a named constant for #808000 color.
Type
const color
color.orange
Is a named constant for #FF9800 color.
Type
const color
color.purple
Is a named constant for #9C27B0 color.
Type
const color
color.red
Is a named constant for #FF5252 color.
Type
const color
color.silver
Is a named constant for #B2B5BE color.
Type
const color
color.teal
color.teal
Is a named constant for #00897B color.
Type
const color
color.white
Is a named constant for #FFFFFF color.
Type
const color
color.yellow
Is a named constant for #FFEB3B color.
Type
const color
plot
plot.style_line
A named constant for the 'Line' style, to be used as an argument for the style parameter in the plot function.
Type
plot_style
See also
plot plot.style_linebr plot.style_stepline plot.style_stepline_diamond plot.style_histogram plot.style_cross plot.style_area plot.style_areabr plot.style_columns plot.style_circles
plot.style_linebr
A named constant for the 'Line With Breaks' style, to be used as an argument for the style parameter in the plot function. Similar to plot.style_line, except the gaps in the data are not filled.
Type
plot_style
See also
plot plot.style_line plot.style_stepline plot.style_stepline_diamond plot.style_histogram plot.style_cross plot.style_area plot.style_areabr plot.style_columns plot.style_circles
plot.style_histogram
A named constant for the 'Histogram' style, to be used as an argument for the style parameter in the plot function.
Type
plot_style
See also
plot plot.style_line plot.style_linebr plot.style_stepline plot.style_stepline_diamond plot.style_cross plot.style_area plot.style_areabr plot.style_columns plot.style_circles
plot.style_columns
A named constant for the 'Columns' style, to be used as an argument for the style parameter in the plot function.
Type
plot_style
See also
plot plot.style_line plot.style_linebr plot.style_stepline plot.style_stepline_diamond plot.style_histogram plot.style_cross plot.style_area plot.style_areabr plot.style_circles
plot.style_circles
A named constant for the 'Circles' style, to be used as an argument for the style parameter in the plot function.
Type
plot_style
See also
plot plot.style_line plot.style_linebr plot.style_stepline plot.style_stepline_diamond plot.style_histogram plot.style_cross plot.style_area plot.style_areabr plot.style_columns
plot.style_area
A named constant for the 'Area' style, to be used as an argument for the style parameter in the plot function.
Type
plot_style
See also
plot plot.style_line plot.style_linebr plot.style_stepline plot.style_stepline_diamond plot.style_histogram plot.style_areabr plot.style_cross plot.style_columns plot.style_circles
plot.style_areabr
A named constant for the 'Area With Breaks' style, to be used as an argument for the style parameter in the plot function. Similar to plot.style_area, except the gaps in the data are not filled.
Type
plot_style
See also
plot plot.style_line plot.style_linebr plot.style_stepline plot.style_stepline_diamond plot.style_histogram plot.style_cross plot.style_area plot.style_columns plot.style_circles
plot.style_cross
A named constant for the 'Cross' style, to be used as an argument for the style parameter in the plot function.
Type
plot_style
See also
plot plot.style_line plot.style_linebr plot.style_stepline plot.style_stepline_diamond plot.style_histogram plot.style_area plot.style_areabr plot.style_columns plot.style_circles
plot.style_stepline
A named constant for the 'Step Line' style, to be used as an argument for the style parameter in the plot function.
Type
plot_style
See also
plot plot.style_stepline_diamond plot.style_linebr plot.style_histogram plot.style_cross plot.style_area plot.style_areabr plot.style_columns plot.style_circles
plot.style_stepline_diamond
A named constant for the 'Step Line With Diamonds' style, to be used as an argument for the style parameter in the plot function. Similar to plot.style_stepline, except the data changes are also marked with the Diamond shapes.
Type
plot_style
See also
plot plot.style_line plot.style_linebr plot.style_histogram plot.style_cross plot.style_area plot.style_areabr plot.style_columns plot.style_circles
location
location.abovebar
location.abovebar
Location value for plotshape, plotchar functions. Shape is plotted above main series bars.
Type
const string
See also
plotshape plotchar location.belowbar location.top location.bottom location.absolute
location.belowbar
Location value for plotshape, plotchar functions. Shape is plotted below main series bars.
Type
const string
See also
plotshape plotchar location.abovebar location.top location.bottom location.absolute
location.top
Location value for plotshape, plotchar functions. Shape is plotted near the top chart border.
Type
const string
See also
plotshape plotchar location.abovebar location.belowbar location.bottom location.absolute
location.bottom
Location value for plotshape, plotchar functions. Shape is plotted near the bottom chart border.
Type
const string
See also
plotshape plotchar location.abovebar location.belowbar location.top location.absolute
location.absolute
Location value for plotshape, plotchar functions. Shape is plotted on chart using indicator value as a price coordinate.
Type
const string
See also
plotshape plotchar location.abovebar location.belowbar location.top location.bottom
size
size.auto
size.auto
Size value for plotshape, plotchar functions. The size of the shape automatically adapts to the size of the bars.
Type
const string
See also
plotshape plotchar size.tiny size.small size.normal size.large size.huge
size.tiny
Size value for plotshape, plotchar functions. The size of the shape constantly tiny.
Type
const string
See also
plotshape plotchar size.auto size.small size.normal size.large size.huge
size.small
Size value for plotshape, plotchar functions. The size of the shape constantly small.
Type
const string
See also
plotshape plotchar size.auto size.tiny size.normal size.large size.huge
size.normal
Size value for plotshape, plotchar functions. The size of the shape constantly normal.
Type
const string
See also
plotshape plotchar size.auto size.tiny size.small size.large size.huge
size.large
Size value for plotshape, plotchar functions. The size of the shape constantly large.
Type
const string
See also
plotshape plotchar size.auto size.tiny size.small size.normal size.huge
size.huge
Size value for plotshape, plotchar functions. The size of the shape constantly huge.
Type
const string
See also
plotshape plotchar size.auto size.tiny size.small size.normal size.large
alert
alert.freq_once_per_bar
A named constant for use with the freq parameter of the alert() function.
The first function call during the bar triggers the alert.
Type
const string
See also
alert
alert.freq_all
A named constant for use with the freq parameter of the alert() function.
All function calls trigger the alert.
Type
const string
See also
alert
alert.freq_once_per_bar_close
A named constant for use with the 'freq' parameter of the alert() function.
The function call triggers the alert only when it occurs during the last script iteration of the real-time bar, when it closes.
Type
const string
See also
alert
format
format.inherit
Is a named constant.
Type
const string
See also
format.price format.volume
format.price
Is a named constant.
Type
const string
Remarks
If format is format.price, default precision value is set. You can use the precision argument of indicator function to change the precision value.
See also
format.inherit format.volume
format.volume
It's a named constant.
Type
const string
See also
format.inherit format.price
syminfo
syminfo.ticker
Symbol name without exchange prefix, e.g. 'MSFT'.
Type
simple string
See also
syminfo.tickerid timeframe.period timeframe.multiplier
syminfo.tickerid
Symbol name with exchange prefix, e.g. 'BATS:MSFT', 'NASDAQ:MSFT'.
Type
simple string
See also
syminfo.ticker timeframe.period timeframe.multiplier
syminfo.basecurrency
Base currency for the symbol. For the symbol "BTCUSD" returns "BTC".
Type
simple string
See also
syminfo.currency syminfo.ticker
syminfo.currency
Currency for the current symbol. Returns currency code: "USD", "EUR", etc.
Type
simple string
See also
syminfo.basecurrency syminfo.ticker
syminfo.type
Type of the current symbol. Possible values are stock, futures, index, forex, crypto, fund, dr.
Type
simple string
See also
syminfo.ticker
syminfo.mintick
Min tick value for the current symbol. On FMZ Platform, the template parameter pricing currency precision in the "Pine Language Trading Class Library" on the real order/backtest interface can control this value. Pricing currency precision Setting 2 means that the price is accurate to the second decimal place when trading, and the minimum price change unit is 0.01. The value of syminfo.mintick is 0.01.
Type
simple float
See also
syminfo.pointvalue
syminfo.pointvalue
Point value of current product
Type
simple float
See also
syminfo.mintick
syminfo.timezone
Timezone of the exchange of the chart main series. Possible values see in timestamp.
Type
simple string
See also
timestamp
barstate
barstate.islastconfirmedhistory
Returns true if script is executing on the dataset's last bar when market is closed, or script is executing on the bar immediately preceding the real-time bar, if market is open. Returns false otherwise.
Type
series bool
Remarks
PineScript code that uses this variable could calculate differently on history and real-time data.
Please note that using this variable/function can cause indicator repainting.
See also
barstate.isfirst barstate.islast barstate.ishistory barstate.isrealtime barstate.isnew
barstate.isnew
Returns true if script is currently calculating on new bar, false otherwise.
Type
series bool
Remarks
PineScript code that uses this variable could calculate differently on history and real-time data.
Please note that using this variable/function can cause indicator repainting.
See also
barstate.isfirst barstate.islast barstate.ishistory barstate.isrealtime barstate.isconfirmed barstate.islastconfirmedhistory
barstate.isfirst
Returns true if current bar is first bar in barset, false otherwise.
Type
series bool
Remarks
PineScript code that uses this variable could calculate differently on history and real-time data.
Please note that using this variable/function can cause indicator repainting.
See also
barstate.islast barstate.ishistory barstate.isrealtime barstate.isnew barstate.isconfirmed barstate.islastconfirmedhistory
barstate.islast
Returns true if current bar is the last bar in barset, false otherwise.
Type
series bool
Remarks
PineScript code that uses this variable could calculate differently on history and real-time data.
Please note that using this variable/function can cause indicator repainting.
See also
barstate.isfirst barstate.ishistory barstate.isrealtime barstate.isnew barstate.isconfirmed barstate.islastconfirmedhistory
barstate.ishistory
Returns true if current bar is a historical bar, false otherwise.
Type
series bool
Remarks
PineScript code that uses this variable could calculate differently on history and real-time data.
Please note that using this variable/function can cause indicator repainting.
See also
barstate.isfirst barstate.islast barstate.isrealtime barstate.isnew barstate.isconfirmed barstate.islastconfirmedhistory
barstate.isconfirmed
Returns true if the script is calculating the last (closing) update of the current bar. The next script calculation will be on the new bar data.
Type
series bool
Remarks
PineScript code that uses this variable could calculate differently on history and real-time data.
It is NOT recommended to use barstate.isconfirmed in request.security expression. Its value requested from request.security is unpredictable.
Please note that using this variable/function can cause indicator repainting.
See also
barstate.isfirst barstate.islast barstate.ishistory barstate.isrealtime barstate.isnew barstate.islastconfirmedhistory
barstate.isrealtime
Returns true if current bar is a real-time bar, false otherwise.
Type
series bool
Remarks
PineScript code that uses this variable could calculate differently on history and real-time data.
Please note that using this variable/function can cause indicator repainting.
See also
barstate.isfirst barstate.islast barstate.ishistory barstate.isnew barstate.isconfirmed barstate.islastconfirmedhistory
barstate.time
Not available.
ta
ta.accdist
Accumulation/distribution index.
Type
series float
ta.iii
Intraday Intensity Index.
Type
series float
Example
pine
// Intraday Intensity Index
plot(ta.iii, color=color.yellow)
// the same on pine
f_iii() =>
(2 * close - high - low) / ((high - low) * volume)
plot(f_iii())
ta.nvi
Negative Volume Index.
Type
series float
Example
pine
// Negative Volume Index
plot(ta.nvi, color=color.yellow)
// the same on pine
f_nvi() =>
float ta_nvi = 1.0
float prevNvi = (nz(ta_nvi[1], 0.0) == 0.0) ? 1.0: ta_nvi[1]
if nz(close, 0.0) == 0.0 or nz(close[1], 0.0) == 0.0
ta_nvi := prevNvi
else
ta_nvi := (volume < nz(volume[1], 0.0)) ? prevNvi + ((close - close[1]) / close[1]) * prevNvi : prevNvi
result = ta_nvi
plot(f_nvi())
ta.pvi
Positive Volume Index.
Type
series float
Example
pine
// Positive Volume Index
plot(ta.pvi, color=color.yellow)
// the same on pine
f_pvi() =>
float ta_pvi = 1.0
float prevPvi = (nz(ta_pvi[1], 0.0) == 0.0) ? 1.0: ta_pvi[1]
if nz(close, 0.0) == 0.0 or nz(close[1], 0.0) == 0.0
ta_pvi := prevPvi
else
ta_pvi := (volume > nz(volume[1], 0.0)) ? prevPvi + ((close - close[1]) / close[1]) * prevPvi : prevPvi
result = ta_pvi
plot(f_pvi())
ta.obv
On Balance Volume.
Type
series float
Example
pine
// On Balance Volume
plot(ta.obv, color=color.yellow)
// the same on pine
f_obv() =>
ta.cum(math.sign(ta.change(close)) * volume)
plot(f_obv())
ta.pvt
Price-Volume Trend.
Type
series float
Example
pine
// Price-Volume Trend
plot(ta.pvt, color=color.yellow)
// the same on pine
f_pvt() =>
ta.cum((ta.change(close) / close[1]) * volume)
plot(f_pvt())
ta.wad
Williams Accumulation/Distribution.
Type
series float
Example
pine
// Williams Accumulation/Distribution
plot(ta.wad, color=color.yellow)
// the same on pine
f_wad() =>
trueHigh = math.max(high, close[1])
trueLow = math.min(low, close[1])
mom = ta.change(close)
gain = (mom > 0) ? close - trueLow : (mom < 0) ? close - trueHigh : 0
ta.cum(gain)
plot(f_wad())
ta.wvad
Williams Variable Accumulation/Distribution.
Type
series float
Example
pine
// Williams Variable Accumulation/Distribution
plot(ta.wvad, color=color.yellow)
// the same on pine
f_wvad() =>
(close - open) / (high - low) * volume
plot(f_wvad())
math
math.e
Is a named constant for Euler's number. It is equal to 2.7182818284590452.
Type
const float
See also
math.phi math.pi math.rphi
math.phi
Is a named constant for the golden ratio. It is equal to 1.6180339887498948.
Type
const float
See also
math.e math.pi math.rphi
math.pi
Is a named constant for Archimedes' constant. It is equal to 3.1415926535897932.
Type
const float
See also
math.e math.phi math.rphi
math.rphi
Is a named constant for the golden ratio conjugate. It is equal to 0.6180339887498948.
Type
const float
See also
math.e math.pi math.phi
strategy
strategy.equity
Current equity (strategy.initial_capital + strategy.netprofit + strategy.openprofit).
Type
series float
See also
strategy.netprofit strategy.openprofit strategy.position_size
strategy.position_size
Direction and size of the current market position. If the value is > 0, the market position is long. If the value is < 0, the market position is short. The absolute value is the number of contracts/shares/lots/units in trade (position size).
Type
series float
See also
strategy.position_avg_price
strategy.position_avg_price
Average entry price of current market position. If the market position is flat, "NaN" is returned.
Explanation
The average price in FMZ PINE Script is the price including handling fee. For example: the order price is 8000, the selling direction, the quantity is 1 lot (pieces, sheets), the average price after the transaction is not 8000, but lower than 8000 (the cost includes the handling fee).
Type
series float
See also
strategy.position_size
strategy.long
Long position entry.
Type
strategy_direction
See also
strategy.entry strategy.exit
strategy.short
Short position entry.
Type
strategy_direction
See also
strategy.entry strategy.exit
strategy.closedtrades
Number of trades, which were closed for the whole trading interval.
Type
series int
See also
strategy.position_size strategy.opentrades
strategy.opentrades
Number of market position entries, which were not closed and remain opened. If there is no open market position, 0 is returned.
Type
series int
See also
strategy.position_size
strategy.netprofit
Total currency value of all completed trades.
Type
series float
See also
strategy.openprofit strategy.position_size strategy.grossprofit
strategy.grossprofit
Total currency value of all completed winning trades.
Type
series float
See also
strategy.netprofit
strategy.openprofit
Current unrealized profit or loss for all open positions.
Type
series float
See also
strategy.netprofit strategy.position_size
strategy.direction.long
It allows strategy to open only long positions.
Type
const string
See also
strategy.risk.allow_entry_in
strategy.direction.short
It allows strategy to open only short positions.
Type
const string
See also
strategy.risk.allow_entry_in
strategy.direction.all
It allows strategy to open both long and short positions.
Type
const string
See also
strategy.risk.allow_entry_in
dayofweek
dayofweek
Day of week for current bar time in exchange timezone.
Type
series int
Remarks
Note that this variable returns the day based on the time of the bar's open. For overnight sessions (e.g. EURUSD, where Monday session starts on Sunday, 17:00) this value can be lower by 1 than the day of the trading day.
You can use dayofweek.sunday, dayofweek.monday, dayofweek.tuesday, dayofweek.wednesday, dayofweek.thursday, dayofweek.friday and dayofweek.saturday variables for comparisons.
See also
time dayofmonth
dayofweek.sunday
Is a named constant for return value of dayofweek function and value of dayofweek variable.
Type
const int
See also
dayofweek.monday dayofweek.tuesday dayofweek.wednesday dayofweek.thursday dayofweek.friday dayofweek.saturday
dayofweek.monday
Is a named constant for return value of dayofweek function and value of dayofweek variable.
Type
const int
See also
dayofweek.sunday dayofweek.tuesday dayofweek.wednesday dayofweek.thursday dayofweek.friday dayofweek.saturday
dayofweek.tuesday
Is a named constant for return value of dayofweek function and value of dayofweek variable.
Type
const int
See also
dayofweek.sunday dayofweek.monday dayofweek.wednesday dayofweek.thursday dayofweek.friday dayofweek.saturday
dayofweek.wednesday
Is a named constant for return value of dayofweek function and value of dayofweek variable.
Type
const int
See also
dayofweek.sunday dayofweek.monday dayofweek.tuesday dayofweek.thursday dayofweek.friday dayofweek.saturday
dayofweek.thursday
Is a named constant for return value of dayofweek function and value of dayofweek variable.
Type
const int
See also
dayofweek.sunday dayofweek.monday dayofweek.tuesday dayofweek.wednesday dayofweek.friday dayofweek.saturday
dayofweek.friday
Is a named constant for return value of dayofweek function and value of dayofweek variable.
Type
const int
See also
dayofweek.sunday dayofweek.monday dayofweek.tuesday dayofweek.wednesday dayofweek.thursday dayofweek.saturday
dayofweek.saturday
Is a named constant for return value of dayofweek function and value of dayofweek variable.
Type
const int
See also
dayofweek.sunday dayofweek.monday dayofweek.tuesday dayofweek.wednesday dayofweek.thursday dayofweek.friday
hline
hline.style_dashed
Is a named constant for dashed linestyle of hline function.
Type
hline_style
See also
hline.style_solid hline.style_dotted
hline.style_dotted
hline.style_dotted
Is a named constant for dotted linestyle of hline function.
Type
hline_style
See also
hline.style_solid hline.style_dashed
hline.style_solid
Is a named constant for solid linestyle of hline function.
Type
hline_style
See also
hline.style_dotted hline.style_dashed
barmerge
barmerge.gaps_on
Merge strategy for requested data. Data is merged with possible gaps (na values).
Type
barmerge_gaps
See also
request.security barmerge.gaps_off
barmerge.gaps_off
Merge strategy for requested data. Data is merged continuously without gaps, all the gaps are filled with the previous nearest existing value.
Type
barmerge_gaps
See also
request.security barmerge.gaps_on
barmerge.lookahead_on
Merge strategy for the requested data position. Requested barset is merged with current barset in the order of sorting bars by their opening time. This merge strategy can lead to undesirable effect of getting data from "future" on calculation on history. This is unacceptable in backtesting strategies, but can be useful in indicators.
Type
barmerge_lookahead
See also
request.security barmerge.lookahead_off
barmerge.lookahead_off
Merge strategy for the requested data position. Requested barset is merged with current barset in the order of sorting bars by their close time. This merge strategy disables effect of getting data from "future" on calculation on history.
Type
barmerge_lookahead
See also
request.security barmerge.lookahead_on
others
hl2
It is a shortcut for (highest price + lowest price)/2.
Type
series float
See also
open high low close volume time hlc3 hlcc4 ohlc4
hlc3
It is a shortcut for (highest price + lowest price + closing price)/3.
Type
series float
See also
open high low close volume time hl2 hlcc4 ohlc4
hlcc4
It is a shortcut for (highest price + lowest price + closing price + closing price)/4.
Type
series float
See also
open high low close volume time hl2 hlc3 ohlc4
ohlc4
It is a shortcut for (opening price + highest price + lowest price + closing price)/4.
Type
series float
See also
open high low close volume time hl2 hlc3 hlcc4
na
Double.NaN value (Not a Number).
Type
simple na
Example
pine
// na
plot(bar_index < 10 ? na : close) // CORRECT
plot(close == na ? close[1] : close) // INCORRECT!
plot(na(close) ? close[1] : close) // CORRECT
Remarks
Use it for return values ONLY. DON'T TRY TO COMPARE WITH IT! If you need to check if some value is NaN, use built-in function na.
See also
na
bar_index
Current bar index. Numbering is zero-based, index of the first bar is 0.
Type
series int
Example
pine
// bar_index
plot(bar_index)
plot(bar_index > 5000 ? close : 0)
Remarks
Note that bar_index has replaced n variable in version 4.
Note that bar indexing starts from 0 on the first historical bar.
Please note that using this variable/function can cause indicator repainting.
See also
barstate.isfirst barstate.islast barstate.isrealtime
last_bar_index
Bar index of the last chart bar. Bar indices begin at zero on the first bar.
Type
series int
Example
strategy("Mark Last X Bars For Backtesting", overlay = true, calc_on_every_tick = true)
lastBarsFilterInput = input.int(100, "Bars Count:")
// Here, we store the 'last_bar_index' value that is known from the beginning of the script's calculation.
// The 'last_bar_index' will change when new real-time bars appear, so we declare 'lastbar' with the 'var' keyword.
var lastbar = last_bar_index
// Check if the current bar_index is 'lastBarsFilterInput' removed from the last bar on the chart, or the chart is traded in real-time.
allowedToTrade = (lastbar - bar_index <= lastBarsFilterInput) or barstate.isrealtime
bgcolor(allowedToTrade ? color.new(color.green, 80) : na)
Returns
Last historical bar index for closed markets, or the real-time bar index for open markets.
Remarks
Please note that using this variable can cause indicator repainting.
See also
bar_index last_bar_time barstate.ishistory barstate.isrealtime
time
Current bar time in UNIX format. It is the number of milliseconds that have elapsed since 00:00:00 UTC, 1 January 1970.
timenow
Current time in UNIX format. It is the number of milliseconds that have elapsed since 00:00:00 UTC, 1 January 1970.
Type
series int
Remarks
Please note that using this variable/function can cause indicator repainting.
See also
timestamp time dayofmonth dayofweek
Type
series int
Remarks
Note that this variable returns the timestamp based on the time of the bar's open. Because of that, for overnight sessions (e.g. EURUSD, where Monday session starts on Sunday, 17:00) this variable can return time before the specified date of the trading day. For example, on EURUSD, "dayofmonth(time)" can be lower by 1 than the date of the trading day, because the bar for the current day actually opens one day prior.
See also
time dayofmonth dayofweek
year
Current bar year in exchange timezone.
Type
series int
Reamrks
Note that this variable returns the year based on the time of the bar's open. For overnight sessions (e.g. EURUSD, where Monday session starts on Sunday, 17:00) this value can be lower by 1 than the year of the trading day.
See also
year time month weekofyear dayofmonth dayofweek hour minute second
month
Current bar month in exchange timezone.
Type
series int
Reamrks
Note that this variable returns the month based on the time of the bar's open. For overnight sessions (e.g. EURUSD, where Monday session starts on Sunday, 17:00) this value can be lower by 1 than the month of the trading day.
See also
month time year weekofyear dayofmonth dayofweek hour minute second
hour
Current bar hour in exchange timezone.
Type
series int
See also
hour time year month weekofyear dayofmonth dayofweek minute second
minute
Current bar minute in exchange timezone.
Type
series int
See also
minute time year month weekofyear dayofmonth dayofweek hour second
second
Current bar second in exchange timezone.
Type
series int
See also
second time year month weekofyear dayofmonth dayofweek hour minute
open
Current open price.
Type
series float
Remarks
Previous values may be accessed with square brackets operator [], e.g. open[1], open[2].
See also
high low close volume time hl2 hlc3 hlcc4 ohlc4
high
Current highest price.
Type
series float
Remarks
Previous values may be accessed with square brackets operator [], e.g. high[1], high[2].
See also
open low close volume time hl2 hlc3 hlcc4 ohlc4
low
Current lowest price.
Type
series float
Remarks
Previous values may be accessed with square brackets operator [], e.g. low[1], low[2].
See also
open high close volume time hl2 hlc3 hlcc4 ohlc4
close
Close price of the current bar when it has closed, or last traded price of a yet incomplete, realtime bar.
Type
series float
Remarks
Previous values may be accessed with square brackets operator [], e.g. close[1], close[2].
See also
open high low volume time hl2 hlc3 hlcc4 ohlc4
volume
Current bar volume.
Type
series float
Remarks
Previous values may be accessed with square brackets operator [], e.g. volume[1], volume[2].
See also
open high low close time hl2 hlc3 hlcc4 ohlc4
weekofyear
Week number of current bar time in exchange timezone.
Type
series int
Remarks
Note that this variable returns the week based on the time of the bar's open. For overnight sessions (e.g. EURUSD, where Monday session starts on Sunday, 17:00) this value can be lower by 1 than the week of the trading day.
See also
weekofyear time year month dayofmonth dayofweek hour minute second
dayofmonth
Date of current bar time in exchange timezone.
Type
series int
Remarks
Note that this variable returns the day based on the time of the bar's open. For overnight sessions (e.g. EURUSD, where Monday session starts on Sunday, 17:00) this value can be lower by 1 than the day of the trading day.
