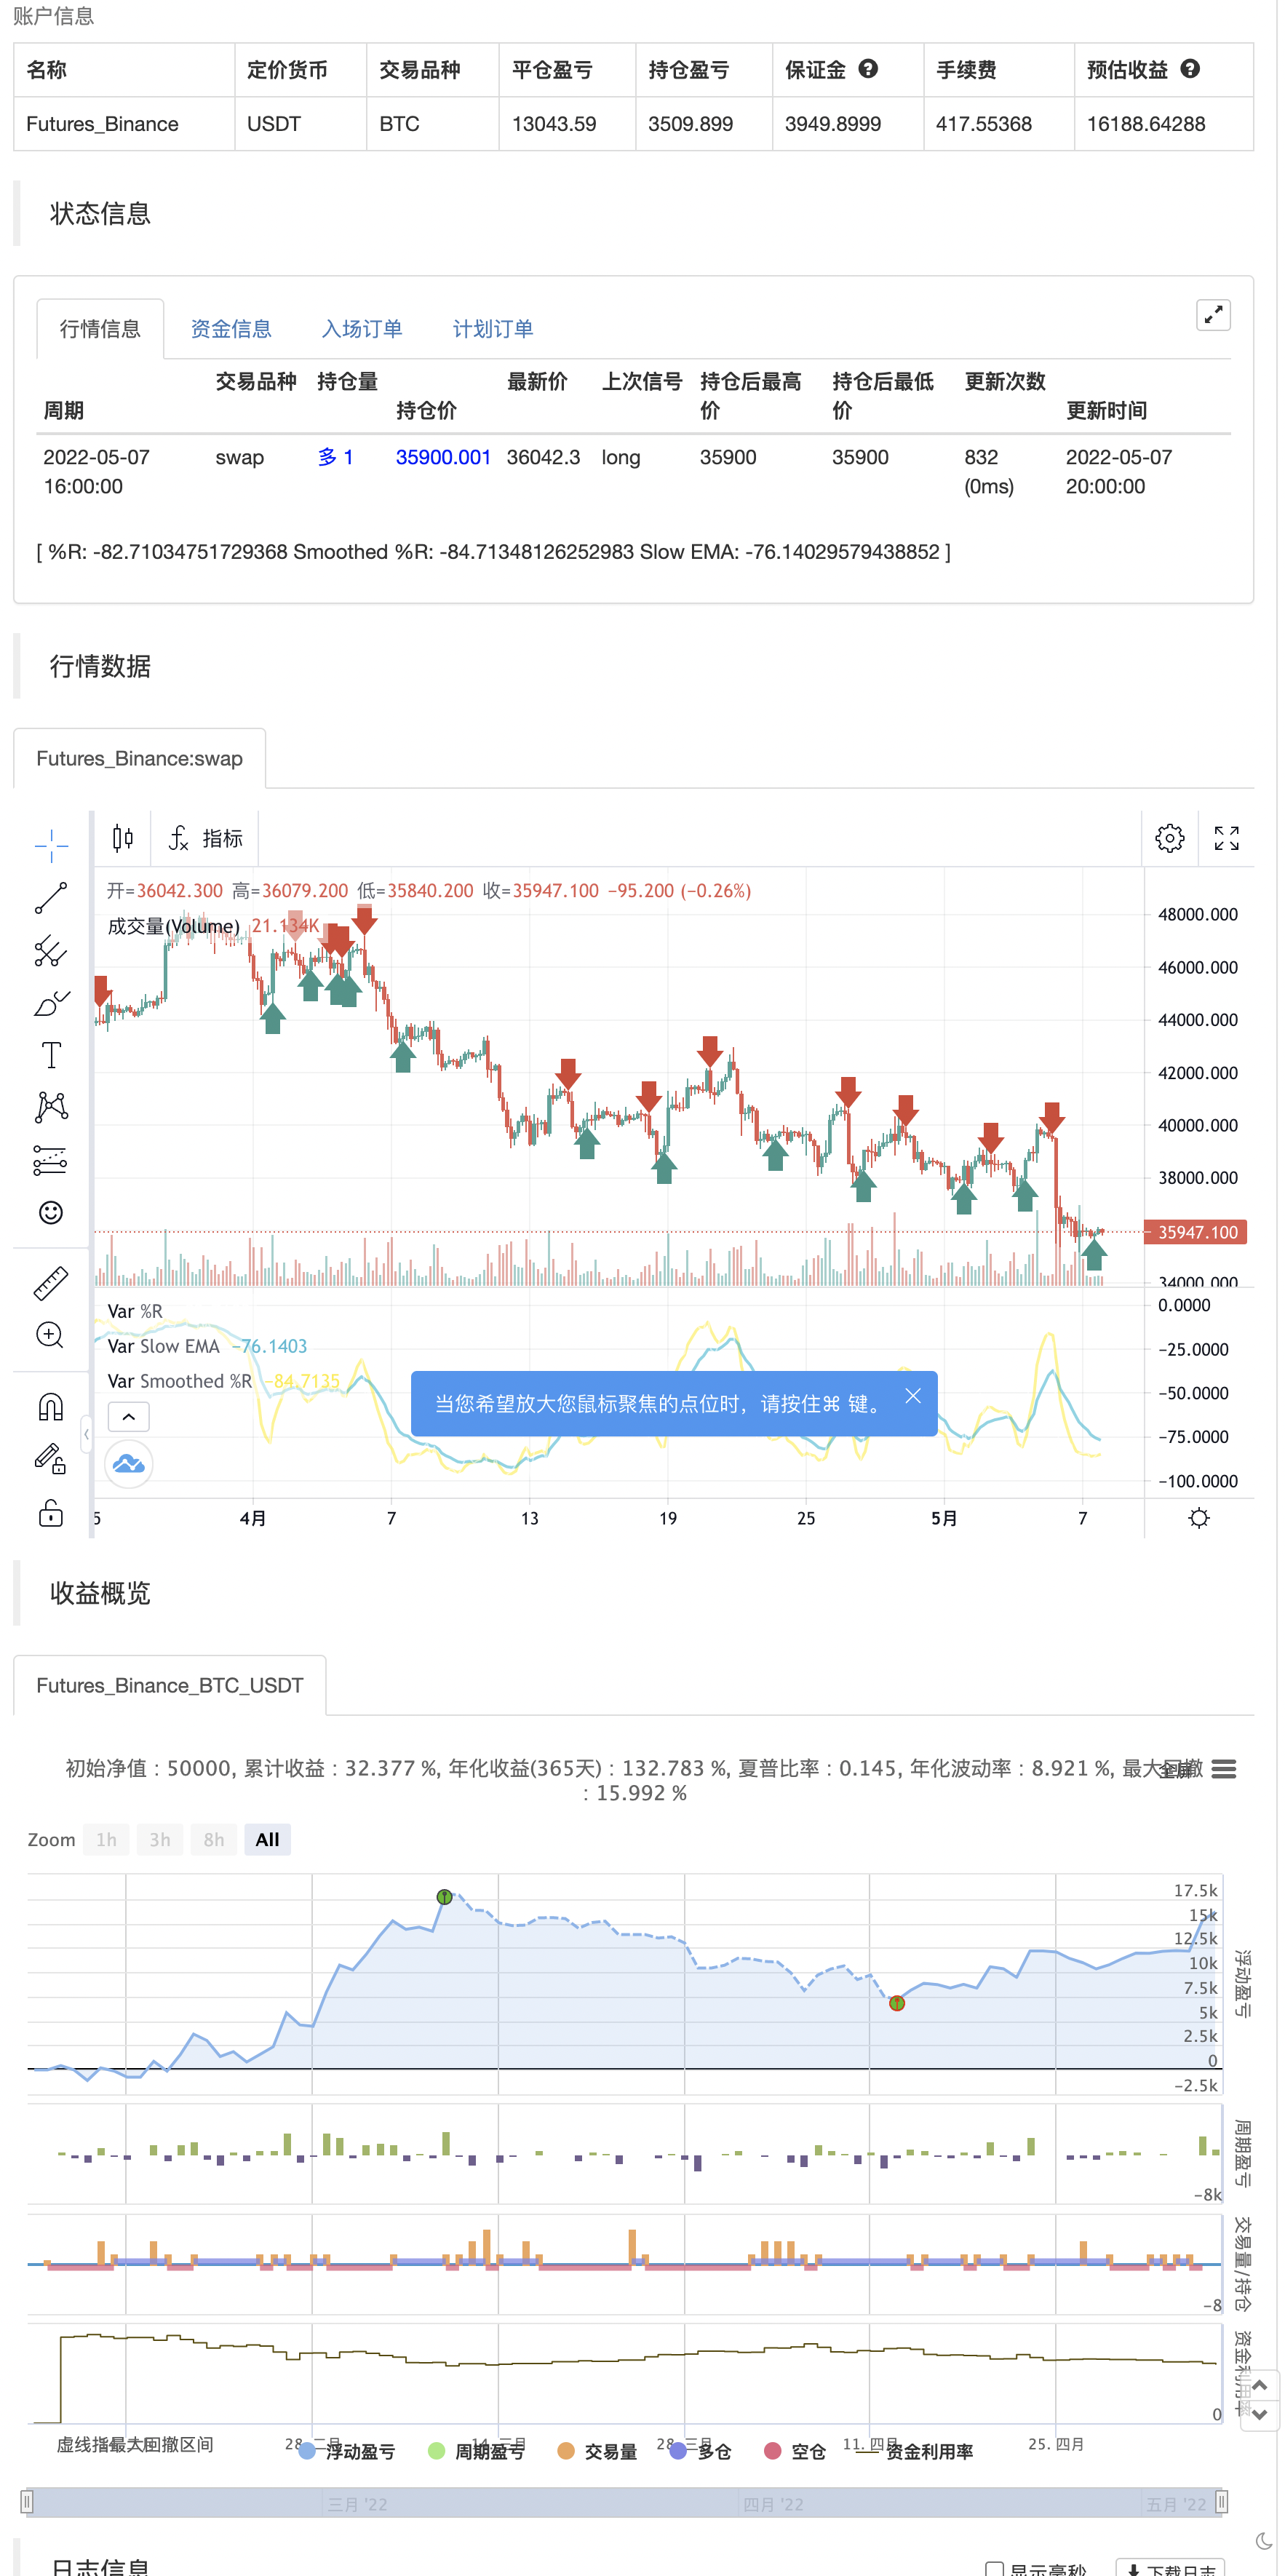
উইলিয়ামস %R - মসৃণ
লেখক:চাওঝাং, তারিখ: ২০২২-০৫-০৯ ১২ঃ৪৪ঃ৪৮ট্যাগঃডব্লিউএমএইএমএ
ট্রেডিংভিউ এর বর্ণনা থেকেঃ উইলিয়ামস %R (%R) একটি গতির উপর ভিত্তি করে দোলক যা প্রযুক্তিগত বিশ্লেষণে ব্যবহৃত হয়, প্রধানত ওভারকপ এবং ওভারসোল্ড শর্তগুলি সনাক্ত করতে। %R ব্যবহারকারীর সংজ্ঞায়িত পিছনের সময়ের জন্য বর্তমান বন্ধ এবং সর্বোচ্চ উচ্চতার তুলনায় ভিত্তি করে। %R 0 থেকে -100 এর মধ্যে দোলক (নেতিবাচক মানগুলি লক্ষ্য করুন) শূন্যের কাছাকাছি পাঠের সাথে আরও বেশি ওভারকপ শর্ত এবং -100 এর কাছাকাছি পাঠের সাথে ওভারসোল্ড নির্দেশ করে। সাধারণত %R ওভারকপ এবং ওভারসোল্ড শর্তগুলির পাশাপাশি গতির সামগ্রিক পরিবর্তনগুলির উপর ভিত্তি করে সেটআপ তৈরি করতে পারে।
বিশেষ কি? এই সূচকটি মূল উইলিয়ামস %R সূচকটিতে দুটি অতিরিক্ত ইএমএ লাইন যুক্ত করে। ডিফল্ট ইএমএ দৈর্ঘ্য 5 এবং 13। ফলাফলটি 2 মসৃণ গড় রেখা, যা পড়া সহজ। এই সূচকে নিম্নলিখিত বিষয়গুলি অন্তর্ভুক্ত রয়েছেঃ
- ইএমএ ক্রস জন্য সংকেত. ইএমএ ক্রস নিশ্চিত প্রবণতা পরিবর্তন নির্দেশ করতে সাহায্য করতে পারেন। ডিফল্ট রং সবুজ এবং লাল হয়
- দ্রুততম ইএমএ লাইনে ট্রেন্ড বিপরীতের সংকেত। ডিফল্ট রং নীল এবং কমলা
হ্রাস বা উত্থান ক্রসওভার এবং বিপরীতমুখী জন্য উপলব্ধ সতর্কতা।
উপভোগ করুন!
ব্যাকটেস্ট

/*backtest
start: 2022-02-08 00:00:00
end: 2022-05-08 00:00:00
period: 4h
basePeriod: 15m
exchanges: [{"eid":"Futures_Binance","currency":"BTC_USDT"}]
*/

// This source code is subject to the terms of the Mozilla Public License 2.0 at https://mozilla.org/MPL/2.0/
// © platsn

//@version=5
indicator(title='Williams %R - Smoothed', shorttitle='The Smooth Willy')

// Williams %R
length = input.int(defval=34, minval=1)
upper = ta.highest(length)
lower = ta.lowest(length)

output = 100 * (close - upper) / (upper - lower)

fast_period = input(defval=5, title='Smoothed %R Length')
slow_period = input(defval=13, title='Slow EMA Length')

fast_ema = ta.wma(output,fast_period)
slow_ema = ta.ema(output,slow_period)

// Plot
//h1 = hline(-20, title='Upper Band')
//h2 = hline(-80, title='Lower Band')
//fill(h1, h2, title='Background', transp=90)

plot(output, title='%R', color=color.new(color.white, 80), linewidth=1)
plot(fast_ema, title='Smoothed %R', color=color.new(color.yellow, 0), linewidth=2)
plot(slow_ema, title='Slow EMA', color=color.new(color.aqua, 0), linewidth=2)

bullX = ta.crossover(fast_ema, slow_ema)
bearX = ta.crossunder(fast_ema, slow_ema)
bullreverse = fast_ema[2] > fast_ema[1] and fast_ema > fast_ema[1] and fast_ema < -30
bearreverse = fast_ema[2] < fast_ema[1] and fast_ema < fast_ema[1] and fast_ema > -70

plotX = input.bool(true, "Show EMA Crossovers")
plotRev = input.bool(true, "Show trend reversals")

//plotshape(plotX and bearX ,"Cross down", color=color.red, style=shape.triangledown, location = location.top, size =size.tiny, offset=-1)
//plotshape(plotX and bullX ,"Cross up", color=color.green, style=shape.triangleup, location = location.bottom, size =size.tiny, offset=-1)
//plotshape(plotRev and bearreverse ,"Bear reversal", color=color.orange, style=shape.triangledown, location = location.top, size =size.tiny, offset=-1)
//plotshape(plotRev and bullreverse ,"Bull reversal", color=color.blue, style=shape.triangleup, location = location.bottom, size =size.tiny, offset=-1)

//alertcondition(bearX,"Bearish Crossover", "Bearish cross on William %R")
//alertcondition(bullX,"Bullish Crossover", "Bullish cross on William %R")
//alertcondition(bearreverse,"Bearish Reversal", "Bearish Reversal on William %R")
//alertcondition(bullreverse,"Billish Reversal", "Bullish Reversal on William %R")

if plotRev and bullreverse
    strategy.entry("Enter Long", strategy.long)
else if plotRev and bearreverse
    strategy.entry("Enter Short", strategy.short)
- নিম্ন স্ক্যানার কৌশল ক্রিপ্টো
- চলমান গড় ক্রস সতর্কতা, মাল্টি-টাইমফ্রেম (এমটিএফ)
- রেড কে ভলিউম-এক্সিলারেটেড দিকনির্দেশক শক্তির অনুপাত
- এনার্জি বার সহ রেড কে ডুয়াল ভেডার
- সেরা গলফিং + ব্রেকআউট কৌশল
- HALFTREND + HEMA + SMA (মিথ্যা সংকেতের কৌশল)
- চলমান গড় এবং বোলিংজার ব্যান্ডের উপর ভিত্তি করে পরিমাণগত ট্রেডিং কৌশল
- সুইং হুল/আরএসআই/ইএমএ কৌশল
- হুল চলমান গড়ের উপর ভিত্তি করে ইএমএ ট্রেন্ড নির্ধারণের প্রতিফলিত কৌশল
- রেড কে মোমেন্টাম বার
- বিগ স্ন্যাপার সতর্কতা R3.0 + Chaiking Volatility condition + TP RSI
- চাঁদ ক্রোল স্টপ
- আরএসআই ক্রস স্ট্র্যাটেজি সহ সিসিআই + ইএমএ
- EMA ব্যান্ড + leledc + Bollinger ব্যান্ড ট্রেন্ড ক্যাচিং কৌশল
- আরএসআই এমটিএফ ওব+ও
- এমএসিডি উইলি কৌশল
- RSI - কিনুন বিক্রয় সংকেত
- হেকিন-আশি প্রবণতা
- HA বাজার পক্ষপাতিত্ব
- ইচিমোকু মেঘ মসৃণ দোলক
- কিউকিউই এমওডি + এসএসএল হাইব্রিড + ওয়াদা আত্তার বিস্ফোরণ
- স্ট্র্যাট কিনুন/বিক্রয় করুন
- EMA এবং ADX এর সাথে ট্রিপল সুপারট্রেন্ড
- টম ডিমার্ক সিকোয়েন্সিয়াল হিট ম্যাপ
- jma + dwma multigrain দ্বারা
- ম্যাজিক এমএসিডি
- সিগন্যাল দিয়ে Z স্কোর
- পাইন ভাষার সংস্করণ
- 3EMA + Boullinger + PIVOT
- মাল্টি-গ্রেন দ্বারা বেগেট