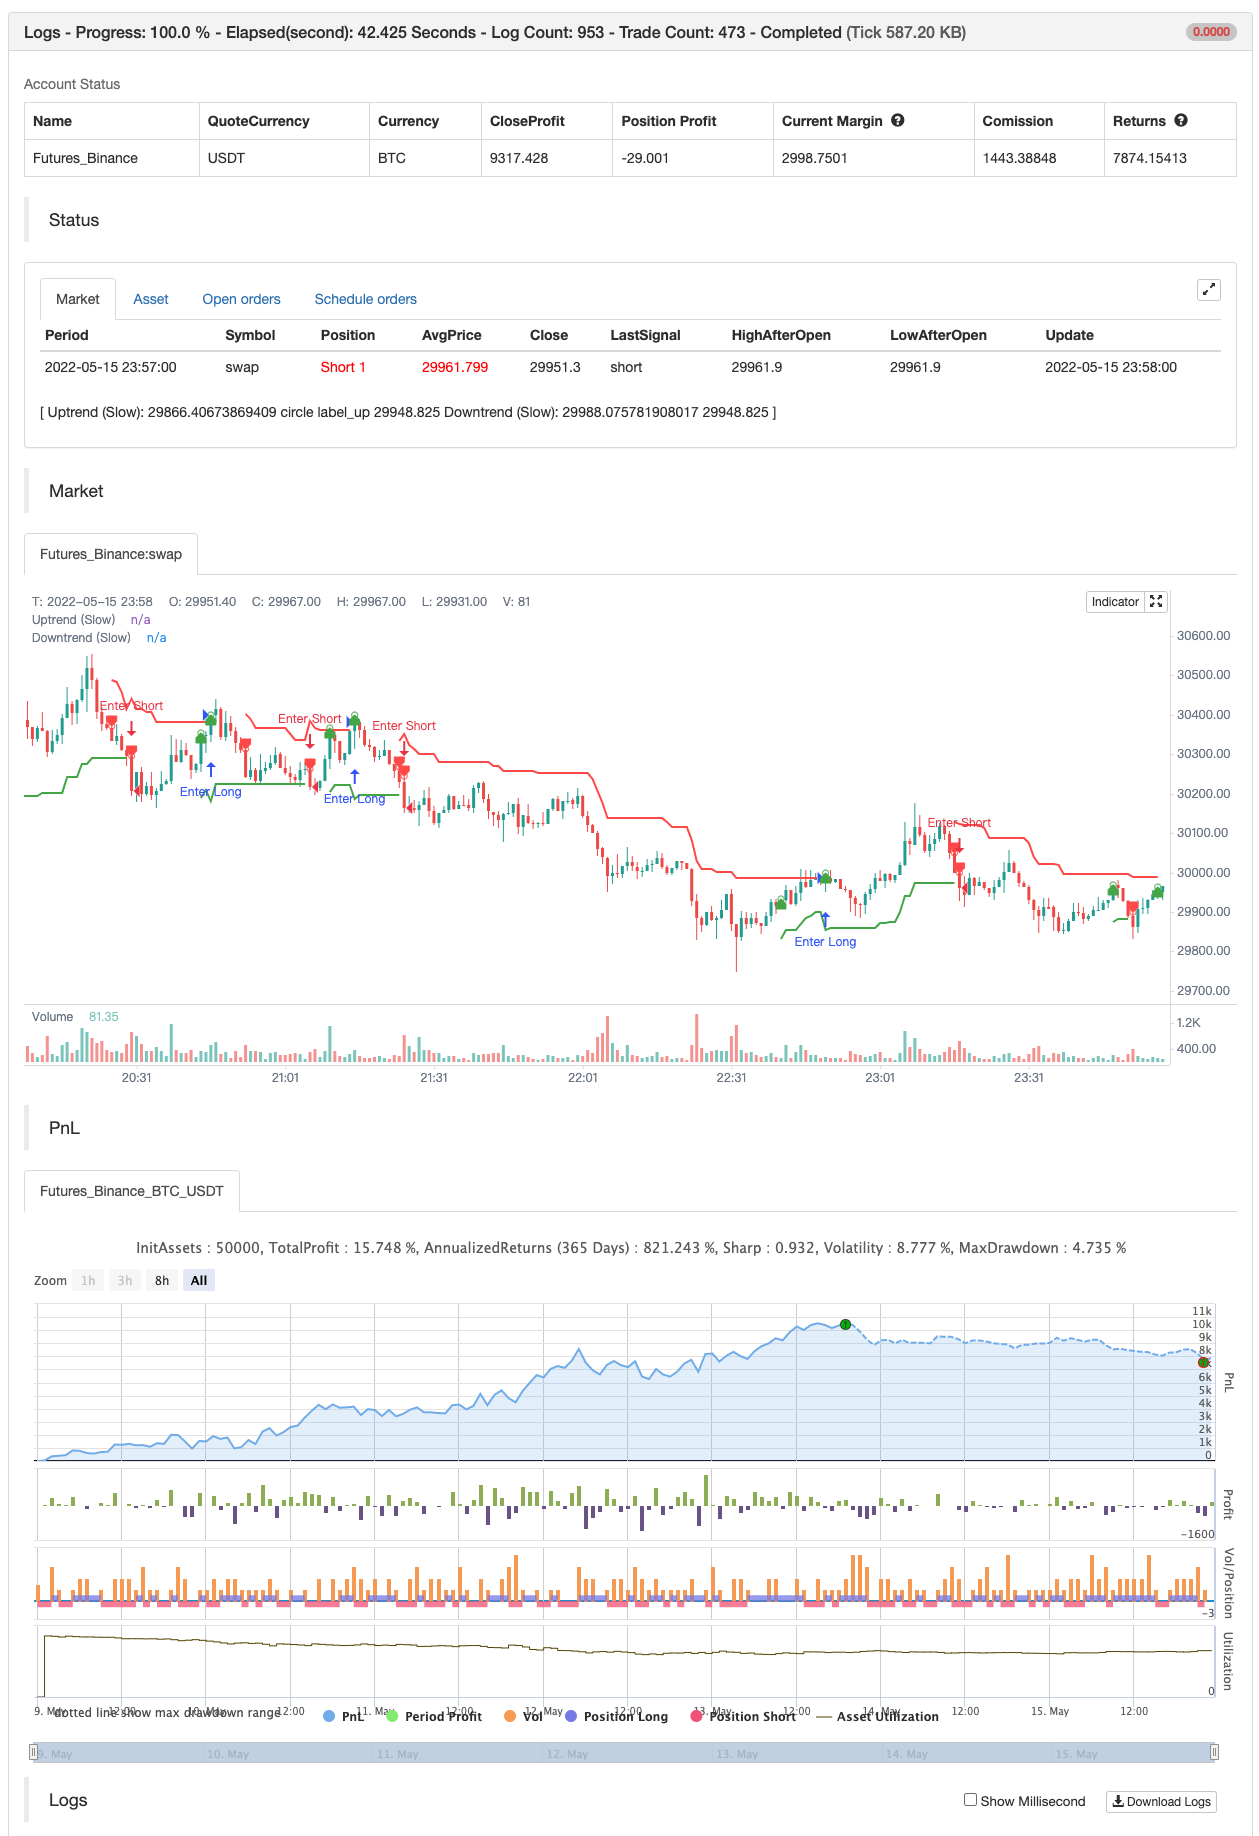
কনসেপ্ট ডুয়াল সুপারট্রেন্ড
লেখক:চাওঝাং, তারিখ: ২০২২-০৫-১৭ ১৪ঃ৪০ঃ৪০ট্যাগঃএসএমএএটিআর
সহজ সুপারট্রেন্ড সূচক আপনাকে একটি একক স্ক্রিপ্টে দুটি সুপারট্রেন্ড প্রদর্শন করার বিকল্প plus অতিরিক্ত কাস্টমাইজেশন বৈশিষ্ট্য দেয়। আয় হাঙ্গর দ্বারা অনুপ্রাণিত দ্বৈত সেটআপ
ব্যাকটেস্ট

/*backtest
start: 2022-05-09 00:00:00
end: 2022-05-15 23:59:00
period: 1m
basePeriod: 1m
exchanges: [{"eid":"Futures_Binance","currency":"BTC_USDT"}]
*/

//@version=5
indicator(title='Concept Dual SuperTrend', shorttitle='ConceptDST', overlay=true, format=format.price, precision=2, timeframe='')

src = input(hl2, title='Source')
multiplier = input.float(title='ATR Multiplier (Fast)', step=0.1, defval=2)
multiplier2 = input.float(title='ATR Multiplier (Slow)', step=0.1, defval=3)
periods = input(title='ATR Period (Fast)', defval=10)
periods2 = input(title='ATR Period (Slow)', defval=10)
transp_st = input.float(title='Line Transparency', step=1, minval=0, maxval=100, defval=70)
transp_hl = input.float(title='Shading Transparency', step=1, minval=0, maxval=100, defval=90)
changeATR = input(title='Change ATR Calculation Method?', defval=true)
highlighting = input(title='Show Shading? (Fast)', defval=true)
highlighting2 = input(title='Show Shading? (Slow)', defval=true)
showlabels = input(title='Show Buy/Sell Labels?', defval=true)


//------------------------------------------------

// Calculations (Fast)
atrA = ta.sma(ta.tr, periods)
atr = changeATR ? ta.atr(periods) : atrA
up = src - multiplier * atr
upA = nz(up[1], up)
up := close[1] > upA ? math.max(up, upA) : up
dn = src + multiplier * atr
dnA = nz(dn[1], dn)
dn := close[1] < dnA ? math.min(dn, dnA) : dn

// Trend (Fast)
trend = 1
trend := nz(trend[1], trend)
trend := trend == -1 and close > dnA ? 1 : trend == 1 and close < upA ? -1 : trend

upPlot = plot(trend == 1 ? up : na, title='Uptrend (Slow)', style=plot.style_linebr, linewidth=2, color=color.new(color.green, transp_st))
buySignal = trend == 1 and trend[1] == -1
plotshape(buySignal ? up : na, title='Uptrend Start (Slow)', location=location.absolute, style=shape.circle, size=size.tiny, color=color.new(color.green, transp_st))
plotshape(buySignal and showlabels ? up : na, title='Buy', text='Buy', location=location.absolute, style=shape.labelup, size=size.tiny, color=color.new(color.green, 0), textcolor=color.new(color.white, 0))

dnPlot = plot(trend == 1 ? na : dn, title='Downtrend (Slow)', style=plot.style_linebr, linewidth=2, color=color.new(color.red, transp_st))
sellSignal = trend == -1 and trend[1] == 1
plotshape(sellSignal ? dn : na, title='Downtrend Start (Slow)', location=location.absolute, style=shape.circle, size=size.tiny, color=color.new(color.red, transp_st))
plotshape(sellSignal and showlabels ? dn : na, title='Sell', text='Sell', location=location.absolute, style=shape.labeldown, size=size.tiny, color=color.new(color.red, 0), textcolor=color.new(color.white, 0))

mPlot = plot(ohlc4, title='', style=plot.style_circles, linewidth=0, color=na)
longFillColor = highlighting ? trend == 1 ? color.green : color.black : color.black
shortFillColor = highlighting ? trend == -1 ? color.red : color.black : color.black
fill(mPlot, upPlot, title='Uptrend Shading (Slow)', color=color.new(longFillColor, transp_hl))
fill(mPlot, dnPlot, title='Downtrend Shading (Slow)', color=color.new(shortFillColor, transp_hl))

//------------------------------------------------

// Calculations (Slow)
atrA2 = ta.sma(ta.tr, periods2)
atr2 = changeATR ? ta.atr(periods2) : atrA2
up2 = src - multiplier2 * atr2
upA2 = nz(up2[1], up2)
up2 := close[1] > upA2 ? math.max(up2, upA2) : up2
dn2 = src + multiplier2 * atr2
dnA2 = nz(dn2[1], dn2)
dn2 := close[1] < dnA2 ? math.min(dn2, dnA2) : dn2

// Trend (Slow)
trend2 = 1
trend2 := nz(trend2[1], trend2)
trend2 := trend2 == -1 and close > dnA2 ? 1 : trend2 == 1 and close < upA2 ? -1 : trend2

upPlot2 = plot(trend2 == 1 ? up2 : na, title='Uptrend (Slow)', style=plot.style_linebr, linewidth=2, color=color.new(color.green, transp_st))
buySignal2 = trend2 == 1 and trend2[1] == -1
plotshape(buySignal2 ? up2 : na, title='Uptrend Start (Slow)', location=location.absolute, style=shape.circle, size=size.tiny, color=color.new(color.green, transp_st))
plotshape(buySignal2 and showlabels ? up2 : na, title='Buy', text='Buy', location=location.absolute, style=shape.labelup, size=size.tiny, color=color.new(color.green, 0), textcolor=color.new(color.white, 0))

dnPlot2 = plot(trend2 == 1 ? na : dn2, title='Downtrend (Slow)', style=plot.style_linebr, linewidth=2, color=color.new(color.red, transp_st))
sellSignal2 = trend2 == -1 and trend2[1] == 1
plotshape(sellSignal2 ? dn2 : na, title='Downtrend Start (Slow)', location=location.absolute, style=shape.circle, size=size.tiny, color=color.new(color.red, transp_st))
plotshape(sellSignal2 and showlabels ? dn2 : na, title='Sell', text='Sell', location=location.absolute, style=shape.labeldown, size=size.tiny, color=color.new(color.red, 0), textcolor=color.new(color.white, 0))

mPlot2 = plot(ohlc4, title='', style=plot.style_circles, linewidth=0, color=na)
longFillColor2 = highlighting2 ? trend2 == 1 ? color.green : color.black : color.black
shortFillColor2 = highlighting2 ? trend2 == -1 ? color.red : color.black : color.black
fill(mPlot2, upPlot2, title='Uptrend Shading (Slow)', color=color.new(longFillColor2, transp_hl))
fill(mPlot2, dnPlot2, title='Downtrend Shading (Slow)', color=color.new(shortFillColor2, transp_hl))


if buySignal2
    strategy.entry("Enter Long", strategy.long)
else if sellSignal2
    strategy.entry("Enter Short", strategy.short)
সম্পর্কিত
- ডায়নামিক ভোলটাইলিটি ফিল্টার সহ মাল্টি-পিরিয়ড মুভিং এভারেজ ক্রসওভার কৌশল
- ATR স্টপ-লস সিস্টেমের সাথে মাল্টি-এসএমএ সাপোর্ট লেভেল মিথ্যা ব্রেকআউট কৌশল
- এটিআর এবং ভলিউমকে একত্রিত করার কৌশল অনুসরণ করে ডাইনামিক সিগন্যাল লাইন ট্রেন্ড
- আলফা ট্রেন্ড
- ঝুঁকি নিয়ন্ত্রণের সাথে ডাবল মুভিং মিডিয়ার রিভার্সন কৌশল
- ইচিমোকু ক্লাউড এবং এটিআর কৌশল
- লাইন নির্দেশক অনুসরণ করুন
- ইনট্রা-ডে স্কেলযোগ্য ভোল্টেবিলিটি ট্রেডিং কৌশল
- সুপারট্রেন্ড+৪চলমান
- এটিআর গড় ব্রেকআউট কৌশল
আরো
- ফুকুইজ ট্রেন্ড
- জনির বট
- এসএসএল হাইব্রিড
- চ্যান্ডেলিয়ারের প্রস্থান
- রিসোটো
- ইএমএ ক্লাউড ইনট্রা-ডে স্ট্র্যাটেজি
- পিভট পয়েন্ট সুপারট্রেন্ড
- সুপারট্রেন্ড+৪চলমান
- গতির উপর ভিত্তি করে ZigZag
- ভিউম্যানচু সিফার বি + ডিভার্জেন্স কৌশল
- সুপার স্কালপার
- ব্যাকটেস্টিং- সূচক
- প্রচলিত
- এসএমএ বিটিসি খুনি
- এমএল সতর্কতা টেমপ্লেট
- বিরতি সহ ফিবোনাচি অগ্রগতি
- আরএসআই এমটিএফ ওব+ও
- ফুকুইজ ওক্টা-ইএমএ + ইচিমোকু
- সিসিআই এমটিএফ ওব+ও
- আরও স্মার্ট ম্যাকডি