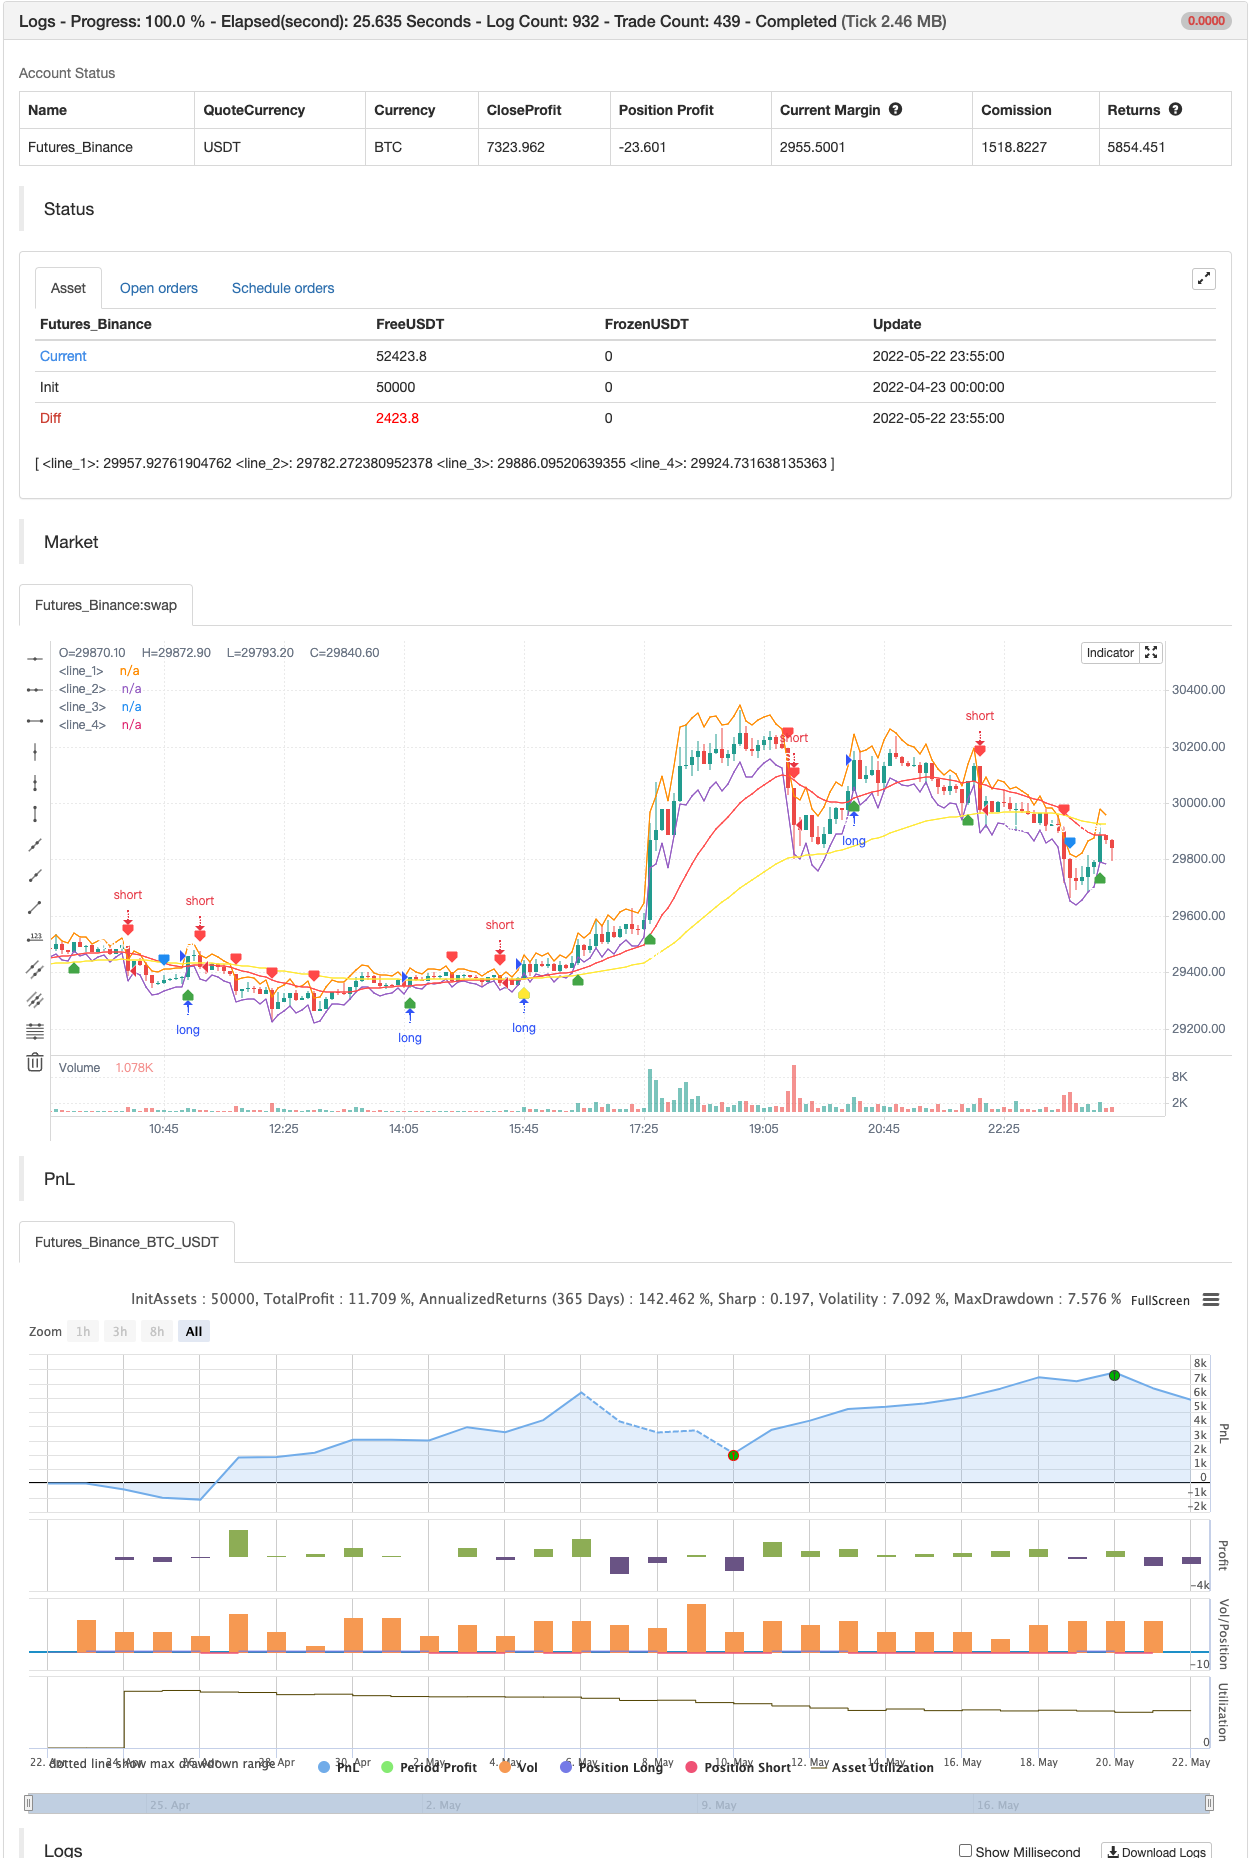
সুপার স্কালপার - ৫ মিনিট ১৫ মিনিট
লেখক:চাওঝাং, তারিখ: ২০২২-০৫-২৪ ১৬ঃ২০ঃ৫৮ট্যাগঃআরএমএএসএমএইএমএডব্লিউএমএআরএসআইএটিআর
এই কৌশলটি RSI এবং ATR ব্যান্ডের উপর ভিত্তি করে তৈরি করা হয়েছে যা 5 এবং 15 মিনিটের সময়সীমার মধ্যে আরও ভাল কাজ করে। রিয়েল টাইমে ব্যবহারের আগে ১ঃ২আর দিয়ে পর্যাপ্ত ব্যাক টেস্টিং করুন।
কেবলমাত্র স্ক্রিনের চিহ্নগুলিতে ট্রেডিং এন্ট্রি করুন, লাভ বুক করতে বা এসএল ট্র্যাক করতে অতিরিক্ত ক্রয় / বিক্রয় সতর্কতা ব্যবহার করুন।
আমি ৬৫ ও ২১ এর গোল্ডেন ক্রস ওভারও যোগ করেছি।
ব্যাকটেস্ট

/*backtest
start: 2022-04-23 00:00:00
end: 2022-05-22 23:59:00
period: 5m
basePeriod: 1m
exchanges: [{"eid":"Futures_Binance","currency":"BTC_USDT"}]
*/

//@version=5
//Revision: Updated script to pine script version 5
//added Double RSI for Long/Short prosition trend confirmation instead of single RSI
strategy("Super Scalper - 5 Min 15 Min", overlay=true)
source = close
atrlen = input.int(14, "ATR Period")
mult = input.float(1, "ATR Multi", step=0.1)
smoothing = input.string(title="ATR Smoothing", defval="WMA", options=["RMA", "SMA", "EMA", "WMA"])
ma_function(source, atrlen) =>
    if smoothing == "RMA"
        ta.rma(source, atrlen)
    else
        if smoothing == "SMA"
            ta.sma(source, atrlen)
        else
            if smoothing == "EMA"
                ta.ema(source, atrlen)
            else
                ta.wma(source, atrlen)
atr_slen = ma_function(ta.tr(true), atrlen)
upper_band = atr_slen * mult + close
lower_band = close - atr_slen * mult

// Create Indicator's
ShortEMAlen = input.int(21, "Fast EMA")
LongEMAlen = input.int(65, "Slow EMA")
shortSMA = ta.ema(close, ShortEMAlen)
longSMA = ta.ema(close, LongEMAlen)
RSILen1 = input.int(25, "Fast RSI Length")
RSILen2 = input.int(100, "Slow RSI Length")
rsi1 = ta.rsi(close, RSILen1)
rsi2 = ta.rsi(close, RSILen2)
atr = ta.atr(atrlen)


//RSI Cross condition
RSILong = rsi1 > rsi2
RSIShort = rsi1 < rsi2

// Specify  conditions
longCondition = open < lower_band
shortCondition = open > upper_band
GoldenLong = ta.crossover(shortSMA,longSMA)
Goldenshort = ta.crossover(longSMA,shortSMA)

plotshape(shortCondition, title="Sell Label", text="Sell", location=location.abovebar, style=shape.labeldown, size=size.tiny, color=color.red, textcolor=color.white, transp=0)
plotshape(longCondition, title="Buy Label", text="Buy", location=location.belowbar, style=shape.labelup, size=size.tiny, color=color.green, textcolor=color.white, transp=0)
plotshape(Goldenshort, title="Golden Sell Label", text="Golden Crossover Short", location=location.abovebar, style=shape.labeldown, size=size.tiny, color=color.blue, textcolor=color.white, transp=0)
plotshape(GoldenLong, title="Golden Buy Label", text="Golden Crossover Long", location=location.belowbar, style=shape.labelup, size=size.tiny, color=color.yellow, textcolor=color.white, transp=0)
// Execute trade if condition is True
if (longCondition)
    stopLoss = low - atr * 2
    takeProfit = high + atr * 5
    strategy.entry("long", strategy.long, when = RSILong)


if (shortCondition)
    stopLoss = high + atr * 2
    takeProfit = low - atr * 5
    strategy.entry("short", strategy.short, when = RSIShort)


// Plot ATR bands to chart

////ATR Up/Low Bands

plot(upper_band)
plot(lower_band)

// Plot Moving Averages
plot(shortSMA, color = color.red)
plot(longSMA, color = color.yellow)
সম্পর্কিত বিষয়বস্তু
- মাল্টি স্লাইড মিডলাইন ডায়নামিক ক্রস ট্রেন্ড ট্র্যাকিং এবং মাল্টি কনফার্মেশন কোয়ালিফাইড ট্রেডিং কৌশল
- সুপার স্কালপার
- ইএসএসএমএ
- সুপারজাম্প টার্ন ব্যাক বোলিঞ্জার ব্যান্ড
- ক্রয়/বিক্রয় সহ EMA ADX RSI এর স্কাল্পিং
- VAWSI এবং প্রবণতা ধারাবাহিক বিপরীতকরণ কৌশলগুলিকে একত্রিত করে গতিশীল দৈর্ঘ্যের গণনার জন্য মাল্টি-পরিমাপক সমন্বিত বিশ্লেষণ সিস্টেম
- মাল্টি-ইউনিট্রি ক্রস-সাহায্যকারী আরএসআই ডায়নামিক প্যারামিটার পরিমাণগত ট্রেডিং কৌশল
- ডায়নামিক আরএসআই স্মার্ট টাইমপ্লেস ট্রেডিং কৌশল
- এসএসএল হাইব্রিড
- মাল্টি-ইন্ডেক্স ডায়নামিক স্বনির্ধারিত ট্রেডিং ATR উদ্বায়ীতা কৌশল
আরও দেখুন
- স্টোক্যাস্টিক + আরএসআই, ডাবল স্ট্র্যাটেজি
- সুইং হুল/আরএসআই/ইএমএ কৌশল
- স্কেলপিং সুইং ট্রেডিং টুল R1-4
- সেরা গলফিং + ব্রেকআউট কৌশল
- বোলিংজার অ্যামেজিং অ্যালার্ট R1
- মাল্টি এক্সচেঞ্জ প্লাগইন
- ত্রিভুজ সুইচিং (ছোট মুদ্রার বিনিময় মূল্যের পার্থক্য)
- বাইবিট বিপরীত চুক্তির গতিশীল গ্রিড (বিশেষ গ্রিড)
- ট্রেডিংভিউ সতর্কতা MT4 MT5 + গতিশীল ভেরিয়েবল NON-REPAINTING
- ম্যাট্রিক্স সিরিজ
- আপেক্ষিক শক্তি সূচক - বৈষম্য - লিবার্টাস
- লিনিয়ার রিগ্রেশন ++
- এনার্জি বার সহ রেড কে ডুয়াল ভেডার
- একত্রীকরণ অঞ্চল - লাইভ
- পরিমাণগত গুণগত অনুমান
- চলমান গড় ক্রস সতর্কতা, মাল্টি-টাইমফ্রেম (এমটিএফ)
- এমএসিডি পুনরায় লোড করা কৌশল
- সুপারট্রেন্ডড মুভিং মিডিয়ার
- ট্রেডিং এবিসি
- 15MIN BTCUSDTPERP BOT