概述
这个策略是一个结合多个指标的综合分析系统,主要基于VAWSI(体积和ATR加权强度指数)、趋势持续性指标和修改版ATR来判断市场趋势和可能的反转点。该策略还引入了动态长度计算,以适应不同市场条件。它通过设置动态的止损和获利点来管理风险,并在识别到潜在反转信号时进行交易。
该策略的核心在于通过多个自定义指标来衡量市场趋势的强度、持续时间和波动性,从而找出最佳的交易时机。它特别适用于具有明显趋势的市场,但也包含了适应性机制以处理不同的市场状态。
策略原理
VAWSI指标:这是一个原创指标,类似于RSI,但使用VAWMA(体积和ATR加权移动平均线)代替RMA。它衡量新兴趋势的强度。
趋势持续性指标:另一个原创指标,用于测量趋势持续的时间。它计算源数据与指定长度内最高/最低点的最大偏差,然后累积这个偏差并创建一个强度指数。
修改版ATR:取高-低和|源-前一源|的最大值,然后取其变化的绝对值并用源数据归一化。
动态长度计算:使用BlackCat1402的动态长度计算方法,根据市场条件调整指标的长度参数。
综合分析:将VAWSI、趋势持续性和ATR的读数结合起来,生成一个综合指标。较低的最终数值表示即将发生反转,较高的数值表示市场不稳定或震荡。
动态止损/获利:基于综合指标和当前趋势方向计算动态的止损和获利水平。
交易信号:当价格完全穿过计算出的阈值线时,系统会确认交叉并产生交易信号。
策略优势
多维度分析:通过结合多个指标,策略能够从不同角度分析市场,提高判断的准确性。
自适应性:动态长度计算使策略能够适应不同的市场条件,增强了策略的灵活性。
风险管理:动态止损和获利点的设置有助于更好地控制风险,适应市场的变化。
原创指标:VAWSI和趋势持续性指标提供了独特的市场洞察,可能捕捉到传统指标忽视的信号。
防止重绘:使用barstate.isconfirmed确保信号不会重绘,提高了回测的准确性。
可定制性:多个参数可以调整,使策略能够适应不同的交易品种和时间框架。
策略风险
过度优化:大量参数可能导致过度优化,在实盘交易中表现不佳。
市场适应性:虽然在某些市场表现良好,但可能不适用于所有市场条件,特别是在波动性较低的市场中。
复杂性:策略的复杂性可能使其难以理解和维护,增加了操作错误的风险。
计算密集:多个自定义指标和动态计算可能导致较高的计算负荷,影响执行速度。
依赖历史数据:策略使用大量历史数据进行计算,在某些情况下可能导致滞后。
优化方向
参数优化:使用机器学习算法来优化各种权重和长度参数,以提高策略在不同市场条件下的表现。
市场状态识别:增加一个市场状态识别模块,以便在不同的市场环境中自动调整策略参数。
信号过滤:引入额外的过滤机制,如趋势强度阈值,以减少假信号。
成交量分析:深化对成交量的分析,可能引入成交量形态识别,以增强信号的可靠性。
多时间框架分析:整合多个时间框架的信号,以提高交易决策的稳健性。
风险管理优化:实现更复杂的风险管理策略,如动态仓位sizing和多层次止损。
计算效率:优化代码以提高计算效率,特别是在处理大量历史数据时。
总结
VAWSI和趋势持续性反转策略是一个复杂而全面的交易系统,结合了多个创新指标和动态参数调整。它的优势在于多维度的市场分析和自适应性,使其能够在不同的市场条件下寻找潜在的反转机会。然而,策略的复杂性也带来了过度优化和适应性方面的挑战。
通过进一步的优化,特别是在参数调整、市场状态识别和风险管理方面,该策略有潜力成为一个强大的交易工具。然而,使用者应该注意到,没有一个策略是完美的,持续的监控和调整是必要的。在实际应用中,建议在模拟账户上进行充分的测试,并结合其他分析工具和市场知识来做出交易决策。
/*backtest
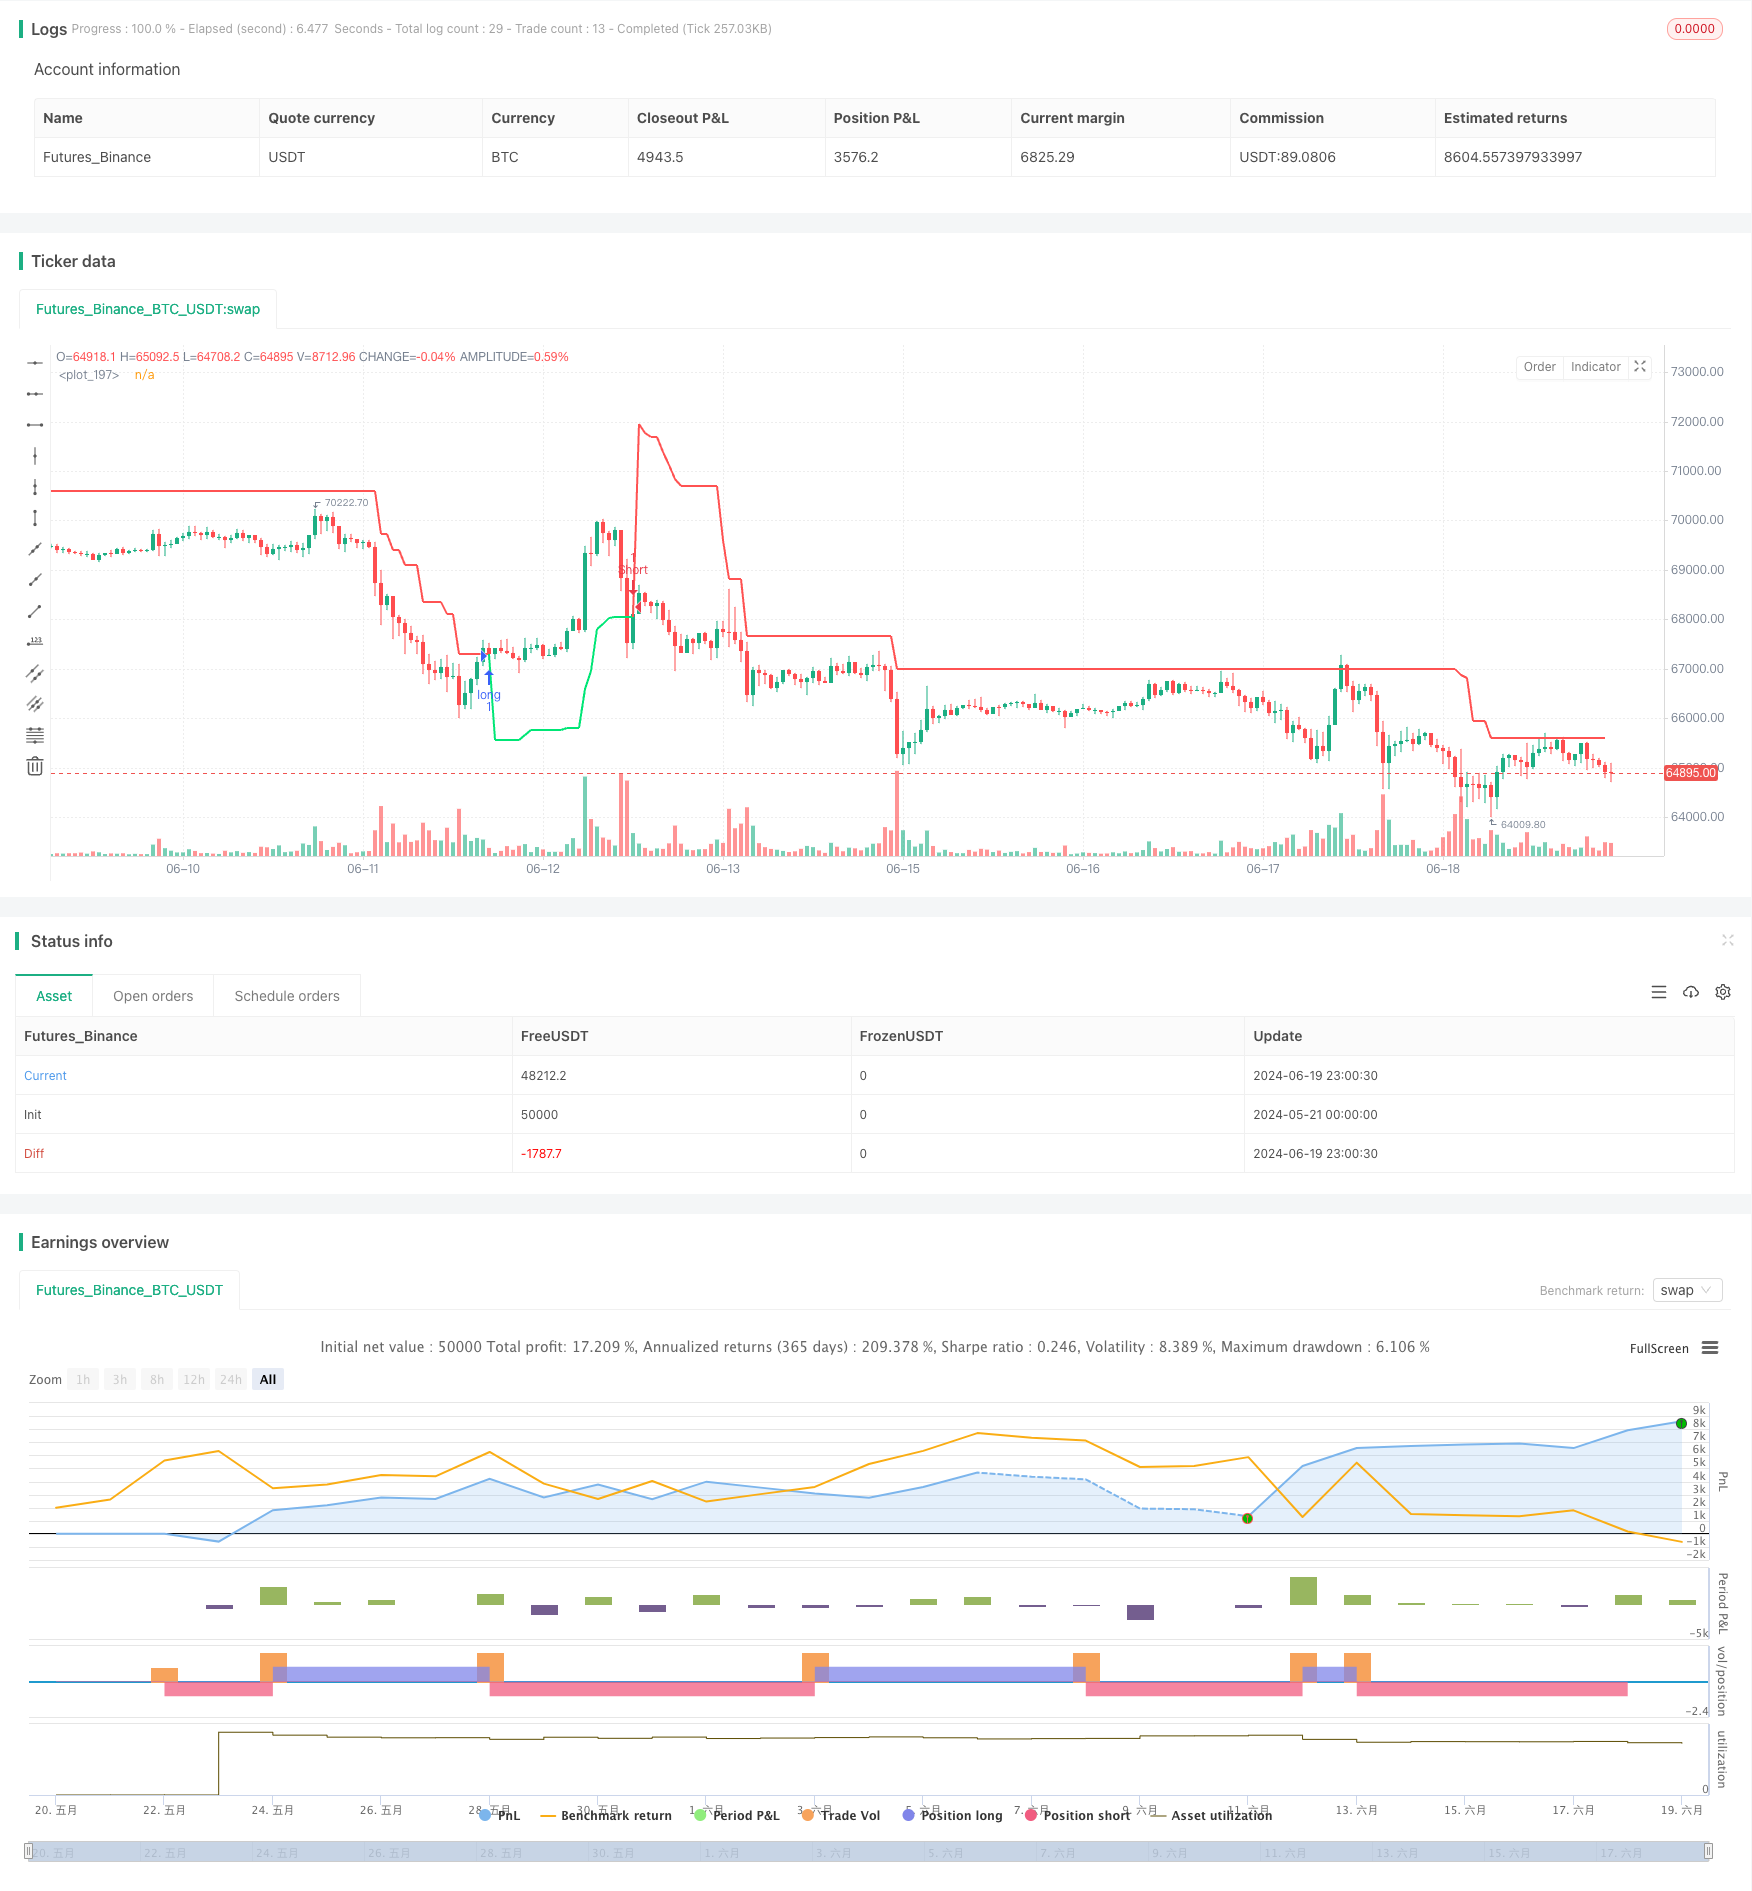
start: 2024-05-21 00:00:00
end: 2024-06-20 00:00:00
period: 1h
basePeriod: 15m
exchanges: [{"eid":"Futures_Binance","currency":"BTC_USDT"}]
*/
//@version=5
strategy("VAWSI and Trend Persistance Reversal", overlay=true, max_bars_back = 4999, process_orders_on_close = true)
//INPUTS
sltp = input.float(title = "Minimum SL/TP", defval = 5.0)
rsi_weight = input.float(title = "Wawsi weight", defval = 100.0)
half_weight= input.float(title = "Trend Persistence Weight", defval = 79.0)
atr_weight = input.float(title = "ATR Weight", defval = 20.0)
com_mult = input.float(title = "Combination Mult", defval = 1, step = .001)
smoothing = input.int(title = "Trend Persistence smooth length", defval = 3)
CycPart = input.float(1.1, step = .001, title = "Length Cycle Decimal")
src = close
hclose = request.security(ticker.heikinashi(syminfo.tickerid), timeframe.period, src)
//BlackCat1402's Dynamic Length Calculation
EhlersHoDyDC(Price, CycPart) =>
// Vars:
Smooth = 0.00
Detrender = 0.00
I1 = 0.00
Q1 = 0.00
jI = 0.00
jQ = 0.00
I2 = 0.00
Q2 = 0.00
Re = 0.00
Im = 0.00
Period = 0.00
SmoothPeriod = 0.00
pi = 2 * math.asin(1)
DomCycle = 0.0
//Hilbert Transform
Smooth := bar_index > 5 ? (4 * Price + 3 * nz(Price[1]) + 2 * nz(Price[2]) + nz(Price[3])) / 10 : Smooth
Detrender := bar_index > 5 ? (.0962 * Smooth + .5769 * nz(Smooth[2]) - .5769 * nz(Smooth[4]) - .0962 * nz(Smooth[6])) * (.075 * nz(Period[1]) + .54) : Detrender
//Compute InPhase and Quadrature components
Q1 := bar_index > 5 ? (.0962 * Detrender + .5769 * nz(Detrender[2]) - .5769 * nz(Detrender[4]) - .0962 * nz(Detrender[6])) * (.075 * nz(Period[1]) + .54) : Q1
I1 := bar_index > 5 ? nz(Detrender[3]) : I1
//Advance the phase of I1 and Q1 by 90 degrees
jI := (.0962 * I1 + .5769 * nz(I1[2]) - .5769 * nz(I1[4]) - .0962 * nz(I1[6])) * (.075 * nz(Period[1]) + .54)
jQ := (.0962 * Q1 + .5769 * nz(Q1[2]) - .5769 * nz(Q1[4]) - .0962 * nz(Q1[6])) * (.075 * nz(Period[1]) + .54)
//Phasor addition for 3 bar averaging
I2 := I1 - jQ
Q2 := Q1 + jI
//Smooth the I and Q components before applying the discriminator
I2 := .2 * I2 + .8 * nz(I2[1])
Q2 := .2 * Q2 + .8 * nz(Q2[1])
//Homodyne Discriminator
Re := I2 * nz(I2[1]) + Q2 * nz(Q2[1])
Im := I2 * nz(Q2[1]) - Q2 * nz(I2[1])
Re := .2 * Re + .8 * nz(Re[1])
Im := .2 * Im + .8 * nz(Im[1])
Period := Im != 0 and Re != 0 ? 2 * pi / math.atan(Im / Re) : Period
Period := Period > 1.5 * nz(Period[1]) ? 1.5 * nz(Period[1]) : Period
Period := Period < .67 * nz(Period[1]) ? .67 * nz(Period[1]) : Period
//Limit Period to be within the bounds of 6 bar and 50 bar cycles
Period := Period < 6 ? 6 : Period
Period := Period > 50 ? 50 : Period
Period := .2 * Period + .8 * nz(Period[1])
SmoothPeriod := .33 * Period + .67 * nz(SmoothPeriod[1])
//it can add filter to Period here
DomCycle := math.ceil(CycPart * SmoothPeriod) > 34 ? 34 : math.ceil(CycPart * SmoothPeriod) < 1 ? 1 : math.ceil(CycPart * SmoothPeriod)
DomCycle
wma(src, length) =>
wma = 0.0
sum = 0.0
norm = length * (length + 1) / 2
for i = 0 to length - 1
sum := sum + src[i] * (length - i)
wma := sum / norm
length = math.round(math.ceil(EhlersHoDyDC(hclose,CycPart)))
// Traditional Function initialization
highest_custom(src, length) =>
x = src
for i = 0 to math.min(length, 4999)
if src[i] > x
x := src[i]
x
lowest_custom(src, length) =>
x = src
for i = 0 to math.min(length, 4999)
if src[i] < x
x := src[i]
x
rma(src, len) =>
sum = 0.0
for i = 0 to len - 1
math.min(1, len)
sum += src[i]
rma = sum / len
rma := nz(rma[1]) * (len - 1) / len + src / len
sma(src, length) =>
math.sum(src, length) / length
hln(src, length) =>
TR = math.max(math.abs(src - src[1]), high - low)
TR := src / math.abs(ta.change(rma(TR, length)))
TR := (1 / TR) * 100
vawma(src, length) =>
atr = ta.atr(1)
aavg = sma(atr, length)
vavg = sma(volume, length)
weighted_sum = 0.0
sum_weights = 0.0
weighted = 0.0
for i = 0 to length
weight = ((volume[i] / vavg + (atr[i]) / aavg) / 2)
weighted_sum += src[i] * weight
sum_weights += weight
a = (weighted_sum / sum_weights)
vawsi(src, len) =>
rmaUp = vawma(math.max(ta.change(src), 0), len)
rmaDown = vawma(-math.min(ta.change(src), 0), len)
rsi = 100 - (100 / (1 + rmaUp / rmaDown))
trendPersistence(src, length, smoothing) =>
trendu = math.abs(src - highest_custom(src, length))
trendd = math.abs(src - lowest_custom(src, length))
trendu := wma(trendu, smoothing)
trendd := wma(trendd, smoothing)
trendu := ta.change(ta.cum(trendu))
trendd := ta.change(ta.cum(trendd))
trend = wma(math.max(trendu, trendd), smoothing)
rmaUp = rma(math.max(ta.change(trend), 0), length)
rmaDown = rma(-math.min(ta.change(trend), 0), length)
rsi = 100 - (100 / (1 + rmaUp / rmaDown))
//Strategy Calculations
sl = ((100 - sltp) / 100) * close
tp = ((100 + sltp) / 100) * close
var bool crossup = na
var bool crossdown = na
var float dir = na
var float BearGuy = 0
BullGuy = ta.barssince(crossup or crossdown)
if na(BullGuy)
BearGuy += 1
else
BearGuy := math.min(BullGuy, 4999)
rsiw = rsi_weight / 100
cew = half_weight / 100
atrw = atr_weight / 100
atr = hln(hclose, length) * atrw
ce = 1 / trendPersistence(hclose, length, smoothing)
com = 1 / math.max(math.abs(vawsi(hclose, length) - 50) * 2, 20)
comfin = (((com * rsiw) + (ce * cew) - atr)) * com_mult
lower = highest_custom(math.min((math.max(highest_custom(src, BearGuy) * (1 - comfin), sl)), src[1]), BearGuy)
upper = lowest_custom(math.max((math.min(lowest_custom(src, BearGuy) * (1 + comfin), tp)), src[1]), BearGuy)
var float thresh = na
if na(thresh)
thresh := lower
if na(dir)
dir := 1
if crossdown
dir := -1
if crossup
dir := 1
if dir == 1
thresh := lower
if dir == -1
thresh := upper
crossup := ta.crossover(hclose, thresh) and barstate.isconfirmed
crossdown := ta.crossunder(hclose, thresh) and barstate.isconfirmed
//STRATEGY
if crossup
strategy.entry("long", strategy.long)
if crossdown
strategy.entry("Short", strategy.short)
//PLOTTING
col = hclose > thresh ? color.lime : color.red
plot(thresh, linewidth = 2, color = color.new(col[1], 0))