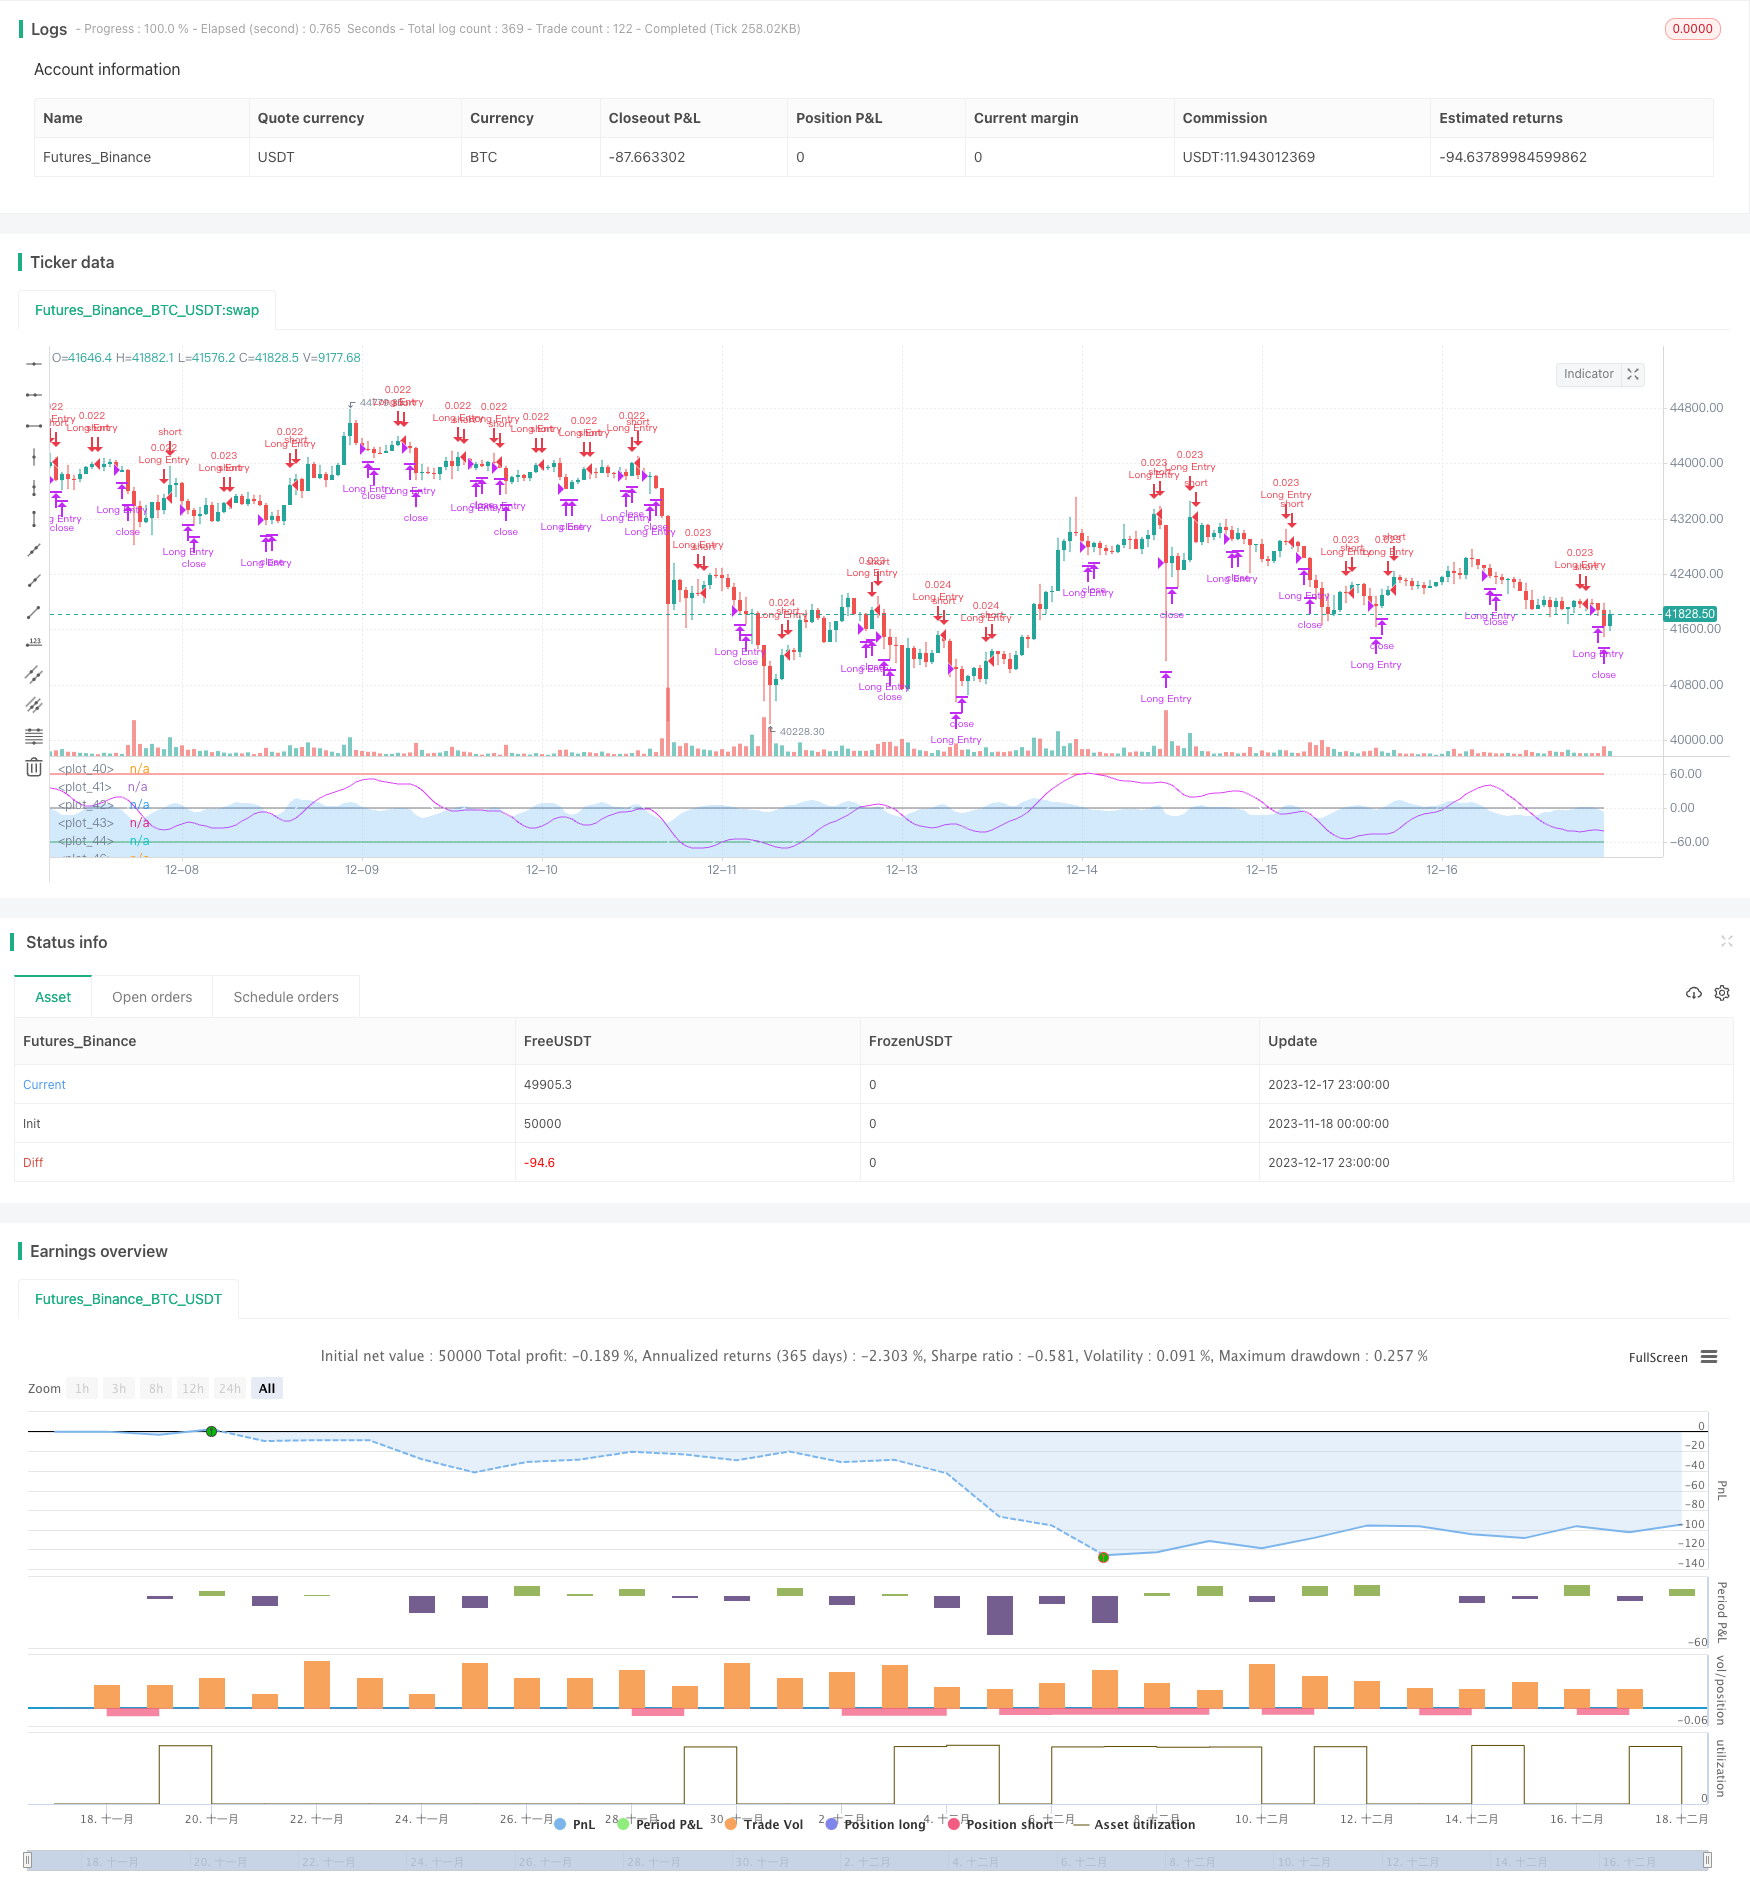
তরঙ্গ প্রবণতার উপর ভিত্তি করে ট্রেডিং কৌশল

ওভারভিউ
এটি একটি ট্রেডিং কৌশল যা LazyBear এর তরঙ্গ প্রবণতা সূচক উপর ভিত্তি করে তৈরি করা হয়েছে। এই কৌশলটি মূল্যের ওঠানামা দ্বারা তরঙ্গ প্রবণতা গণনা করে, বাজারের ওভারবয় ওভারসোলের বিচার করে, লং এবং শর্টিং করে।
কৌশল নীতি
এই কৌশলটি মূলত LazyBear এর তরঙ্গ প্রবণতা সূচকের উপর ভিত্তি করে তৈরি করা হয়েছে। প্রথমে দামের গড় মূল্য গণনা করা হয় (AP), তারপরে AP এর সূচকীয় চলমান গড় (ESA) এবং নিখুঁত মূল্য পরিবর্তনের সূচকীয় চলমান গড় (D) গণনা করা হয়। এর উপর ভিত্তি করে তরঙ্গ প্রবণতা লাইন (WT) পাওয়ার জন্য তরঙ্গের সূচক গণনা করা হয় (CI), তারপরে CI এর সূচকীয় চলমান গড় গণনা করা হয় (CI) । তারপরে WT1 এবং WT2 তৈরি করা হয় সহজ চলমান গড়ের মাধ্যমে। WT1 যখন WT2 অতিক্রম করে তখন এটি একটি স্বর্ণকেশী ক্রস করে, এটি বেশি করে; যখন WT1 WT2 অতিক্রম করে তখন এটি একটি মৃত ক্রস করে, এটি খালি করে দেয়।
সামর্থ্য বিশ্লেষণ
এটি একটি খুব সহজ কিন্তু খুব কার্যকরী ট্রেন্ড ট্র্যাকিং কৌশল। এর প্রধান সুবিধা হলঃ
- তরঙ্গ প্রবণতা সূচকগুলির উপর ভিত্তি করে, মূল্য প্রবণতা এবং বাজারের মেজাজকে স্পষ্টভাবে সনাক্ত করা যায়
- WT এর গোল্ডেন ক্রস এবং ডেথ ক্রস দ্বারা নির্ধারণ করা হয় যে আপনি কি করতে চান এবং আপনি কি করতে চান না, সহজেই কাজ করা যায়
- কাস্টমাইজযোগ্য প্যারামিটার WT লাইন সংবেদনশীলতা সামঞ্জস্য বিভিন্ন সময়কাল
- আরও শর্তাধীন ফিল্টারিং সংকেত যোগ করা যেতে পারে, যেমন লেনদেনের সময় উইন্ডো সীমাবদ্ধ করা
ঝুঁকি বিশ্লেষণ
এই কৌশলটির কিছু ঝুঁকিও রয়েছেঃ
- ট্রেন্ড ট্র্যাকিং কৌশল হিসাবে, মার্কেটের সমন্বয়ে প্রচুর ভুল সংকেত তৈরি করা সহজ
- ডব্লিউটি লাইন নিজেই পিছিয়ে আছে এবং দামের দ্রুত পাল্টা পয়েন্ট মিস করতে পারে
- ডিফল্ট প্যারামিটার সব জাত এবং সময়কালের জন্য উপযুক্ত নাও হতে পারে, অপ্টিমাইজেশান প্রয়োজন
- কোন ক্ষতিপূরণ ব্যবস্থা নেই, একমুখী পজিশনের জন্য দীর্ঘ সময় লাগতে পারে
এই সমস্যা সমাধানের প্রধান উপায়গুলো হলঃ
- WT লাইন সংবেদনশীলতা সামঞ্জস্য করার জন্য অপ্টিমাইজেশান প্যারামিটার
- ভুল সংকেত এড়ানোর জন্য অন্যান্য সূচক যোগ করুন
- স্টপ লস এবং স্টপ থামো সেট করুন
- প্রতিদিনের লেনদেন বা পজিশনের সীমাবদ্ধতা
অপ্টিমাইজেশান দিক
এই কৌশলটি আরও উন্নত করার সুযোগ রয়েছেঃ
- WT এর প্যারামিটারগুলিকে আরও সংবেদনশীল বা স্থিতিশীল করার জন্য অপ্টিমাইজ করুন
- বিভিন্ন সময়কালের উপর ভিত্তি করে বিভিন্ন প্যারামিটার সমন্বয়
- নিশ্চিতকরণ সংকেত হিসাবে মূল্য সংকেত, ওঠানামা ইত্যাদি যোগ করুন
- স্টপ লস এবং স্টপ লজিক যুক্ত করুন
- সমৃদ্ধ পজিশন হোল্ডিং পদ্ধতি, যেমন পিরামিড পজিশন, গ্রিড ট্রেডিং ইত্যাদি
- মেশিন লার্নিং এবং অন্যান্য পদ্ধতির সাথে মিলিত হয়ে আরও ভাল বৈশিষ্ট্য এবং ট্রেডিং নিয়মগুলি বের করা
সারসংক্ষেপ
এই কৌশলটি একটি খুব সহজ এবং ব্যবহারিক তরঙ্গ প্রবণতা ট্র্যাকিং কৌশল। এটি দামের ওঠানামা প্রবণতা গণনা করে, বাজারের ওভারব্লু ওভারসোলের অবস্থা সনাক্ত করে এবং ডব্লিউটি লাইনের গোল্ড ক্রস এবং ডেথ ক্রস ব্যবহার করে একটি লেনদেনের সংকেত দেয়। কৌশলটি পরিচালনা করা সহজ এবং বাস্তবায়ন করা সহজ। তবে ট্রেন্ডিং কৌশল হিসাবে, এটি শেয়ারের দামের সংবেদনশীলতা এবং স্থায়িত্বের জন্য আরও অপ্টিমাইজ করা দরকার, পাশাপাশি অন্যান্য সূচক এবং যুক্তির সাথে মিলিত হওয়া দরকার যাতে ভুল সংকেত এড়ানো যায়। সামগ্রিকভাবে, এটি একটি খুব ব্যবহারিক কৌশল টেমপ্লেট যা অপ্টিমাইজ করার জন্য প্রচুর জায়গা রয়েছে।
/*backtest
start: 2023-11-18 00:00:00
end: 2023-12-18 00:00:00
period: 1h
basePeriod: 15m
exchanges: [{"eid":"Futures_Binance","currency":"BTC_USDT"}]
*/

//
// @author LazyBear
//
// If you use this code in its original/modified form, do drop me a note.
//
//@version=4

// === INPUT BACKTEST RANGE ===
fromMonth = input(defval = 1,    title = "From Month",      type = input.integer, minval = 1, maxval = 12)
fromDay   = input(defval = 1,    title = "From Day",        type = input.integer, minval = 1, maxval = 31)
fromYear  = input(defval = 2021, title = "From Year",       type = input.integer, minval = 1970)
thruMonth = input(defval = 1,    title = "Thru Month",      type = input.integer, minval = 1, maxval = 12)
thruDay   = input(defval = 1,    title = "Thru Day",        type = input.integer, minval = 1, maxval = 31)
thruYear  = input(defval = 2112, title = "Thru Year",       type = input.integer, minval = 1970)

// === INPUT SHOW PLOT ===
showDate  = input(defval = true, title = "Show Date Range", type = input.bool)

// === FUNCTION EXAMPLE ===
start     = timestamp(fromYear, fromMonth, fromDay, 00, 00)        // backtest start window
finish    = timestamp(thruYear, thruMonth, thruDay, 23, 59)        // backtest finish window
window()  => true       // create function "within window of time"

n1 = input(10, "Channel Length")
n2 = input(21, "Average Length")
obLevel1 = input(60, "Over Bought Level 1")
obLevel2 = input(53, "Over Bought Level 2")
osLevel1 = input(-60, "Over Sold Level 1")
osLevel2 = input(-53, "Over Sold Level 2")

ap = hlc3
esa = ema(ap, n1)
d = ema(abs(ap - esa), n1)
ci = (ap - esa) / (0.015 * d)
tci = ema(ci, n2)

wt1 = tci
wt2 = sma(wt1,4)

plot(0, color=color.gray)
plot(obLevel1, color=color.red)
plot(osLevel1, color=color.green)
plot(obLevel2, color=color.red, style=3)
plot(osLevel2, color=color.green, style=3)

plot(wt1, color=color.white)
plot(wt2, color=color.fuchsia)
plot(wt1-wt2, color=color.new(color.blue, 80), style=plot.style_area)

//Strategy
strategy(title="T!M - Wave Trend Strategy", overlay = false, precision = 8, max_bars_back = 200, pyramiding = 0, initial_capital = 1000, currency = currency.NONE, default_qty_type = strategy.cash, default_qty_value = 1000, commission_type = "percent", commission_value = 0.1, calc_on_every_tick=false, process_orders_on_close=true)

longCondition  = crossover(wt1, wt2)
shortCondition = crossunder(wt1, wt2)

strategy.entry(id="Long Entry", comment="buy", long=true, when=longCondition and window())
strategy.close("Long Entry", comment="sell", when=shortCondition and window())

//strategy.entry(id="Short Entry", long=false, when=shortCondition)