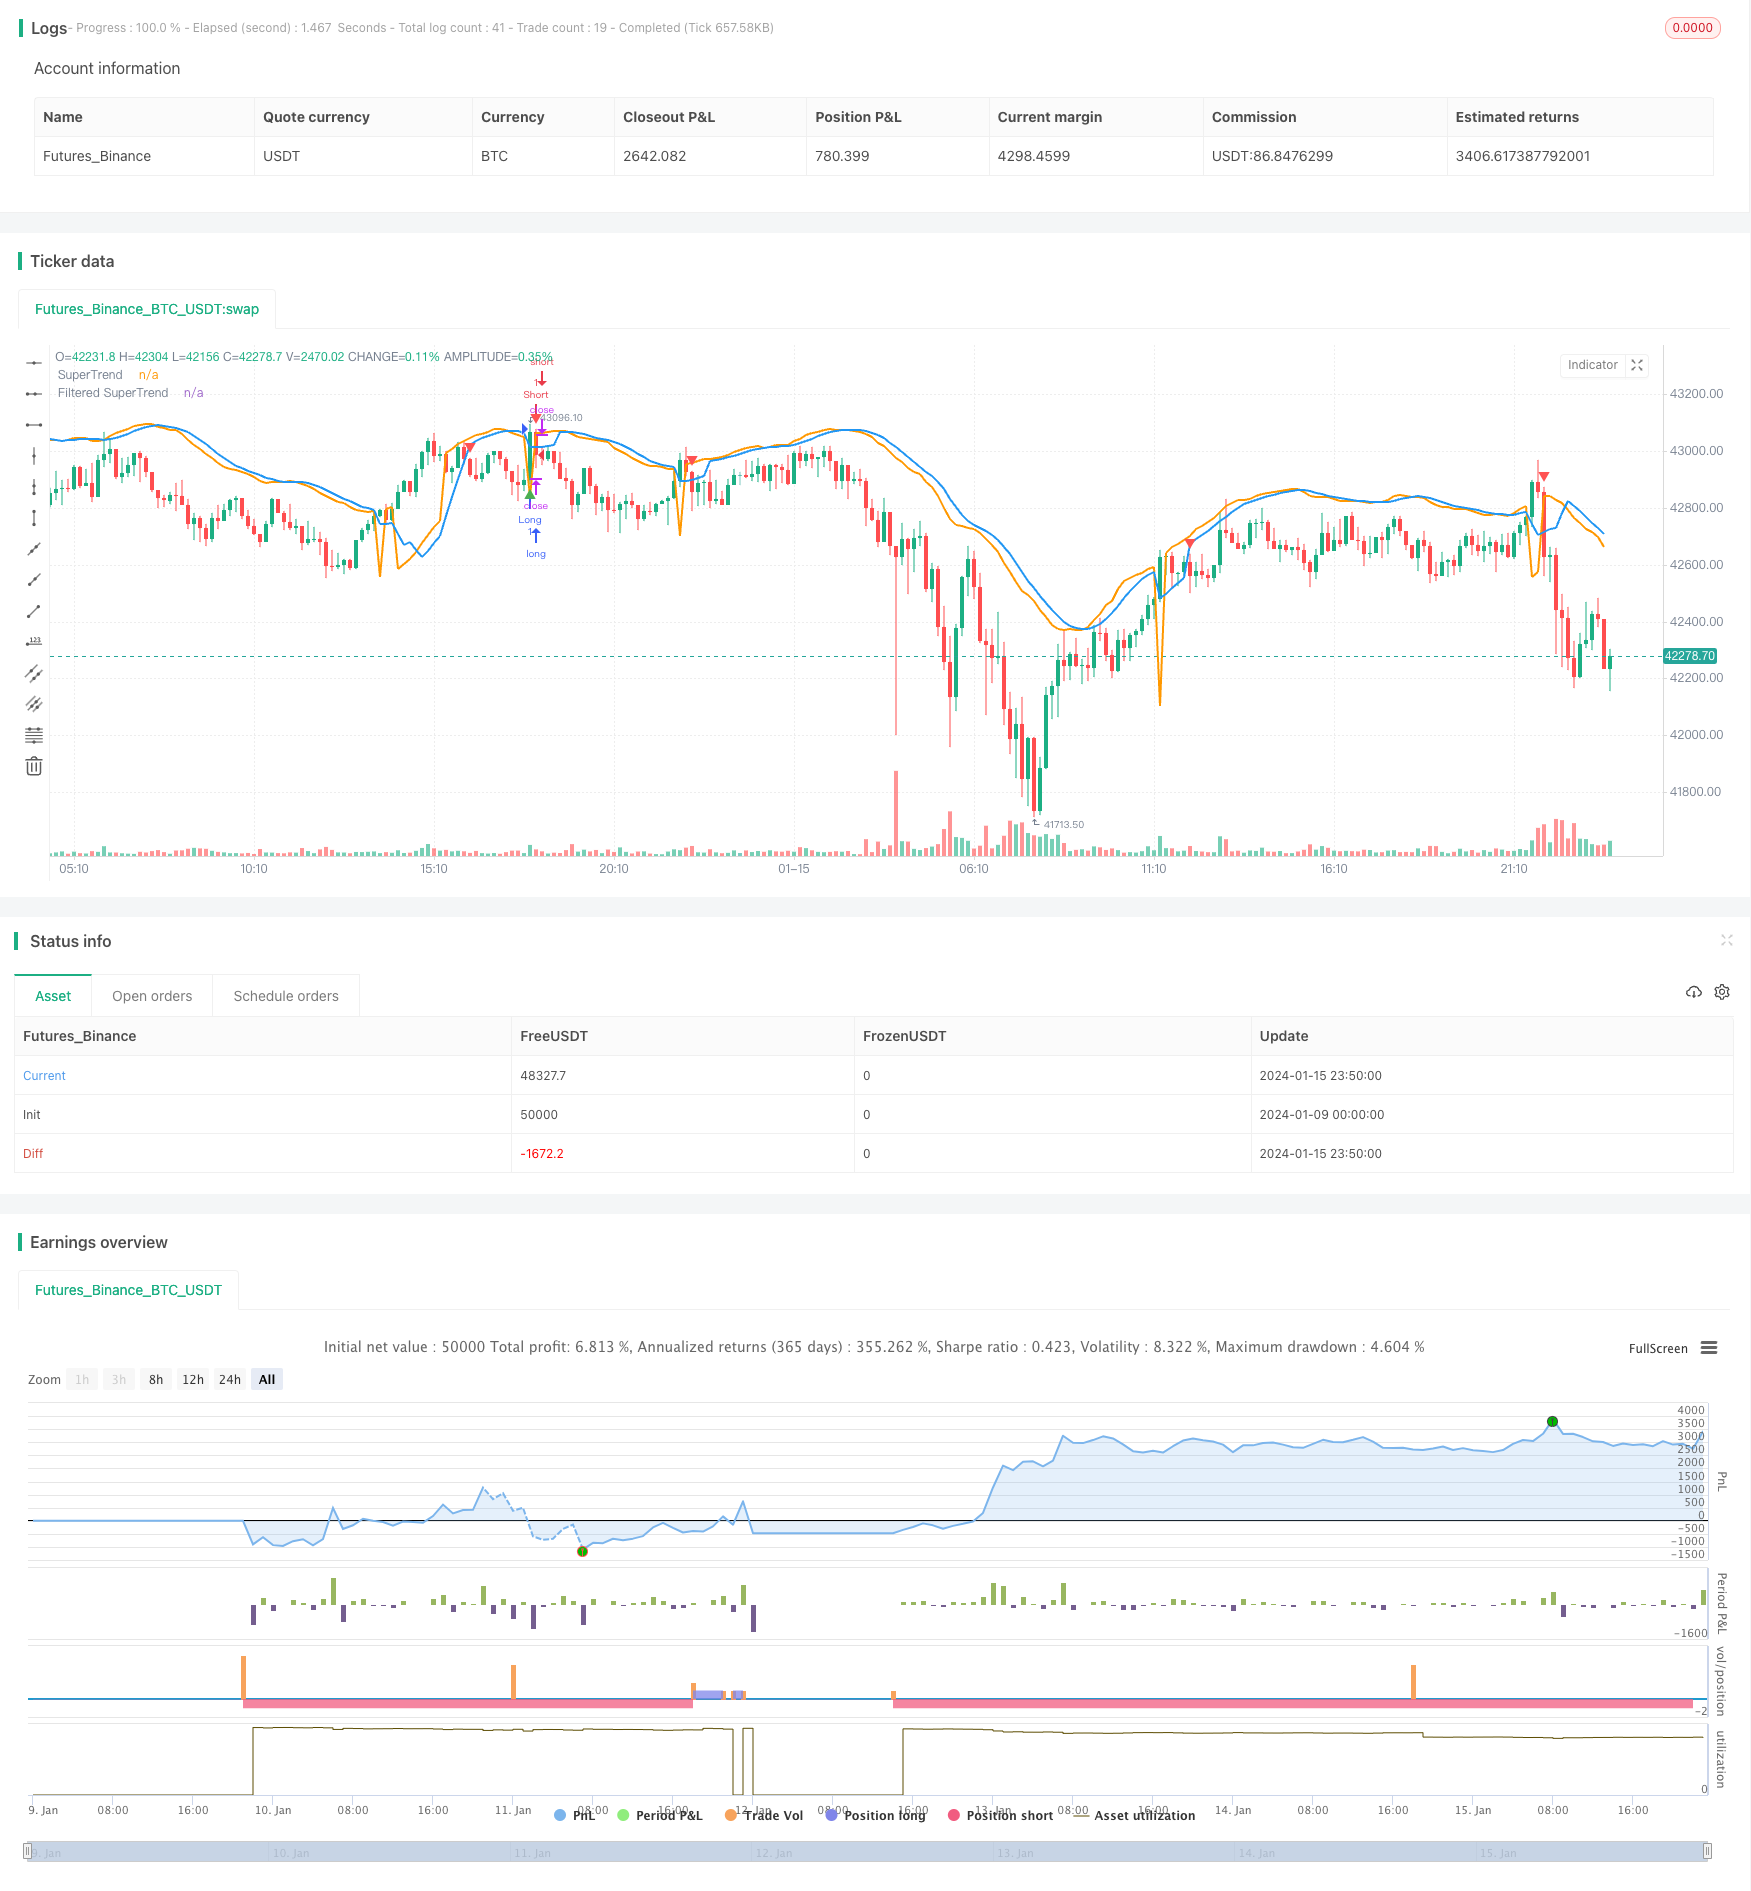
সুপারট্রেন্ড কৌশল উন্নত
লেখক:চাওঝাং, তারিখঃ ২০২৪-০১-১৭ ১৫ঃ৫৫ঃ১৫ট্যাগঃ

সারসংক্ষেপ
এই নিবন্ধটি একটি প্রবণতা অনুসরণকারী কৌশল গভীরভাবে বিশ্লেষণ করে যা সুপারট্রেন্ড সূচককে উন্নত নির্ভুলতার জন্য একটি স্টোকাস্টিক আরএসআই ফিল্টারের সাথে একত্রিত করে। এটি প্রচলিত প্রবণতা বিবেচনা করে এবং মিথ্যা সংকেত হ্রাস করার সময় কেনা এবং বিক্রয় সংকেত উত্পন্ন করার লক্ষ্যে। স্টোকাস্টিক আরএসআই ওভারকপ এবং ওভারসোল্ড শর্তে মিথ্যা সংকেতগুলি ফিল্টার করে।
কৌশলগত যুক্তি
সুপারট্রেন্ড হিসাব
প্রথমে, সত্য পরিসীমা (টিআর) এবং গড় সত্য পরিসীমা (এটিআর) গণনা করা হয়। তারপরে উপরের এবং নীচের ব্যান্ডগুলি এটিআর ব্যবহার করে গণনা করা হয়ঃ
উপরের ব্যান্ড = এসএমএ ((ক্লোজ, এটিআর পিরিয়ড) + এটিআর মল্টিপ্লায়ার * এটিআর নিম্ন ব্যান্ড = এসএমএ (ক্লোজ, এটিআর পিরিয়ড) - এটিআর মাল্টিপ্লায়ার * এটিআর
একটি আপট্রেন্ড চিহ্নিত করা হয় যখন বন্ধ > নিম্ন ব্যান্ড। একটি ডাউনট্রেন্ড চিহ্নিত করা হয় যখন বন্ধ < উপরের ব্যান্ড।
আপট্রেন্ডের সময়, সুপারট্রেন্ডটি নিম্ন ব্যান্ডে সেট করা হয়। ডাউনট্রেন্ডের সময়, সুপারট্রেন্ডটি উপরের ব্যান্ডে সেট করা হয়।
ফিল্টারিং প্রক্রিয়া
মিথ্যা সংকেত হ্রাস করার জন্য, সুপারট্রেন্ডটি ফিল্টার করা সুপারট্রেন্ড পেতে একটি চলমান গড় ব্যবহার করে মসৃণ করা হয়।
স্টোকাস্টিক আরএসআই
আরএসআই মান গণনা করা হয়, তারপরে স্টোকাস্টিক সূচকটি স্টোকাস্টিক আরএসআই তৈরি করতে এটিতে প্রয়োগ করা হয়। এটি দেখায় যে আরএসআই অতিরিক্ত ক্রয় বা অতিরিক্ত বিক্রি হয়েছে কিনা।
প্রবেশ ও প্রস্থান শর্তাবলী
লং এন্ট্রিঃ আপট্রেন্ড এবং স্টোকাস্টিক আরএসআই < ৮০ এর মধ্যে ফিল্টারকৃত সুপারট্রেন্ডের উপরে ক্লোজ ক্রস সংক্ষিপ্ত এন্ট্রিঃ ডাউনট্রেন্ড এবং স্টোকাস্টিক আরএসআই > ২০ এর মধ্যে ফিল্টারকৃত সুপারট্রেন্ডের নিচে ক্রস বন্ধ করুন
দীর্ঘ প্রস্থানঃ আপট্রেন্ডে ফিল্টারকৃত সুপারট্রেন্ডের নিচে ক্রস বন্ধ করুন
শর্ট আউটঃ ডাউনট্রেন্ডে ফিল্টারকৃত সুপারট্রেন্ডের উপরে ক্রস বন্ধ করুন
কৌশলটির সুবিধা
এই উন্নত প্রবণতা অনুসরণকারী কৌশলটি সহজ চলমান গড়ের তুলনায় নিম্নলিখিত প্রান্তগুলি রয়েছেঃ
- সুপারট্রেন্ড নিজেই ভাল ট্রেন্ড সনাক্তকরণ এবং মিথ্যা সংকেত ফিল্টারিং ক্ষমতা আছে।
- ফিল্টারিং প্রক্রিয়াটি আরও মিথ্যা সংকেত হ্রাস করে যা আরও নির্ভরযোগ্য সংকেত দেয়।
- স্টোকাস্টিক আরএসআই ওভারকুপ/ওভারসোল্ড শর্তে গুরুত্বপূর্ণ সাপোর্ট/রেসিস্ট্যান্স স্তরের আশেপাশে মিথ্যা সংকেত এড়ায়।
- কৌশলটি প্রবণতা দিক এবং অতিরিক্ত ক্রয়/অতিরিক্ত বিক্রয় উভয়ই বিবেচনা করে যা প্রবণতা অনুসরণ এবং মিথ্যা সংকেত এড়ানোর মধ্যে আরও ভাল ভারসাম্য তৈরি করে।
- নমনীয় পরামিতি সমন্বয় বিভিন্ন বাজারের পরিবেশে অভিযোজন করতে সক্ষম।
ঝুঁকি এবং অপ্টিমাইজেশন
সম্ভাব্য ঝুঁকি
- স্টপ লস উচ্চ অস্থিরতার সময় আঘাত করা যেতে পারে।
- সুপারট্রেন্ড এবং ফিল্টারিংয়ের সাথে সমস্যা রয়েছে যা সাম্প্রতিক মূল্য পরিবর্তনের কারণে অনুপস্থিত।
- ভুল স্টোকাস্টিক আরএসআই প্যারামিটার সেটিংস কৌশল কর্মক্ষমতা প্রভাবিত।
ঝুঁকি ব্যবস্থাপনা
- স্টপ লস যথাযথভাবে সামঞ্জস্য করুন অথবা ট্রেলিং স্টপ লস ব্যবহার করুন।
- লেগিং এফেক্টের ভারসাম্য বজায় রাখতে এটিআর পিরিয়ড এবং ফিল্টার পিরিয়ডের মতো প্যারামিটারগুলি টিউন করুন।
- স্টোকাস্টিক আরএসআই পরামিতি পরীক্ষা এবং অপ্টিমাইজ করুন।
অপ্টিমাইজেশান সুযোগ
- সর্বোত্তম পরামিতি খুঁজে পেতে বিভিন্ন পরামিতি সংমিশ্রণ পরীক্ষা করুন।
- বিভিন্ন ফিল্টারিং প্রক্রিয়া যেমন ইএমএ মসৃণকরণ ইত্যাদি চেষ্টা করুন।
- মেশিন লার্নিং প্রয়োগ করে স্বয়ংক্রিয়ভাবে প্যারামিটার অপ্টিমাইজ করা।
- প্রবেশের শর্তাবলীর পরিপূরক হিসাবে অন্যান্য সূচক অন্তর্ভুক্ত করুন।
সিদ্ধান্ত
এই কৌশলটি কার্যকর প্রবণতা সনাক্তকরণ এবং মানসম্পন্ন ট্রেড সংকেতগুলির জন্য সুপারট্রেন্ড এবং স্টোকাস্টিক আরএসআইয়ের শক্তিকে একত্রিত করে, পাশাপাশি ফিল্টারিং প্রক্রিয়াগুলির মাধ্যমে কৌশলটিকে বাজারের গোলমালের প্রতি শক্তিশালী করে তোলে। পরামিতি অপ্টিমাইজেশান বা অন্যান্য সূচক / মডেলগুলির সাথে একত্রিত করে আরও পারফরম্যান্সের উন্নতি অর্জন করা যেতে পারে। সামগ্রিকভাবে, এই কৌশলটি স্থিতিশীল রিটার্নের সন্ধানে ভাল প্রবণতা অনুসরণ করার ক্ষমতা এবং কিছু ঝুঁকি নিয়ন্ত্রণ প্রদর্শন করে।
/*backtest
start: 2024-01-09 00:00:00
end: 2024-01-16 00:00:00
period: 10m
basePeriod: 1m
exchanges: [{"eid":"Futures_Binance","currency":"BTC_USDT"}]
*/

//@version=5
strategy("Improved SuperTrend Strategy with Stochastic RSI", shorttitle="IST+StochRSI", overlay=true)

// Input parameters
atr_length = input(14, title="ATR Length")
atr_multiplier = input(1.5, title="ATR Multiplier")
filter_length = input(5, title="Filter Length")
stoch_length = input(14, title="Stochastic RSI Length")
smooth_k = input(3, title="Stochastic RSI %K Smoothing")

// Calculate True Range (TR) and Average True Range (ATR)
tr = ta.rma(ta.tr, atr_length)
atr = ta.rma(tr, atr_length)

// Calculate SuperTrend
upper_band = ta.sma(close, atr_length) + atr_multiplier * atr
lower_band = ta.sma(close, atr_length) - atr_multiplier * atr

is_uptrend = close > lower_band
is_downtrend = close < upper_band

super_trend = is_uptrend ? lower_band : na
super_trend := is_downtrend ? upper_band : super_trend

// Filter for reducing false signals
filtered_super_trend = ta.sma(super_trend, filter_length)

// Calculate Stochastic RSI
rsi_value = ta.rsi(close, stoch_length)
stoch_rsi = ta.sma(ta.stoch(rsi_value, rsi_value, rsi_value, stoch_length), smooth_k)

// Entry conditions
long_condition = ta.crossover(close, filtered_super_trend) and is_uptrend and stoch_rsi < 80
short_condition = ta.crossunder(close, filtered_super_trend) and is_downtrend and stoch_rsi > 20

// Exit conditions
exit_long_condition = ta.crossunder(close, filtered_super_trend) and is_uptrend
exit_short_condition = ta.crossover(close, filtered_super_trend) and is_downtrend

// Plot SuperTrend and filtered SuperTrend
plot(super_trend, color=color.orange, title="SuperTrend", linewidth=2)
plot(filtered_super_trend, color=color.blue, title="Filtered SuperTrend", linewidth=2)

// Plot Buy and Sell signals
plotshape(series=long_condition, title="Buy Signal", color=color.green, style=shape.triangleup, location=location.belowbar)
plotshape(series=short_condition, title="Sell Signal", color=color.red, style=shape.triangledown, location=location.abovebar)

// Output signals to the console for analysis
plotchar(long_condition, "Long Signal", "▲", location.belowbar, color=color.green, size=size.small)
plotchar(short_condition, "Short Signal", "▼", location.abovebar, color=color.red, size=size.small)

// Strategy entry and exit
strategy.entry("Long", strategy.long, when=long_condition)
strategy.entry("Short", strategy.short, when=short_condition)
strategy.close("Long", when=exit_long_condition)
strategy.close("Short", when=exit_short_condition)
- বিপরীত গতির ট্রেডিং কৌশল
- ব্যান্ডপাস মিডান পিবি ইন্ডিকেটর কৌশল
- আরএসআই ও ফিবোনাচি ৫ মিনিটের ট্রেডিং কৌশল
- এমএসিডি পরিমাণগত কৌশল সহ ট্রিপল চলমান গড়
- ইম্পুটাম ব্রেকআউট অপ্টিমাইজেশন
- বেসলাইন ক্রস ক্লাইফাইয়ার ATR Volatility & HMA Trend Bias Mean Reversal Strategy
- অস্থিরতা ব্যান্ড এবং ভিডাব্লুএপি মাল্টি-টাইমফ্রেম স্টক ট্রেন্ড ট্রেডিং কৌশল
- ক্রসওভার ক্যাপচার কৌশল সহ মূল্য বিপরীত
- এহেলার্স স্টোকাস্টিক সাইবার চক্র কৌশল
- ফিবোনাচি স্তরের উপর ভিত্তি করে দৈনিক উচ্চ-নিম্ন মূল্যের অগ্রগতি
- ম্যাকডি, আরএসআই এবং আরভিওএলকে একত্রিত করে পরিমাণগত ট্রেডিং কৌশল
- ইম্পোমেন্ট ইনভার্সন ট্র্যাকিং কৌশল
- EMA এবং SMA ক্রসওভারের উপর ভিত্তি করে কৌশল অনুসরণ করে প্রবণতা
- সহজ পিভট বিপরীত অ্যালগরিদমিক ট্রেডিং কৌশল
- ADX সূচক ভিত্তিক অভিযোজিত ট্রেডিং কৌশল
- ডায়নামিক চ্যানেল ব্রেকআউট কৌশল
- মাল্টি-ফিল্টার বোলিংজার ব্যান্ড ট্রেডিং কৌশল
- সত্যিকারের পরিসরের উপর ভিত্তি করে ওজনযুক্ত চলমান গড় ক্রস পিরিয়ড কৌশল
- ডুয়াল এসএএমএ মিনটেম কৌশল
- ইম্পোমেন্টাম মিডিয়ান ডিভিয়েশন ব্রুকথ্রু কৌশল