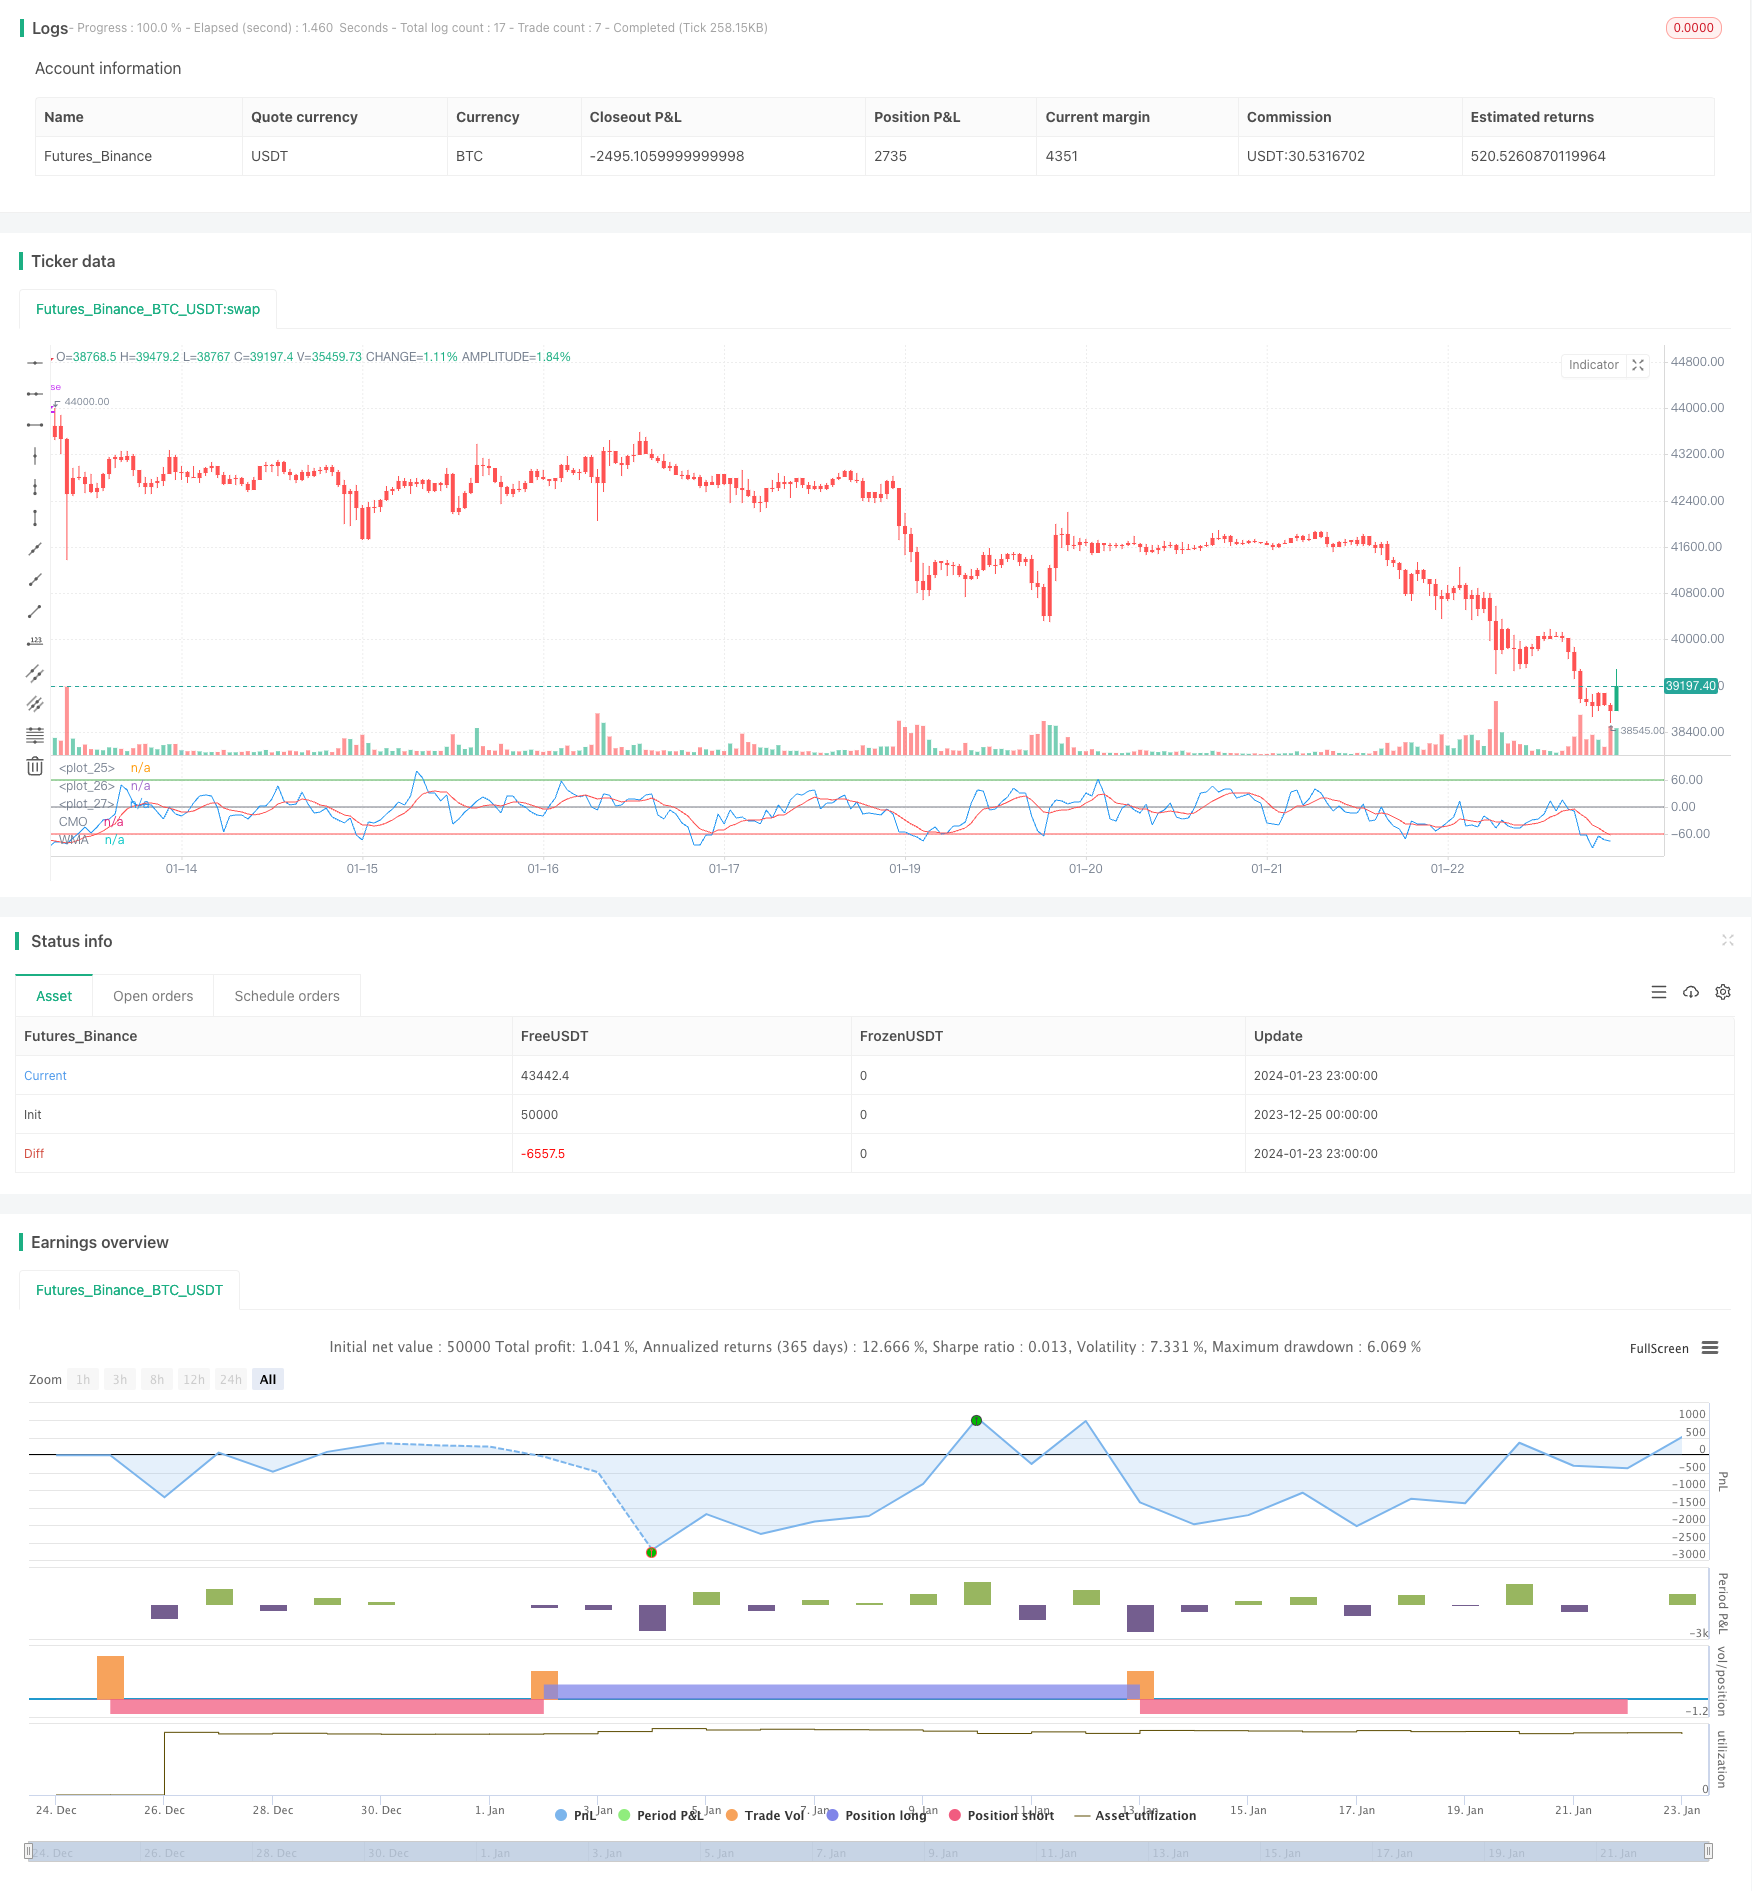
CMO এবং WMA এর উপর ভিত্তি করে ডাবল মুভিং এভারেজ ট্রেডিং কৌশল

ওভারভিউ
এই কৌশলটি একটি দ্বি-সমান্তরিত ট্রেডিং কৌশল যা মূল্যের গতিশীলতার সূচক চন্দ্রের গতিশীলতা অস্থিরকারী (CMO) এবং তার ওজনের চলমান গড় (WMA) এর উপর ভিত্তি করে। এটি প্রবণতা বিপর্যয় এবং ধারাবাহিকতা সনাক্ত করার চেষ্টা করে।
কৌশল নীতি
এই কৌশলটি প্রথমে সিএমও হিসাব করে, এই সূচকটি মূল্যের অনলাইন গতিশীলতার পরিবর্তনকে পরিমাপ করে। একটি ইতিবাচক মান একটি উচ্চ গতির প্রতিনিধিত্ব করে এবং একটি নেতিবাচক মান একটি নিম্ন গতির প্রতিনিধিত্ব করে। তারপরে সিএমওর ডাব্লুএমএ হিসাব করা হয়। সিএমও যখন তার ডাব্লুএমএ অতিক্রম করে তখন একটি মুদ্রাস্ফীতির অবস্থান নেয়; যখন সিএমও তার ডাব্লুএমএ অতিক্রম করে তখন একটি মুদ্রাস্ফীতির অবস্থান নেয়। এই কৌশলটি CMO এবং WMA এর ক্রস ব্যবহার করে প্রবণতাতে টার্নিং পয়েন্টগুলি ক্যাপচার করার প্রচেষ্টা করে।
সিএমও হিসাবের মূল পদক্ষেপগুলি হলঃ
- দৈনিক মূল্য পরিবর্তন গণনা করুন (xMom)
- দামের পরিবর্তনের জন্য n-দিনের এসএমএ, একটি বাস্তব মোমের দামের গতিশীলতা হিসাবে ((xSMA_mom)
- গণনা করুন n দিনের নেট মূল্য পরিবর্তন (xMomLength)
- net price change (nRes) কে SMA দ্বারা ভাগ করে
- স্ট্যান্ডার্ডাইজড নেট প্রাইস চেঞ্জের জন্য m দিনের WMA, CMO ((xWMACMO)
এই কৌশলটির সুবিধা হল মধ্যমেয়াদি মূল্য প্রবণতার বিপরীতমুখী পয়েন্টগুলি ধরা। সিএমওর পরম মানের আকারটি দামের চলমান প্রবণতার শক্তিকে প্রতিফলিত করে, ডাব্লুএমএ হ্রাসের জন্য অনুকূল।
সামর্থ্য বিশ্লেষণ
এই কৌশলটির সবচেয়ে বড় সুবিধা হল যে এটি সিএমও সূচকগুলির নিখুঁত মানগুলি ব্যবহার করে বাজারের জনসাধারণের মনোভাবের মূল্যায়ন করে। WMA ফিল্টারগুলি মধ্যমেয়াদী প্রবণতাগুলির বিপরীত দিকগুলি সনাক্ত করতে ব্যবহৃত হয়। একক চলমান গড় কৌশলগুলির তুলনায় এটি মধ্যমেয়াদী প্রবণতাগুলিকে আরও ভালভাবে ধরতে পারে।
সিএমও দামের পরিবর্তনকে মানক করে এবং এটিকে ১০০ থেকে ১০০ এর মধ্যে ম্যাপ করে যাতে বাজারের জনসাধারণের মনোভাবের বিচার করা যায়; নিখুঁত মানের আকারটি বর্তমান প্রবণতার তীব্রতাকে উপস্থাপন করে। ডাব্লুএমএ সিএমওর উপর অতিরিক্ত ফিউজিং করে যাতে খুব বেশি মিথ্যা সংকেত না থাকে।
ঝুঁকি বিশ্লেষণ
এই কৌশলটির প্রধান ঝুঁকিগুলো হলঃ
- সিএমও এবং ডাব্লুএমএ প্যারামিটারগুলি ভুলভাবে সেট করা হয়েছে, যার ফলে অনেকগুলি মিথ্যা সংকেত তৈরি হয়েছে
- প্রবণতা অস্থিরতার সাথে কার্যকরভাবে মোকাবিলা করতে অক্ষম, যার ফলে অত্যধিক ট্রেডিং ফ্রিকোয়েন্সি এবং স্লাইড পয়েন্টের ব্যয় হতে পারে
- সত্যিকারের দীর্ঘমেয়াদী প্রবণতা সনাক্ত করতে অক্ষম, দীর্ঘমেয়াদী পজিশনে ক্ষতির ঝুঁকি থাকতে পারে
এর জন্য নিচের পদ্ধতিগুলো ব্যবহার করা যেতে পারেঃ
- সিএমও এবং ডাব্লুএমএর প্যারামিটারগুলি সামঞ্জস্য করে সর্বোত্তম প্যারামিটার সমন্বয় খুঁজে বের করুন
- অতিরিক্ত ফিল্টারিং শর্ত যুক্ত করা, যেমন লেনদেনের পরিমাণের শক্তির সূচক, ঝড়ের সময় লেনদেন এড়ানো
- দীর্ঘমেয়াদী প্রবণতা এড়াতে 90 দিনের লাইনের মতো দীর্ঘমেয়াদী সূচকগুলির সাথে সংযুক্ত করুন
অপ্টিমাইজেশান দিক
এই কৌশলটি মূলত প্যারামিটার অপ্টিমাইজেশন, সিগন্যাল ফিল্টারিং এবং স্টপ লস এর উপর দৃষ্টি নিবদ্ধ করেঃ
সিএমও এবং ডাব্লুএমএ এর প্যারামিটার অপ্টিমাইজেশনঃ প্যারামিটারগুলির সর্বোত্তম সংমিশ্রণটি সন্ধান করুন
ট্রেডিং ভলিউম, শক্তিশালী এবং দুর্বল সূচক সহ সহকারী সূচকগুলির সাথে সংকেত ফিল্টার করুন, যাতে ভুয়া ব্রেকডাউনগুলি এড়ানো যায়
গতিশীল স্টপ-অফ ব্যবস্থা যোগ করা, যখন দাম আবার সিএমও এবং ডাব্লুএমএ-এর নিচে নেমে আসে তখন স্টপ-অফ করা
ব্রেকআউট ব্যর্থতার প্যাটার্নকে একটি প্রবেশের সংকেত হিসাবে বিবেচনা করা যেতে পারে, যেখানে সিএমও এবং ডাব্লুএমএ প্রথমে মূল পয়েন্টটি ভেঙে দেয় তবে শীঘ্রই আবার পড়ে যায়
বিপরীতমুখী ট্রেডিং এড়ানোর জন্য বড় প্রবণতা নির্ধারণের জন্য আরও দীর্ঘ-রেখা চক্রের সূচকগুলির সাথে মিলিত হতে পারে
সারসংক্ষেপ
এই কৌশলটি সামগ্রিকভাবে প্রবণতা শক্তি এবং বিপরীত পয়েন্টের মূল্যায়ন করার জন্য সিএমও সূচক ব্যবহার করে এবং ডাব্লুএমএর সাথে মিলিত হয়, এটি ট্রেডিং সিগন্যাল উত্পাদন করে। এটি একটি আদর্শ দ্বি-সমান্তরাল সিস্টেমের অন্তর্ভুক্ত। একক এমএ কৌশলটির তুলনায়, এটি মধ্যবর্তী প্রবণতাকে আরও দৃ stronger়ভাবে ধরার সুবিধা রয়েছে। তবে প্যারামিটার সেটিং এবং ঘূর্ণায়মানতার ক্ষেত্রে অপ্টিমাইজেশনের জায়গা রয়েছে, যথাযথভাবে ট্রেডিং ফ্রিকোয়েন্সি নিয়ন্ত্রণ এবং গতিশীল স্টপ লস প্রবর্তন করে, যা সিস্টেমের স্থিতিশীলতা আরও বাড়িয়ে তুলতে পারে।
/*backtest
start: 2023-12-25 00:00:00
end: 2024-01-24 00:00:00
period: 1h
basePeriod: 15m
exchanges: [{"eid":"Futures_Binance","currency":"BTC_USDT"}]
*/

//@version=3
////////////////////////////////////////////////////////////
//  Copyright by HPotter v1.0 18/10/2018
//    This indicator plots Chandre Momentum Oscillator and its WMA on the
//    same chart. This indicator plots the absolute value of CMO.
//    The CMO is closely related to, yet unique from, other momentum oriented
//    indicators such as Relative Strength Index, Stochastic, Rate-of-Change,
//    etc. It is most closely related to Welles Wilder?s RSI, yet it differs
//    in several ways:
//    - It uses data for both up days and down days in the numerator, thereby
//        directly measuring momentum;
//    - The calculations are applied on unsmoothed data. Therefore, short-term
//        extreme movements in price are not hidden. Once calculated, smoothing
//        can be applied to the CMO, if desired;
//    - The scale is bounded between +100 and -100, thereby allowing you to clearly
//        see changes in net momentum using the 0 level. The bounded scale also allows
//        you to conveniently compare values across different securities.
////////////////////////////////////////////////////////////
strategy(title="CMO & WMA Backtest ver 2.0", shorttitle="CMO & WMA")
Length = input(9, minval=1)
LengthWMA = input(9, minval=1)
BuyZone = input(60, step = 0.01)
SellZone = input(-60, step = 0.01)
reverse = input(false, title="Trade reverse")
hline(BuyZone, color=green, linestyle=line)
hline(SellZone, color=red, linestyle=line)
hline(0, color=gray, linestyle=line)
xMom = abs(close - close[1])
xSMA_mom = sma(xMom, Length)
xMomLength = close - close[Length]
nRes = 100 * (xMomLength / (xSMA_mom * Length))
xWMACMO = wma(nRes, LengthWMA)
pos = 0.0
pos := iff(xWMACMO > BuyZone, 1,
	   iff(xWMACMO < SellZone, -1, nz(pos[1], 0)))
possig = iff(reverse and pos == 1, -1,
          iff(reverse and pos == -1, 1, pos))
if (possig == 1)
    strategy.entry("Long", strategy.long)
if (possig == -1)
    strategy.entry("Short", strategy.short)
barcolor(possig == -1 ? red: possig == 1 ? green : blue )
plot(nRes, color=blue, title="CMO")
plot(xWMACMO, color=red, title="WMA")