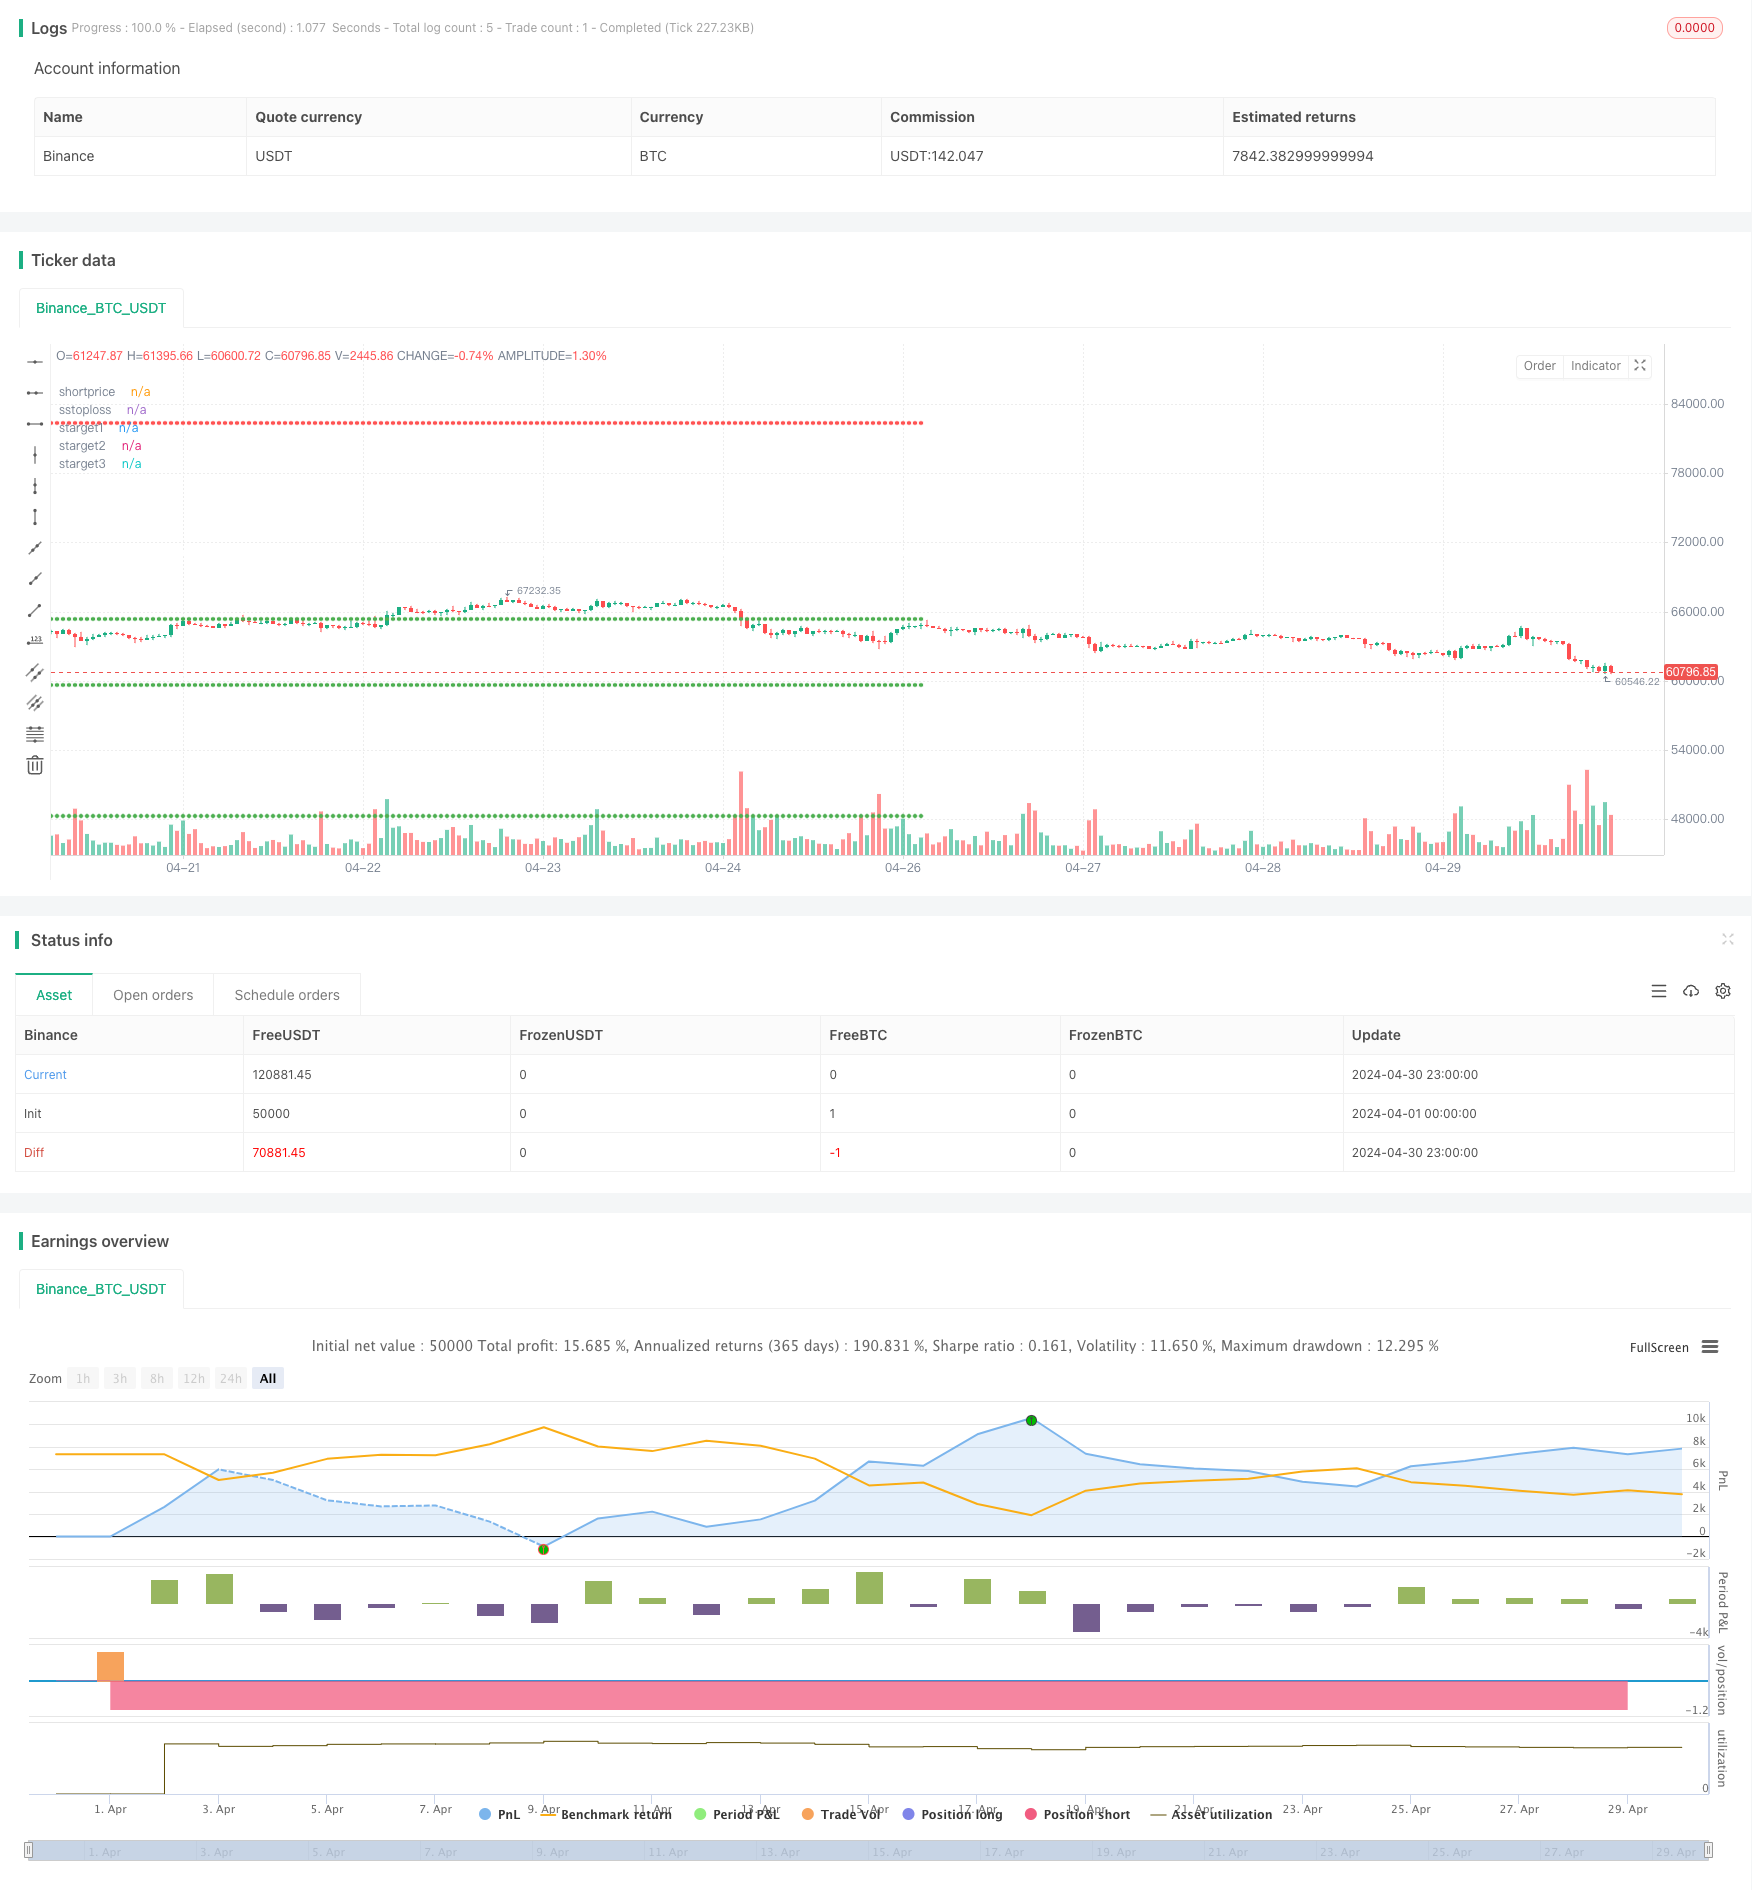
ওভারভিউ
এই কৌশলটি মূলত প্যারালাইন SAR সূচক ((PSAR) এবং সূচকীয় মুভিং এভারেজ ((EMA) এর ক্রস সিগন্যাল ব্যবহার করে, একাধিক কাস্টমাইজড শর্তের সাথে একত্রিত হয়ে একটি কেনা এবং বিক্রয় সংকেত তৈরি করে। কৌশলটির মূল ধারণাটি হ’লঃ যখন পিএসএআর নীচে থেকে ইএমএ ভেঙে এবং নির্দিষ্ট শর্ত পূরণ করে তখন একটি কেনা সংকেত তৈরি করে; যখন পিএসএআর উপরে থেকে ইএমএ ভেঙে এবং নির্দিষ্ট শর্ত পূরণ করে তখন একটি বিক্রয় সংকেত তৈরি করে। একই সাথে, কৌশলটি ঝুঁকি নিয়ন্ত্রণের জন্য স্টপ ওভার এবং স্টপ লসও সেট করে।
কৌশল নীতি
- পিএসএআর এবং ৩০-চক্রের ইএমএ গণনা করুন
- পিএসএআর এবং ইএমএ এর ক্রস-সম্পর্ক বিচার করুন এবং প্রতীক পয়েন্ট সেট করুন
- পিএসএআর এবং ইএমএর অবস্থানের সম্পর্ক, কে লাইনের রঙ ইত্যাদির সাথে সংযুক্ত করে আইজিসি (আইডিয়াল গ্রিন ক্যান্ডেল) এবং আইআরসি (আইডিয়াল রেড ক্যান্ডেল) সংজ্ঞায়িত করুন
- আইজিসি এবং আইআরসির মাধ্যমে ক্রয় এবং বিক্রয় সংকেত বিচার করা
- স্টপ এবং স্টপ লস সেট করুন, স্টপ লস ক্রয় মূল্যের ৮%, ১৬% এবং ৩২%, স্টপ লস ক্রয় মূল্যের ১৬%; বিক্রয় মূল্যের ৮%, ১৬% এবং ৩২%, স্টপ লস বিক্রয় মূল্যের ১৬%
- লেনদেনের সময় এবং পজিশন হোল্ডিংয়ের অবস্থা অনুযায়ী ক্রয়, বিক্রয় বা পজিশন অপারেশন সম্পাদন করা
কৌশলগত সুবিধা
- একাধিক সূচক এবং শর্তের সমন্বয়ে সংকেতের নির্ভরযোগ্যতা বৃদ্ধি পেয়েছে
- ঝুঁকি এবং লাভের উপর নমনীয় নিয়ন্ত্রণের জন্য একাধিক স্টপ ও লস সেটআপ
- বিভিন্ন বাজারের অবস্থার জন্য ক্রয় এবং বিক্রয় ফিল্টারিং শর্তাবলী সেট করে, কৌশলটির অভিযোজনযোগ্যতা বাড়ায়
- কোডটি সহজেই বোঝা যায় এবং পরিবর্তন করা যায়
কৌশলগত ঝুঁকি
- কৌশলগত প্যারামিটার সেটিংগুলি সমস্ত বাজার পরিস্থিতিতে উপযুক্ত নাও হতে পারে এবং বাস্তব পরিস্থিতির সাথে সামঞ্জস্য করতে হবে
- অস্থির বাজারে এই কৌশলটি ঘন ঘন ট্রেডিং সিগন্যাল হতে পারে, যার ফলে ট্রেডিং খরচ বৃদ্ধি পায়
- এই কৌশলটি বাজারের প্রবণতা সম্পর্কে বিচার করার অভাব এবং শক্তিশালী প্রবণতা বাজারে সুযোগ হারাতে পারে
- স্টপ লস সেটিংগুলি চরম পরিস্থিতির ঝুঁকিগুলি সম্পূর্ণরূপে এড়াতে পারে না
কৌশল অপ্টিমাইজেশনের দিকনির্দেশনা
- সিগন্যালের নির্ভুলতা ও নির্ভরযোগ্যতা বাড়াতে আরও প্রযুক্তিগত বা বাজার সংবেদন সূচক প্রবর্তন করা
- স্টপ এবং স্টপ লস সেটিং অপ্টিমাইজ করুন, ডায়নামিক স্টপ লস বা ওলট-পালট হার-ভিত্তিক স্টপ লস চালু করার কথা বিবেচনা করুন
- বিভিন্ন বাজারের অবস্থার জন্য বিভিন্ন ট্রেডিং প্যারামিটার এবং নিয়ম সেট করুন, কৌশলগুলির অভিযোজনযোগ্যতা বাড়ান
- তহবিল ব্যবস্থাপনা মডিউল যোগ করুন, অ্যাকাউন্টের ইক্যুইটি অনুপাত ব্যালেন্সের মতো বিষয়গুলির উপর ভিত্তি করে পজিশন এবং ঝুঁকির এক্সপোজারকে গতিশীলভাবে সামঞ্জস্য করুন
সারসংক্ষেপ
এই পরিমাণগত কৌশলটি পিএসএআর এবং ইএমএ সূচকগুলির উপর ভিত্তি করে তৈরি করা হয়, একাধিক কাস্টমাইজড শর্ত এবং নিয়মের মাধ্যমে ক্রয় এবং বিক্রয় সংকেত উত্পন্ন করে। এই কৌশলটি কিছুটা অভিযোজনযোগ্যতা এবং নমনীয়তার সাথে রয়েছে, তবে ঝুঁকি নিয়ন্ত্রণের জন্য স্টপ-অফ-লস অবস্থানও রয়েছে। তবে, কৌশলটির প্যারামিটার সেটিং এবং ঝুঁকি নিয়ন্ত্রণের ক্ষেত্রে আরও অপ্টিমাইজেশনের জায়গা রয়েছে। সামগ্রিকভাবে, এই কৌশলটি একটি মৌলিক টেমপ্লেট হিসাবে কাজ করতে পারে এবং আরও অপ্টিমাইজেশন এবং উন্নতির সাথে এটি একটি শক্তিশালী ট্রেডিং কৌশল হওয়ার সম্ভাবনা রয়েছে।
/*backtest
start: 2024-04-01 00:00:00
end: 2024-04-30 23:59:59
period: 1h
basePeriod: 15m
exchanges: [{"eid":"Binance","currency":"BTC_USDT"}]
*/

// This Pine Script™ code is subject to the terms of the Mozilla Public License 2.0 at https://mozilla.org/MPL/2.0/
// © SwapnilRaykar

//@version=5
strategy("aj sir second project", overlay=true, margin_long=100, margin_short=100)

start=input("0915-1515","session time")
st11=time(timeframe.period,start)
st=st11>0
et= not st

psar=ta.sar(0.02,0.02,0.2)
emared=ta.ema(close,30)
//plot(psar,"psar",color.yellow,style = plot.style_cross)
//plot(emared,"emared",color.red)
var crodownflag=0
var croupflag=0

var igcflag=0

var ircflag=0

cdown1=ta.crossunder(psar,emared)  and not (psar<close and psar[1]>close[1])
cup1=ta.crossover(psar,emared) and not (psar>close and psar[1]<close[1])

cdown=ta.crossunder(psar,emared)
cup=ta.crossover(psar,emared)


green_candle=close>open
red_candle=close<open

if ta.crossunder(psar,emared) and crodownflag==0  and not (psar<close and psar[1]>close[1])
    crodownflag:=1
else if cdown and crodownflag==1
    crodownflag:=0


if crodownflag==1 and green_candle and igcflag==0
    igcflag:=1
else if cdown and igcflag==1
    igcflag:=0

//plot(igcflag,"igcflag",color.lime)

if ta.crossover(psar,emared) and croupflag==0 and not (psar>close and psar[1]<close[1])
    croupflag:=1
else if cdown and croupflag==1
    croupflag:=0

//plot(crodownflag,"crodownflag",color.white)
irc_cond=croupflag==1 or cup

if (croupflag==1 and red_candle and ircflag==0)
    ircflag:=1
else if cup and croupflag==1
    ircflag:=0

igc_candle1=(igcflag==1 and igcflag[1]==0) or (cdown1 and green_candle)
irc_candle1=(ircflag==1 and ircflag[1]==0) or (cup1 and red_candle)
///////////////////////////
dm=dayofmonth(time)
newday=dm!=dm[1]
dmc=dm==ta.valuewhen(bar_index==last_bar_index,dm,0)

///////////////////////////////////////////
var irc_there=0

if irc_candle1[1] and irc_there==0
    irc_there:=1
else if cdown and irc_there==1
    irc_there:=0

irc_candle=irc_candle1 and irc_there==0// and dmc

var igc_there=0

if igc_candle1[1] and igc_there==0
    igc_there:=1
else if cup and igc_there ==1
    igc_there:=0

igc_candle=igc_candle1 and igc_there==0// and dmc
/////////// to get rid of irc being valid even after crossdown
var valid_igc_low=0
var valid_irc_high=0

if irc_candle[1] and valid_irc_high==0
    valid_irc_high:=1
else if igc_candle and valid_irc_high==1
    valid_irc_high:=0

if igc_candle and valid_igc_low==0
    valid_igc_low:=1
else if irc_candle and valid_igc_low==1
    valid_igc_low:=0


igc_low=ta.valuewhen(igc_candle,low,0)
irc_high=ta.valuewhen(irc_candle,high,0)
//////////////////////////////
//plot(irc_high,"irc_high",color.red)

//plot(valid_irc_high,"valid_irc_high",color.purple)

buy12=ta.crossunder(close,igc_low) and valid_igc_low==1
buy1=buy12[1]

short12=ta.crossover(close,irc_high) and valid_irc_high==1
short1=short12[1]
//plotshape(short12,"short12",shape.arrowdown,color=color.purple)

// plotshape(igc_candle,"igc_candle",shape.arrowdown,color=color.green)
// plotshape(irc_candle,"irc_candle",shape.arrowdown,color=color.red)
//plotshape((psar<close and psar[1]>close[1]) ,"croup",shape.arrowdown,color=color.red)
//plotshape(cup ,"croup",shape.arrowdown,color=color.orange)

buyprice=ta.valuewhen(buy1 and strategy.position_size[1]==0,open,0)
shortprice=ta.valuewhen(short1 and strategy.position_size[1]==0,open,0)

btarget1=buyprice+(buyprice*0.08)
btarget2=buyprice+(buyprice*0.16)
btarget3=buyprice+(buyprice*0.32)
bstoploss=buyprice-(buyprice*0.16)

starget1=shortprice-(shortprice*0.08)
starget2=shortprice-(shortprice*0.16)
starget3=shortprice-(shortprice*0.32)
sstoploss=shortprice+(shortprice*0.16)

if buy12 and strategy.position_size==0 and st11
    strategy.entry("buy",strategy.long)

if strategy.position_size >0
    strategy.exit("sell",from_entry = "buy",stop=bstoploss,limit=btarget3)

if short12 and strategy.position_size==0 and st11
    strategy.entry("short",strategy.short)

if strategy.position_size<0
    strategy.exit("cover",from_entry = "short",stop = sstoploss,limit = starget3)

if et
    strategy.close_all(comment = "timeover")

plot(strategy.position_size>0?buyprice:na,"buyprice",color.white, style=plot.style_circles )
plot(strategy.position_size>0?bstoploss:na,"bstoploss",color.red, style=plot.style_circles )
plot(strategy.position_size>0?btarget1:na,"btarget1",color.green, style=plot.style_circles )
plot(strategy.position_size>0?btarget2:na,"btarget2",color.green, style=plot.style_circles )
plot(strategy.position_size>0?btarget3:na,"btarget3",color.green, style=plot.style_circles )

plot(strategy.position_size<0?shortprice:na,"shortprice",color.white, style=plot.style_circles )
plot(strategy.position_size<0?sstoploss:na,"sstoploss",color.red, style=plot.style_circles )
plot(strategy.position_size<0?starget1:na,"starget1",color.green, style=plot.style_circles )
plot(strategy.position_size<0?starget2:na,"starget2",color.green, style=plot.style_circles )
plot(strategy.position_size<0?starget3:na,"starget3",color.green, style=plot.style_circles )