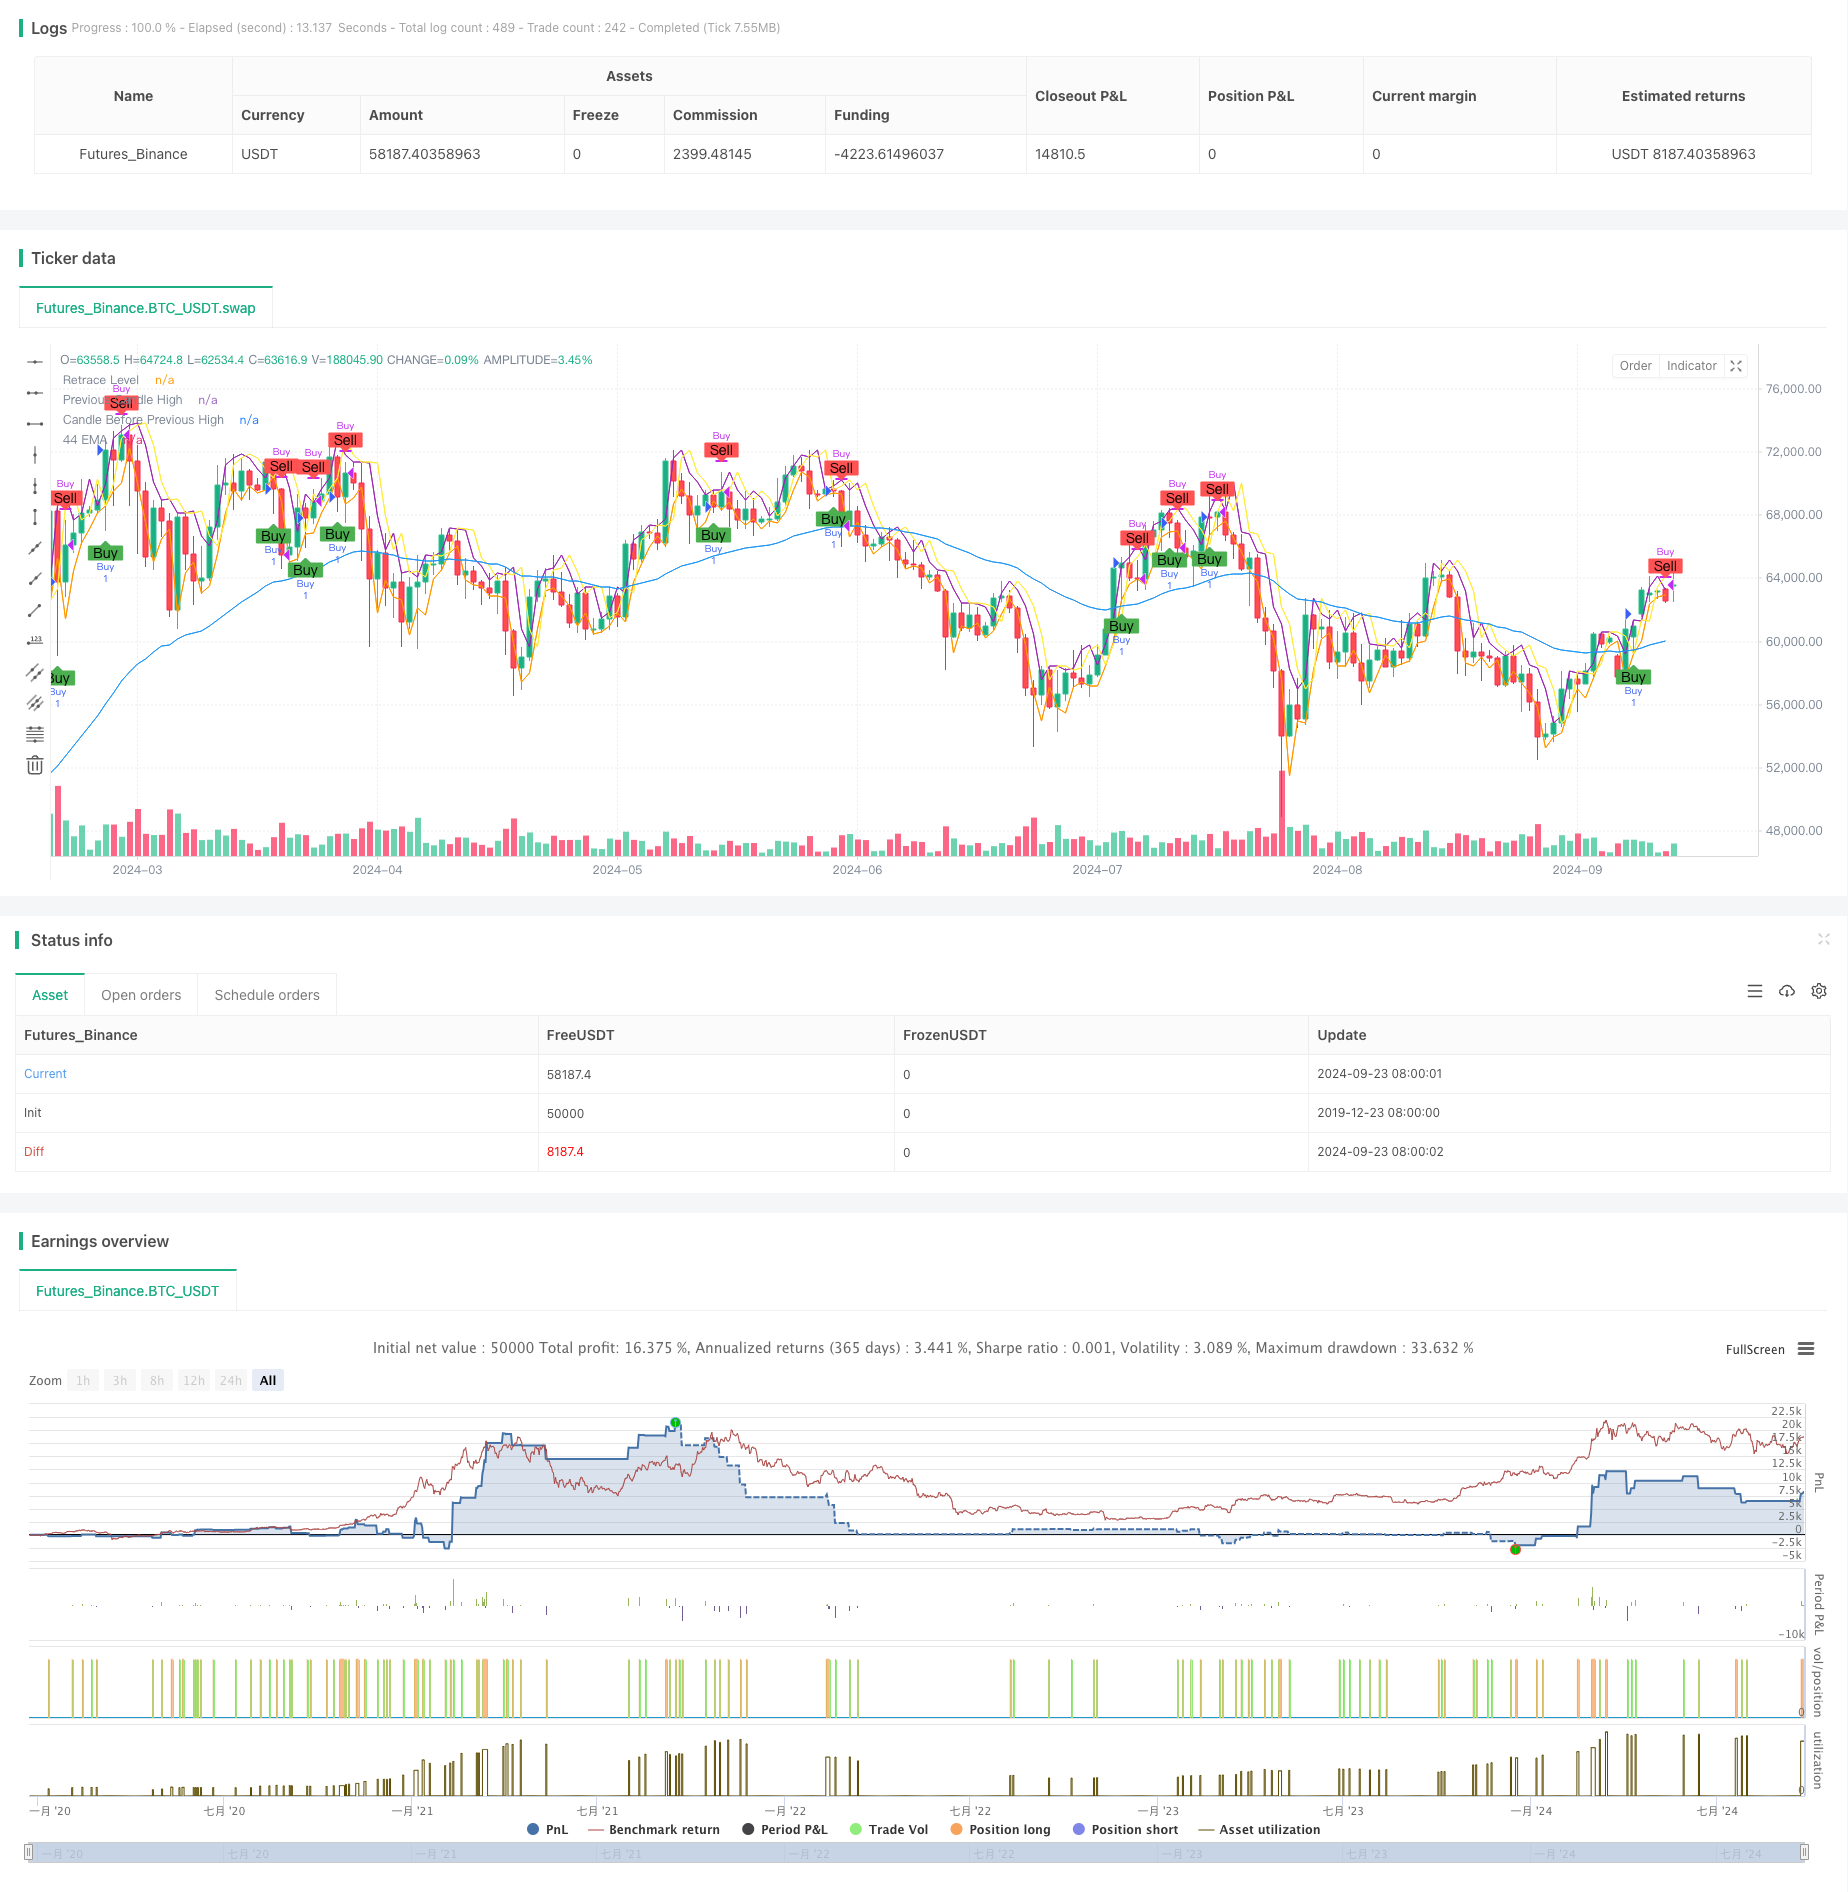
ওভারভিউ
এটি একটি ট্রেন্ড ট্র্যাকিং কৌশল যা 44-চক্রের সূচকীয় চলমান গড় (ইএমএ) এর উপর ভিত্তি করে। এই কৌশলটি মূলত একটি উত্থান প্রবণতার মধ্যে কেনার সুযোগের সন্ধান করে, ইএমএ স্লাইডিং, গ্রাফের আকৃতি এবং মূল্য প্রত্যাহারের মতো একাধিক শর্ত বিশ্লেষণ করে প্রবেশের সময় নির্ধারণ করে। কৌশলটি 2 মিনিট এবং 5 মিনিটের মতো স্বল্প সময়ের সময়কালের জন্য ডিজাইন করা হয়েছে, যা স্বল্পমেয়াদী মূল্যের ওঠানামায় লেনদেনের সুযোগগুলি ধরার জন্য।
কৌশল নীতি
- ৪৪ চক্রের ইএমএ এবং তার প্রান্তিকতা গণনা করুন এবং ট্রেন্ডটি যথেষ্ট পরিমাণে ঝুঁকছে কিনা তা নির্ধারণ করুন।
- পূর্ববর্তী টিউবটি বিশ্লেষণ করুন এবং এটিকে ইএমএ-এর চেয়ে বেশি মূল্য দিয়ে বন্ধ করুন।
- দেখুন বর্তমান কণিকাটি পূর্ববর্তী কণিকার ৫০% অবস্থানে ফিরে এসেছে কিনা।
- নিশ্চিত করুন যে পূর্ববর্তী লেনদেনের সমাপ্তি মূল্য পূর্ববর্তী লেনদেনের সর্বোচ্চ মূল্যের চেয়ে বেশি, যা নিশ্চিত করে যে লেনদেনের প্রবণতা অব্যাহত থাকবে।
- যখন সমস্ত শর্ত পূরণ হয়, তখন বর্তমান ক্যাশের প্রত্যাহারের অবস্থানে পজিশন খুলুন এবং আরও কিছু করুন।
- প্রস্থানের শর্ত হলঃ পূর্ববর্তী শূন্য বা বর্তমান শূন্যের পূর্ববর্তী শূন্যকে অতিক্রম করা।
কৌশলগত সুবিধা
- একাধিক ফিল্টারিংঃ ইএমএ, চার্ট ফর্ম্যাট এবং মূল্য প্রত্যাহারের মতো একাধিক সূচকের সমন্বয়ে কার্যকরভাবে মিথ্যা সংকেত হ্রাস করা।
- প্রবণতা অনুসরণ করুনঃ ইএমএ প্রান্তিকতা বিচার করে নিশ্চিত করুন যে ট্রেডিং একটি স্পষ্ট উত্থান প্রবণতা মধ্যে, জয় হার বৃদ্ধি।
- পুনঃব্যবহারঃ মূল্য পুনঃব্যবহারকে প্রবেশের পয়েন্ট হিসাবে ব্যবহার করে, ক্রয় মূল্যের অপ্টিমাইজেশান করে এবং সম্ভাব্যভাবে মুনাফা বাড়ানোর সুযোগ দেয়।
- নমনীয়তাঃ বিভিন্ন সময়কালের জন্য প্রযোজ্য, যা শর্ট লাইন এবং ইন-ডে ট্রেডারদের জন্য উপযুক্ত।
- ঝুঁকি নিয়ন্ত্রণঃ প্রতিটি লেনদেনের ঝুঁকি নিয়ন্ত্রণে সহায়তা করার জন্য একটি স্পষ্ট স্টপ লস শর্ত রয়েছে।
কৌশলগত ঝুঁকি
- পিছিয়ে পড়াঃ পিছিয়ে পড়া ইএমএ হিসাবে, এটি তীব্র ওঠানামা পরিস্থিতিতে প্রতিক্রিয়াশীল হতে পারে।
- ভুয়া ব্রেকিংঃ প্রায়শই ভুয়া ব্রেকিং সিগন্যাল হতে পারে।
- অত্যধিক লেনদেনঃ বাজারের উচ্চ অস্থিরতার ফলে লেনদেনের খরচ বাড়তে পারে।
- প্রবণতা বিপরীতঃ দ্রুত প্রবণতা বিপরীত একটি বড় ক্ষতি হতে পারে।
- প্যারামিটার সংবেদনশীলতাঃ EMA চক্রের মতো প্যারামিটার সেটিংসের জন্য কৌশল প্রভাবগুলি সংবেদনশীল।
কৌশল অপ্টিমাইজেশনের দিকনির্দেশনা
- অতিরিক্ত ফিল্টার যুক্ত করুনঃ যেমন RSI বা MACD, যা প্রবণতার শক্তি এবং দিকনির্দেশকে আরও নিশ্চিত করে।
- ডায়নামিক স্টপঃ এটিআর সূচক ব্যবহার করে ডায়নামিক স্টপ সেট করুন, বাজার ওঠানামার সাথে আরও ভালভাবে খাপ খাইয়ে নিন।
- ট্র্যাফিক বিশ্লেষণ বাড়ানোঃ ট্র্যাফিক সূচকগুলিকে একত্রিত করে প্রবেশের সংকেতের নির্ভরযোগ্যতা বাড়ানো।
- ইএমএ চক্র অপ্টিমাইজ করুনঃ বিভিন্ন ইএমএ চক্রের পুনরাবৃত্তি করে সর্বোত্তম প্যারামিটার সমন্বয় খুঁজে বের করুন।
- প্রবণতা শক্তির সূচক যোগ করুনঃ যেমন ADX, শুধুমাত্র শক্তিশালী প্রবণতার মধ্যে প্রবেশ নিশ্চিত করুন।
- খেলার পরিকল্পনার উন্নতি: ট্রেলিং স্টপের মতো আরো সুনির্দিষ্ট উপার্জন কৌশল তৈরি করা।
সারসংক্ষেপ
গস ক্রস ইএমএ ট্রেন্ড স্লাইড পয়েন্ট ট্র্যাকিং কৌশলটি একটি প্রবণতা ট্র্যাকিং সিস্টেম যা একাধিক প্রযুক্তিগত সূচককে একত্রিত করে। ইএমএ, গ্রাফিকাল পটভূমি বিশ্লেষণ এবং মূল্য প্রত্যাহারের মতো বহু-মাত্রিক বিচারের মাধ্যমে এই কৌশলটি উত্থানের প্রবণতা সনাক্তকরণ এবং প্রবেশের সময়কে অনুকূলিত করার জন্য ভাল সম্ভাবনা দেখায়। তবে ব্যবহারকারীদের অতিরিক্ত ট্রেডিংয়ের ঝুঁকি নিয়ন্ত্রণে মনোযোগ দেওয়া এবং বিভিন্ন বাজার পরিবেশের জন্য প্যারামিটার অপ্টিমাইজ করার প্রয়োজন। অতিরিক্ত প্রযুক্তিগত সূচক প্রবর্তন এবং ঝুঁকি পরিচালনার প্রক্রিয়া উন্নত করে এই কৌশলটি স্বল্পমেয়াদী ব্যবসায়ের ক্ষেত্রে আরও স্থিতিশীল হওয়ার সম্ভাবনা রয়েছে।
/*backtest
start: 2019-12-23 08:00:00
end: 2024-09-24 08:00:00
period: 1d
basePeriod: 1d
exchanges: [{"eid":"Futures_Binance","currency":"BTC_USDT"}]
*/

//@version=5
strategy("Custom Strategy with EMA and Candle Conditions", overlay=true)

// Define parameters
ema_length = 44

// Calculate EMA
ema_44 = ta.ema(close, ema_length)

// Calculate the slope of the EMA
ema_slope = ta.ema(close, ema_length) - ta.ema(close[9], ema_length)

// Define a threshold for considering the EMA flat
flat_threshold = 0.5

// Check if the EMA is flat or inclined
ema_is_inclined = math.abs(ema_slope) > flat_threshold

// Define the previous candle details
prev_candle_high = high[1]
prev_candle_low = low[1]
prev_candle_close = close[1]
prev_candle_open = open[1]

// Candle before the previous candle (for high comparison)
candle_before_prev_high = high[2]

// Current candle details
current_candle_high = high
current_candle_low = low
current_candle_close = close
current_candle_open = open

// Previous to previous candle details
prev_prev_candle_low = low[2]

// Previous candle body and wick length
prev_candle_body = math.abs(prev_candle_close - prev_candle_open)
prev_candle_wick_length = math.max(prev_candle_high - prev_candle_close, prev_candle_close - prev_candle_low)

// Calculate retrace level for the current candle
retrace_level = prev_candle_close - (prev_candle_close - prev_candle_low) * 0.5

// Check if the previous candle's wick is smaller than its body
prev_candle_condition = prev_candle_wick_length < prev_candle_body

// Check if the previous candle is a green (bullish) candle and if the previous candle's close is above EMA
prev_candle_green = prev_candle_close > prev_candle_open
prev_candle_red = prev_candle_close < prev_candle_open
prev_candle_above_ema = prev_candle_close > ema_44

// Entry condition: The current candle has retraced to 50% of the previous candle's range, previous candle was green and above EMA, and the high of the current candle is above the retrace level, and EMA is inclined
entry_condition = prev_candle_close > candle_before_prev_high and
                   prev_candle_green and
                   prev_candle_above_ema and
                   current_candle_low <= retrace_level and
                   current_candle_high >= retrace_level and ema_is_inclined

// Exit condition
exit_condition = (strategy.position_size > 0 and prev_candle_red) or (strategy.position_size > 0 and current_candle_low < prev_candle_low)

// Ensure only one trade is open at a time
single_trade_condition = strategy.position_size == 0

// Plot EMA for visualization
plot(ema_44, color=color.blue, title="44 EMA")

// Plot conditions for debugging
plotshape(series=entry_condition and single_trade_condition, location=location.belowbar, color=color.green, style=shape.labelup, text="Buy")
plotshape(series=exit_condition, location=location.abovebar, color=color.red, style=shape.labeldown, text="Sell")

// Print entry condition value on chart
var label entry_label = na
if (entry_condition and single_trade_condition)
    entry_label := label.new(bar_index, low, text="Entry Condition: TRUE", color=color.green, textcolor=color.white, size=size.small, yloc=yloc.belowbar)
else
    entry_label := label.new(bar_index, high, text="Entry Condition: FALSE", color=color.red, textcolor=color.white, size=size.small, yloc=yloc.abovebar)

// Debugging: Plot retrace level and other key values
plot(retrace_level, color=color.orange, title="Retrace Level")
plot(prev_candle_high, color=color.purple, title="Previous Candle High")
plot(candle_before_prev_high, color=color.yellow, title="Candle Before Previous High")

// Trigger buy order if entry condition and single trade condition are met
if (entry_condition and single_trade_condition)
    strategy.entry("Buy", strategy.long)

// Trigger sell order if exit condition is met
if (exit_condition)
    strategy.close("Buy")