Kryptowährungsquantitativer Handel für Anfänger - Sie näher an Kryptowährungsquantitativer (7)
Schriftsteller:FMZ~Lydia, Erstellt: 2022-08-09 11:15:23, aktualisiert: 2023-09-21 21:00:10
In dem vorherigen Artikel haben wir gemeinsam eine einfache Multi-Species-Grid-Strategie gedacht und entworfen. Als nächstes werden wir weiter lernen und auf dem Weg des quantitativen Handels vorankommen. In diesem Artikel werden wir ein komplexeres Strategie-Design - das Design von Hedging-Strategien - untersuchen. In diesem Artikel wird eine Multi-Species-Intertemporal-Hedging-Strategie entworfen. Wenn es um Intertemporal-Hedging-Strategien geht, müssen diejenigen, die mit Futures-Handel vertraut sind, damit vertraut sein. Für Anfänger verstehen sie diese Konzepte möglicherweise nicht, also fangen wir mit einer kurzen Erklärung des Konzepts der Intertemporal-Hedging an.
Intertemporäre Absicherung
Einfach ausgedrückt, ist intertemporaler Absicherung, einen Vertrag lang zu gehen, einen Vertrag kurz zu gehen und auf drei Situationen (lang und kurz) zu warten, um die Position gleichzeitig zu schließen:
- Wenn Sie Geld verdienen, indem Sie lang gehen und Geld verlieren, indem Sie kurz gehen, und Ihre Position schließen, wenn der Gewinn (wie das Sprichwort sagt) größer ist als der Verlust (wie das Sprichwort sagt), werden Sie nach der Gewinn-Verlust-Bilanz einen Gewinn machen.
- Long-Positionen verlieren Geld, Short-Positionen verdienen Geld und schließen die Position, wenn die eine profitabler ist als diejenige, die verliert.
- Geld verdienen, wenn Sie lang gehen, und Geld verdienen, wenn Sie kurz gehen, also warum zögern Sie?
In anderen Fällen sind schwebende Verluste, die in der Position skalieren oder weiter skalieren. (Weil die Spreadfluktuation moderater ist als die einseitige Fluktuation, ist das relative Risiko geringer, beachten Sie, dass nur relativ!)
Let A1 be the price of contract A at moment 1, and set B1 to be the price of contract B at moment 1. At this time, short contract A, short price A1, long contract B, and long price B1.
Let A2 be the price of contract A at moment 2, and set B2 to be the price of contract B at moment 2. At this time, close the position contract A (short), close short A2, close the position B contract (long), and close long price B2.

Moment 1 difference:A1 - B1 = X
Moment 2 difference:A2 - B2 = Y
X - Y = A1 - B1 - (A2 - B2)
X - Y = A1 - B1 - A2 + B2
X - Y = A1 - A2 + B2 - B1

It can be seen that A1 - A2 is the profit difference in closing the position of contract A.
B2 - B1 is the profit spread of closing the position of contract B. As long as the two closed positions are overall positive, ie: A1 - A2 + B2 - B1 > 0 is profitable. That is, as long as X - Y > 0.
Because of: X - Y = A1 - A2 + B2 - B1

It is concluded that as long as the difference X of opening a position is greater than the difference Y of closing a position, it is profitable (note that it is short A, long B to open a position, the reverse will be the opposite), of course, this is theoretical, practical factors such as commission and slippage should also be considered.
Da Kryptowährungsbörsen sowohl Lieferverträge als auch Dauerverträge haben. Und der Preis von Dauerverträgen ist aufgrund der Finanzierungssatz immer nahe am Spotpreis. Dann wählen wir Lieferverträge und Dauerverträge zur Absicherung von Arbitrage. Der Liefervertrag wählt einen längerfristigen Vertrag, so dass der Absicherungsvertrag nicht häufig festgelegt werden muss.
Erwarmen Sie sich mit einer Multi-Spezies Verbreitung Statistik zuerst
Wenn Sie einmal mit den Grundprinzipien vertraut sind, müssen Sie sich nicht beeilen, Strategien zu schreiben. Zunächst können Sie eine Spread-Statistik erhalten, ein Diagramm zeichnen und die Spreads beobachten.
Wir entwerfen auf der Grundlage derOKEX-Vertrag. Es ist sehr einfach, auf FMZ zu zeichnen. Es ist sehr einfach, die verpackten Funktionen zu zeichnen.HochkartenDie Zeichnungsfunktion beschreibt sich in der API-Dokumentation:https://www.fmz.com/api#chart...
Da es sich um eine Vielzahl von Arten handelt, ist es zunächst notwendig, die Preisunterschiede dieser Arten vor dem Zeichnen zu bestimmen.
var arrSwapContractType = ["BTC-USDT-SWAP", "LTC-USDT-SWAP", "ETH-USDT-SWAP", "ETC-USDT-SWAP"]   // Perpetual contracts
var arrDeliveryContractType = ["BTC-USDT-210924", "LTC-USDT-210924", "ETH-USDT-210924", "ETC-USDT-210924"]  // Delivery contracts
Diese Diagrammkonfiguration kann sicherlich nicht hard-codiert werden, da Sie nicht wissen, welche Arten und wie viele Arten zu tun sind (diese werden durch die Werte arrDeliveryContractType und arrSwapContractType bestimmt), so dass die Diagrammkonfiguration von einer Funktion zurückgegeben wird.
function createCfg(symbol) {
    var cfg = {
        extension: {
            // No grouping, displayed separately, default is 'group'
            layout: 'single',
            // Specify the height, which can be set as a string, "300px", and the value 300 will be replaced with "300px" automatically
            height: 300,
            // The unit value of the specified width, the total value is 12
            col: 6
        },
        title: {
            text: symbol
        },
        xAxis: {
            type: 'datetime'
        },
        series: [{
            name: 'plus',
            data: []
        }]
    }

    return cfg
}

function main() {
    // Declare arrCfg
    var arrCfg = []                                    // Declare an array to store chart configuration information
    _.each(arrSwapContractType, function(ct) {         // Record the array of perpetual contract codes iteratively, pass the XXX-USDT part of the contract name as a parameter to the createCfg function, construct the chart configuration information, and return
        arrCfg.push(createCfg(formatSymbol(ct)[0]))    // The chart configuration information returned by createCfg is pushed into the arrCfg array
    })
    var objCharts = Chart(arrCfg)                      // Call the chart function Chart of the FMZ platform to create the chart control object objCharts
    objCharts.reset()                                  // Initialize chart content

    // Hereafter omitted ...
}
Als nächstes bereiten wir die Daten vor.
USDT-Perpetualverträge:
https://www.okex.com/api/v5/market/tickers?instType=SWAP
USDT-Lieferverträge:
https://www.okex.com/api/v5/market/tickers?instType=FUTURES
Wir schreiben eine Funktion, um die Anrufe dieser beiden Schnittstellen zu verarbeiten und setzen die Daten in ein Format:
function getTickers(url) {
    var ret = []
    try {
        var arr = JSON.parse(HttpQuery(url)).data
        _.each(arr, function(ele) {
            ret.push({
                bid1: parseFloat(ele.bidPx),             // Price of stock buy order
                bid1Vol: parseFloat(ele.bidSz),          // Amount for the price of stock buy order
                ask1: parseFloat(ele.askPx),             // Price of stock sell order
                ask1Vol: parseFloat(ele.askSz),          // Amount for the price of stock sell order
                symbol: formatSymbol(ele.instId)[0],     // Formats into trading pairs
                type: "Futures",                         // Type
                originalSymbol: ele.instId               // Original contract code
            })
        })
    } catch (e) {
        return null
    }
    return ret
}
Schreiben Sie eine andere Funktion zur Verarbeitung des Vertragscodes
function formatSymbol(originalSymbol) {
    var arr = originalSymbol.split("-")
    return [arr[0] + "_" + arr[1], arr[0], arr[1]]
}
Alles, was übrig bleibt, ist, die erfassten Daten iterativ zu paaren, die Spreads zu berechnen, die Ausgabe zu zeichnen usw. Der Test hier ist der Spread zwischen dem Vertrag 210924 für das zweite Quartal und dem Vertrag für die Dauer. Vollständiger Code:
// Temporary parameters
var arrSwapContractType = ["BTC-USDT-SWAP", "LTC-USDT-SWAP", "ETH-USDT-SWAP", "ETC-USDT-SWAP"]
var arrDeliveryContractType = ["BTC-USDT-210924", "LTC-USDT-210924", "ETH-USDT-210924", "ETC-USDT-210924"]
var interval = 2000

function createCfg(symbol) {
    var cfg = {
        extension: {
            // No grouping, displayed separately, default is 'group'
            layout: 'single',
            // Specify the height, which can be set as a string, "300px", and the value 300 will be replaced with "300px" automatically
            height: 300,
            // The unit value of the specified width, the total value is 12
            col: 6
        },
        title: {
            text: symbol
        },
        xAxis: {
            type: 'datetime'
        },
        series: [{
            name: 'plus',
            data: []
        }]
    }

    return cfg
}

function formatSymbol(originalSymbol) {
    var arr = originalSymbol.split("-")
    return [arr[0] + "_" + arr[1], arr[0], arr[1]]
}

function getTickers(url) {
    var ret = []
    try {
        var arr = JSON.parse(HttpQuery(url)).data
        _.each(arr, function(ele) {
            ret.push({
                bid1: parseFloat(ele.bidPx),
                bid1Vol: parseFloat(ele.bidSz),
                ask1: parseFloat(ele.askPx),
                ask1Vol: parseFloat(ele.askSz),
                symbol: formatSymbol(ele.instId)[0],
                type: "Futures",
                originalSymbol: ele.instId
            })
        })
    } catch (e) {
        return null
    }
    return ret
}

function main() {
    // Declare arrCfg
    var arrCfg = []
    _.each(arrSwapContractType, function(ct) {
        arrCfg.push(createCfg(formatSymbol(ct)[0]))
    })
    var objCharts = Chart(arrCfg)
    objCharts.reset()

    while (true) {
        // Obtain market data
        var deliveryTickers = getTickers("https://www.okex.com/api/v5/market/tickers?instType=FUTURES")
        var swapTickers = getTickers("https://www.okex.com/api/v5/market/tickers?instType=SWAP")
        if (!deliveryTickers || !swapTickers) {
            Sleep(2000)
            continue
        }

        var tbl = {
            type : "table",
            title : "delivery - perpetual spread",
            cols : ["trading pairs", "delivery", "perpetual", "positive hedging", "negative hedging"],
            rows : []
        }

        var subscribeDeliveryTickers = []
        var subscribeSwapTickers = []
        _.each(deliveryTickers, function(deliveryTicker) {
            _.each(arrDeliveryContractType, function(symbol) {
                if (deliveryTicker.originalSymbol == symbol) {
                    subscribeDeliveryTickers.push(deliveryTicker)
                }
            })
        })
        _.each(swapTickers, function(swapTicker) {
            _.each(arrSwapContractType, function(symbol) {
                if (swapTicker.originalSymbol == symbol) {
                    subscribeSwapTickers.push(swapTicker)
                }
            })
        })

        var pairs = []
        var ts = new Date().getTime()
        _.each(subscribeDeliveryTickers, function(deliveryTicker) {
            _.each(subscribeSwapTickers, function(swapTicker) {
                if (deliveryTicker.symbol == swapTicker.symbol) {
                    var pair = {symbol: swapTicker.symbol, swapTicker: swapTicker, deliveryTicker: deliveryTicker, plusDiff: deliveryTicker.bid1 - swapTicker.ask1, minusDiff: deliveryTicker.ask1 - swapTicker.bid1}
                    pairs.push(pair)
                    tbl.rows.push([pair.symbol, deliveryTicker.originalSymbol, swapTicker.originalSymbol, pair.plusDiff, pair.minusDiff])
                    for (var i = 0 ; i < arrCfg.length ; i++) {
                        if (arrCfg[i].title.text == pair.symbol) {
                            objCharts.add([i, [ts, pair.plusDiff]])
                        }
                    }
                }
            })
        })

        LogStatus(_D(), "\n`" + JSON.stringify(tbl) + "`")
        Sleep(interval)
    }
}
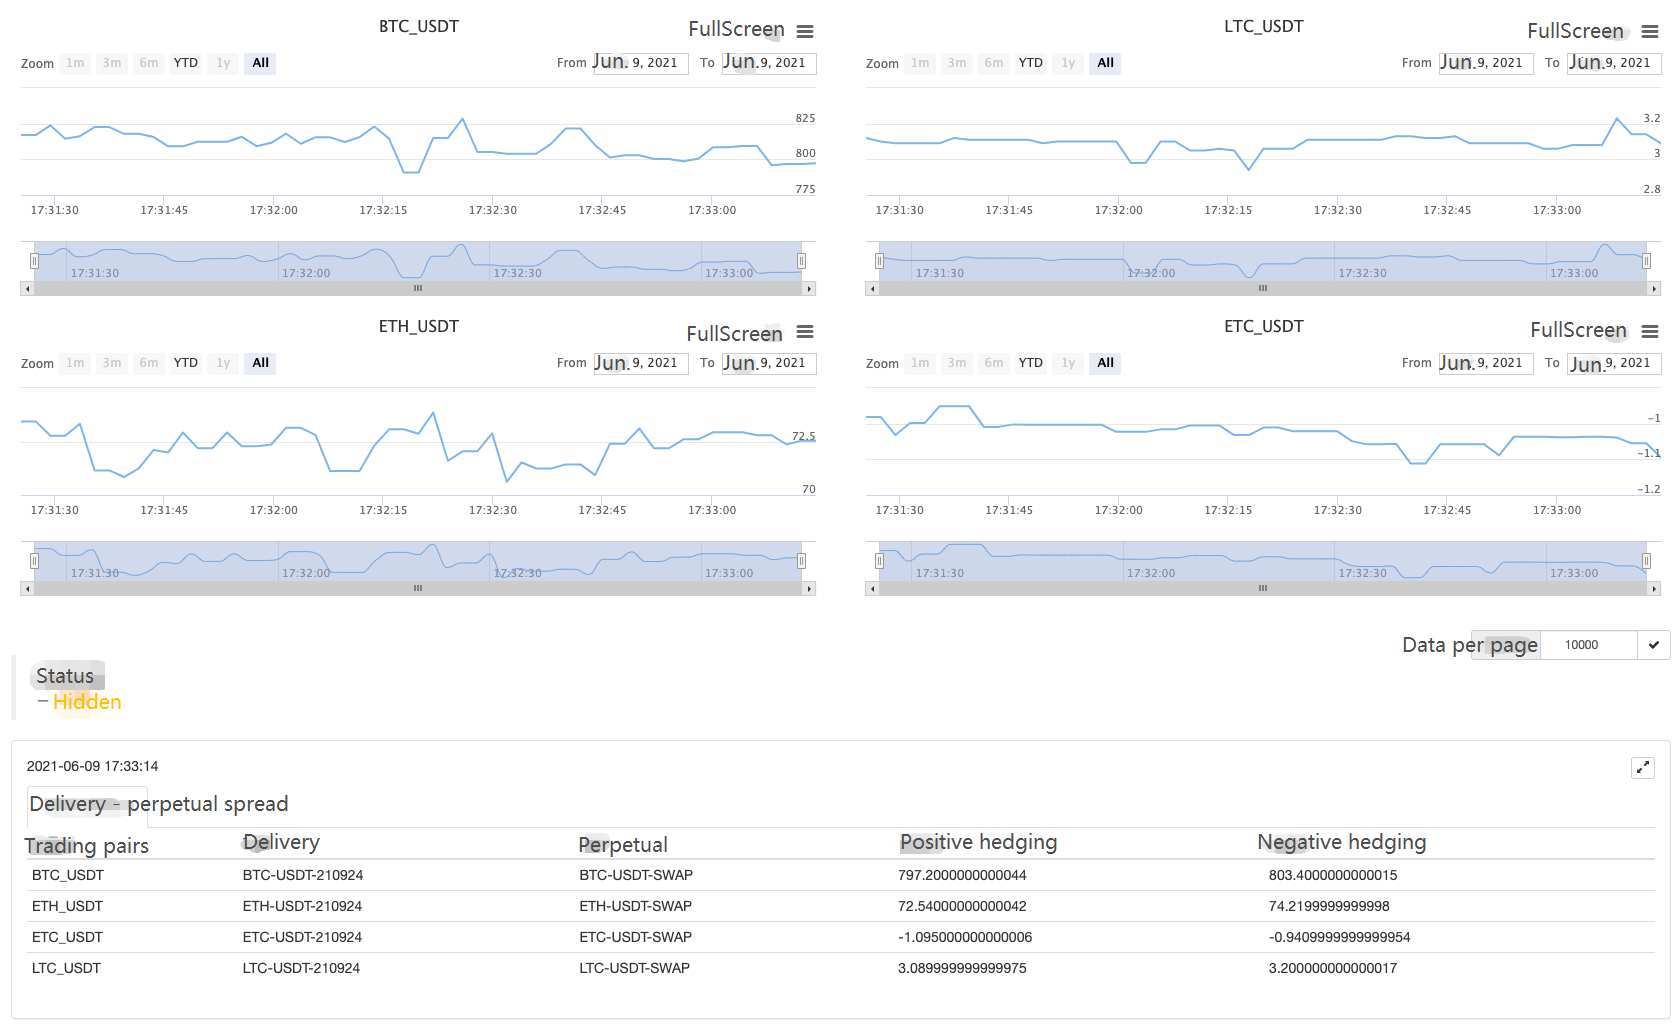
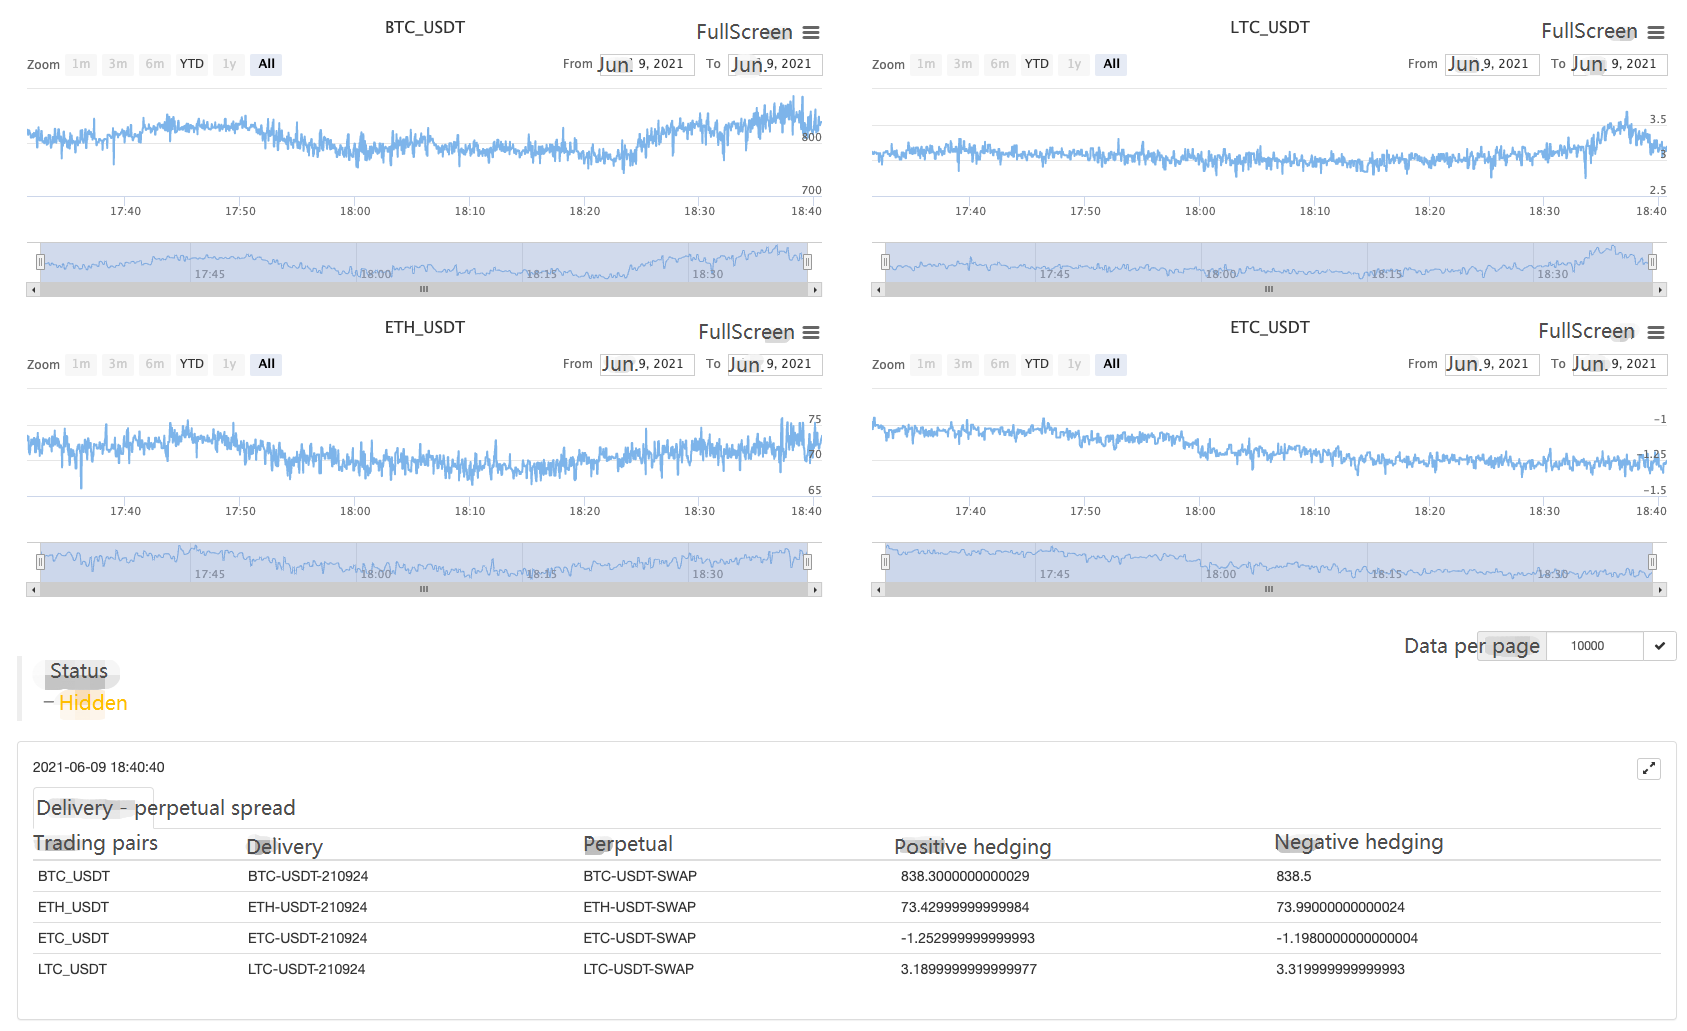
Ein echter Bot läuft.

Ich laufe eine Weile.

Beobachten Sie die Ausbreitung und sprechen Sie dann darüber!
- DEX-Börsen Quantitative Praxis ((1)-- dYdX v4 Benutzerhandbuch
- Einführung der Lead-Lag-Suite in der Kryptowährung (3)
- Einführung in Lead-Lag-Arbitrage in Kryptowährungen (2)
- Einführung der Lead-Lag-Suite in der digitalen Währung (2)
- Diskussion über den externen Signalempfang der FMZ-Plattform: Eine Komplettlösung für den Empfang von Signalen mit integriertem Http-Service in der Strategie
- FMZ-Plattform: Erforschung von Signalempfangsstrategien für externe Netzwerke
- Einführung in Lead-Lag-Arbitrage in Kryptowährungen (1)
- Einführung der Lead-Lag-Suite in der Kryptowährung (1)
- Diskussion über den externen Signalempfang der FMZ-Plattform: Erweiterte API VS Strategie eingebauter HTTP-Service
- FMZ-Plattform-External Signal Reception: Erweiterung der API vs. Strategien für den eingebauten HTTP-Dienst
- Diskussion über die Strategie-Testmethode auf Basis eines Zufalls-Ticker-Generators
- Überprüfung des Marktes für digitale Währungen im Jahr 2021 und die einfachste 10-fache Strategie verpasst
- Modell für digitale Währungsfaktoren
- Das ist die magische doppelte EMA-Gleichlinienstrategie von YouTube-Gott.
- Schreiben Sie ein halbautomatisches Handelstool in der Sprache Pine
- Faktormodell für digitale Währungen
- Ich bin mein eigener Retter im Geschäft.
- Absicherungsstrategie von manuellen Futures und Spot-Kryptowährungen
- Konzeption einer Spot-Hedging-Strategie für Kryptowährungen (1)
- Eine Strategie für eine dauerhafte Ausgleichsbilanz, die für einen Tiefpunkt des Bärenmarktes geeignet ist
- Kryptowährungsquantitativer Handel für Anfänger - Sie näher an Kryptowährungsquantitativer (8)
- Kryptowährungsquantitativer Handel für Anfänger - Sie näher an Kryptowährungsquantitativen (6)
- Übersicht und Architektur der Hauptoberfläche der FMZ Quant Trading Platform
- Martingale-Strategieentwurf für Kryptowährungs-Futures
- Kryptowährungsquantitativer Handel für Anfänger - Sie näher an Kryptowährungsquantitativen (5)
- Kryptowährungsquantitativer Handel für Anfänger - Sie näher an Kryptowährungsquantitativer (4)
- Kryptowährungsquantitativer Handel für Anfänger - Sie näher an Kryptowährungsquantitativer Handel bringen (3)
- Kryptowährungsquantitativer Handel für Anfänger - Sie näher an Kryptowährungsquantitativer Handel bringen (2)
- Kryptowährungsquantitativer Handel für Anfänger - Sie näher an Kryptowährungsquantitativer (1)
- Konzeption einer Spot-Hedging-Strategie für Kryptowährungen (2)
- Ein Beispiel für einen allgemeinen Protokollzugangsvertrag auf FMZ