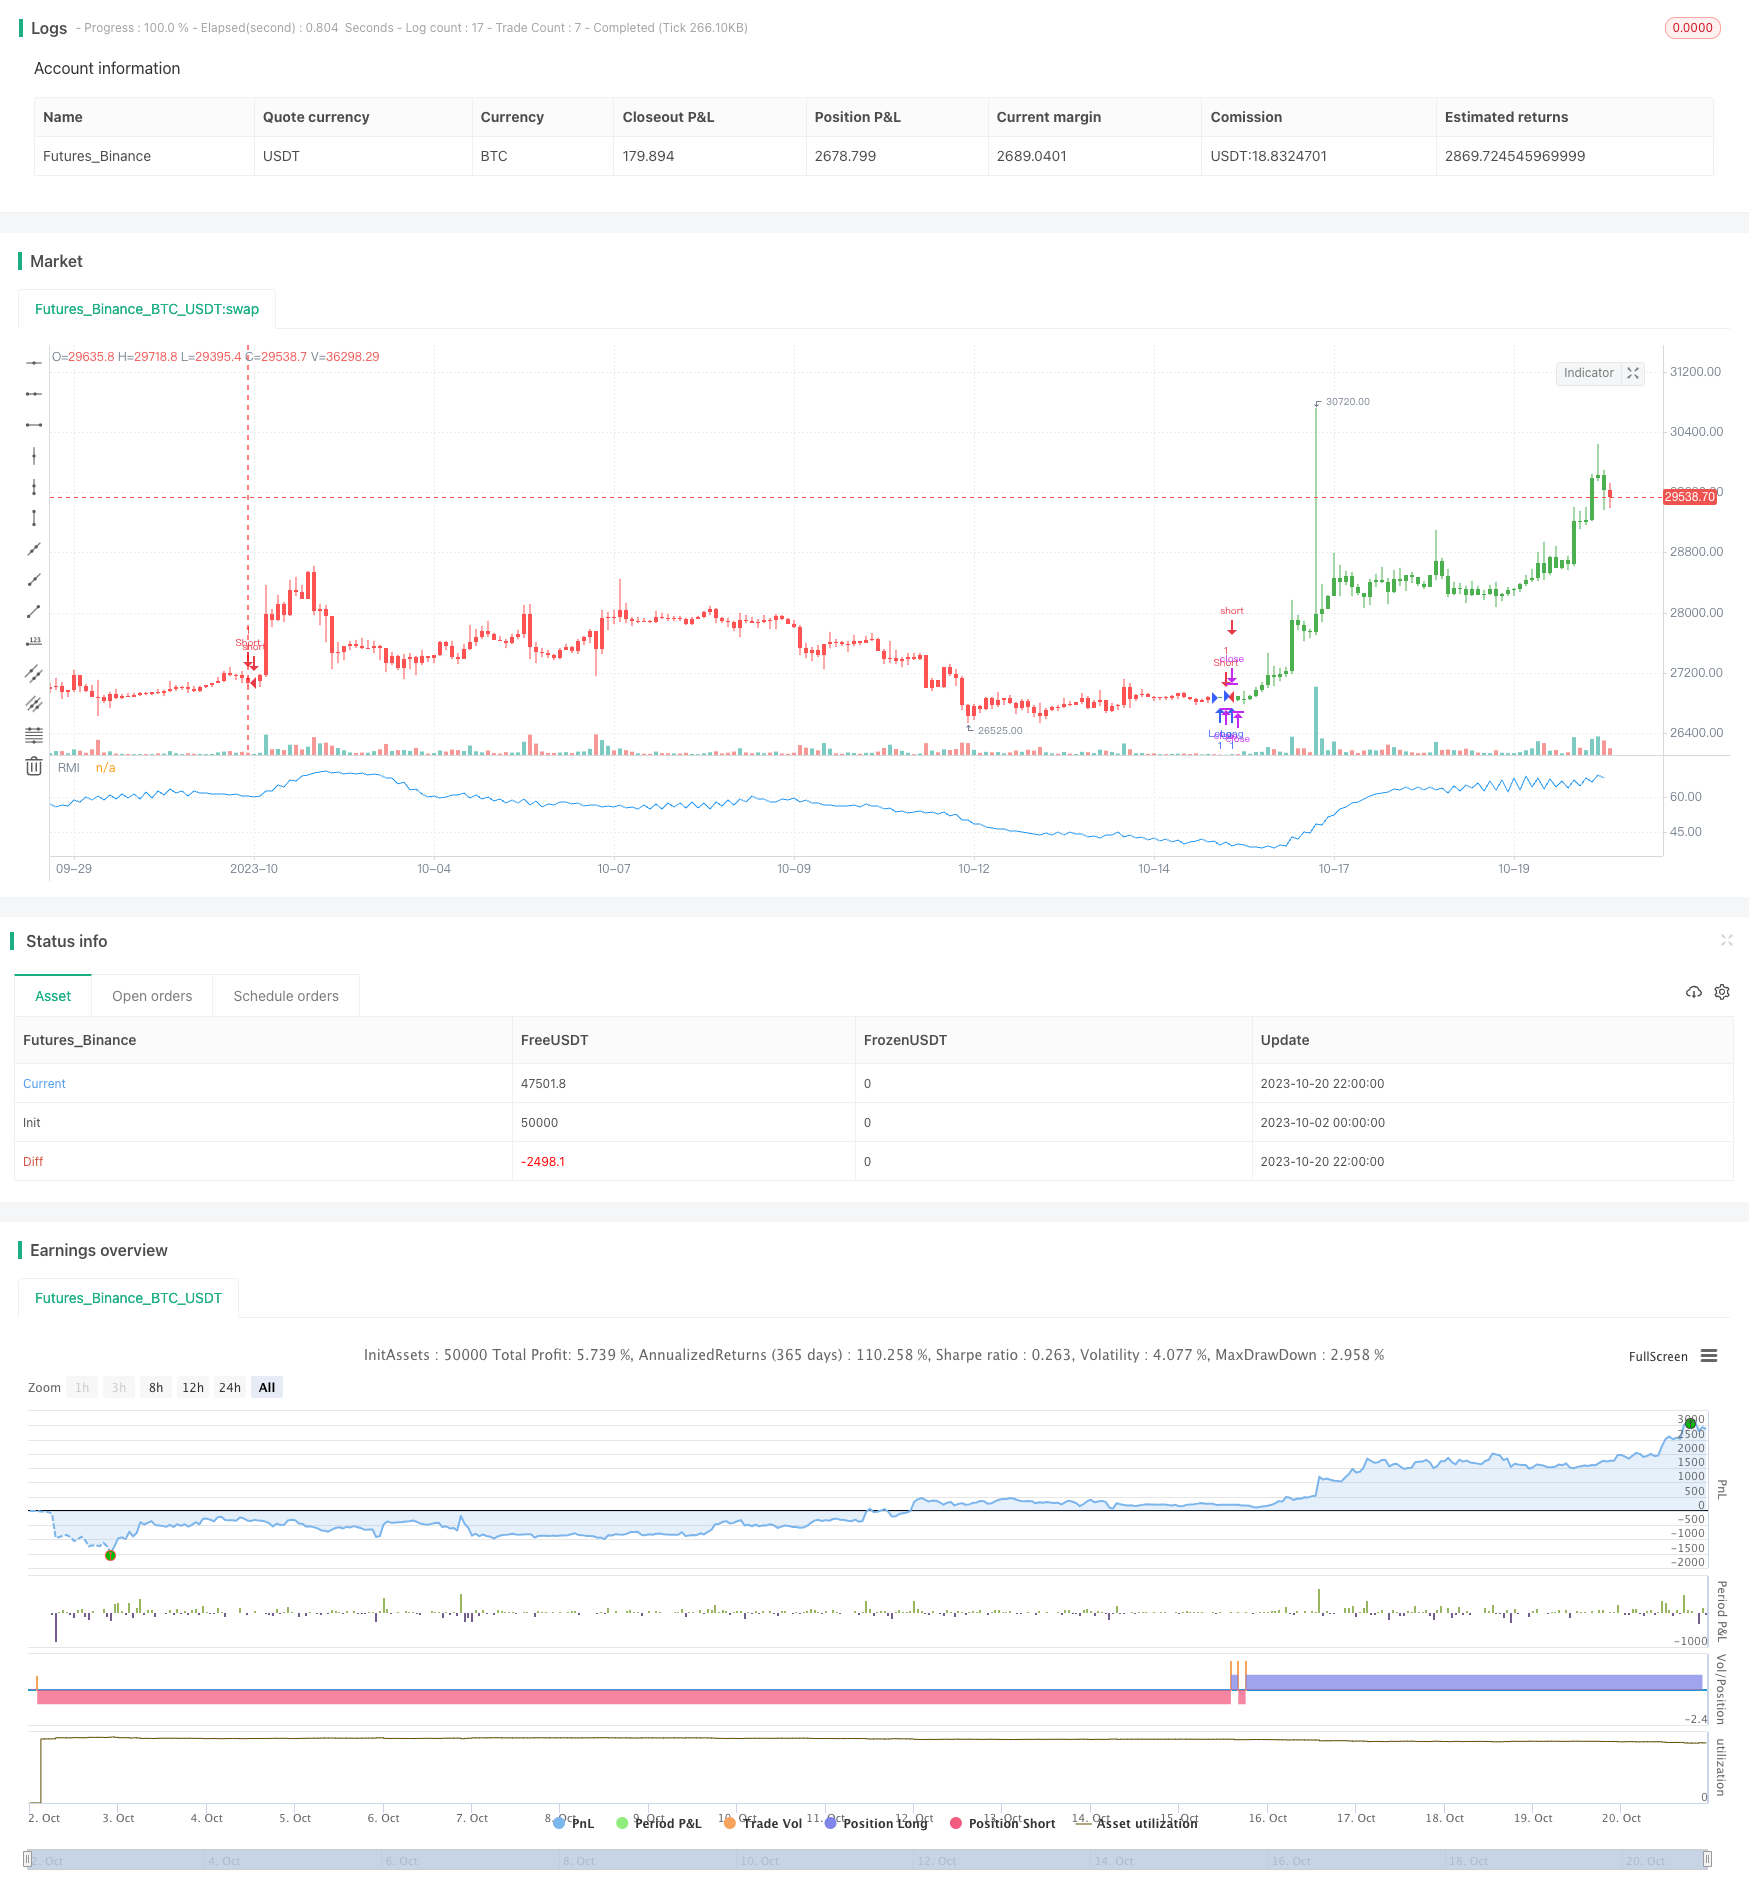
Strategie für den Relative Momentum Index
Schriftsteller:ChaoZhang, Datum: 2023-11-02 17:21:45Tags:

Übersicht
Die Strategie des Relative Momentum Index (RMI) ist eine verbesserte Version, die auf dem Momentum-Index basiert. Sie berechnet die Preisdynamik über einen Zeitraum, um festzustellen, ob der Markt überkauft oder überverkauft ist, um Umkehrchancen zu erfassen.
Strategie Logik
Die Formel für die Berechnung des RMI lautet wie folgt:
xMom = xPrice - xPrice[Length]  // Price change over Length periods
xMU = If xMom >= 0: previous xMU minus xMU/Length plus xMom; else: previous xMU
xMD = If xMom <= 0: previous xMD minus xMD/Length plus absolute value of xMom; else: 0
RM = xMU / xMD
RMI = 100 * (RM / (1 + RM))
Berechnen Sie zunächst die Preisänderung xMom über Längeperioden. Wenn xMom>=0, was bedeutet, dass der Preis steigt, akkumulieren Sie ihn in xMU; wenn xMom<0, was bedeutet, dass der Preis fällt, akkumulieren Sie seinen absoluten Wert in xMD. RM ist das Verhältnis zwischen xMU und xMD, das die Dynamik von Auf- und Abstiegen darstellt. RMI normalisiert RM in den Bereich 0-100.
Wenn der RMI höher als die Schwelle SellZone ist, ist der Markt überkauft, gehen Sie kurz.
Vorteile
- Im Vergleich zum RSI ist der RMI empfindlicher und kann Umkehrchancen früher erfassen.
- Der RMI misst die Dynamik der Auf- und Abwärtsbewegungen, die weniger von der Konsolidierung beeinflusst werden.
- Auf der Grundlage der Dynamik kann der RMI den Überkauf/Überverkauf besser bestimmen.
Risiken
- Wie bei anderen Umkehrstrategien besteht auch bei RMI die Gefahr, durch starke Trends gestoppt zu werden.
- Die RMI-Parameter müssen für verschiedene Produkte optimiert werden, sonst können die Ergebnisse schlecht sein.
- Überkauf-/Überverkaufsschwellen müssen vernünftig festgelegt werden, da sonst zu viele falsche Signale auftreten können.
Die Risiken können durch Erweiterung des Stop Loss, Optimierung der Parameter, Kombination mit Trendstrategien usw. verringert werden.
Verbesserungen
Die RMI-Strategie kann in folgenden Aspekten verbessert werden:
- Optimieren Sie den Parameter Länge, um die Rendite zu maximieren.
- Optimieren Sie die überkauften/überverkauften Schwellenwerte, um falsche Signale zu reduzieren.
- Hinzufügen von Stop-Loss zur Kontrolle von Einzelverlusten.
- Kombinieren Sie mit Trend- oder gleitenden Durchschnittsstrategien, um die Gewinnrate zu erhöhen.
- Auswahl geeigneter Handelssitzungen auf der Grundlage der Produktmerkmale zur Verbesserung der Stabilität.
Schlussfolgerung
Die RMI-Strategie erfasst kurzfristige Pullback-Möglichkeiten, indem sie die Preisdynamikänderung misst. Im Vergleich zum RSI ist die RMI empfindlicher und robuster auf Konsolidierung ausgerichtet.
/*backtest
start: 2023-10-02 00:00:00
end: 2023-10-21 00:00:00
period: 2h
basePeriod: 15m
exchanges: [{"eid":"Futures_Binance","currency":"BTC_USDT"}]
*/

//@version=2
////////////////////////////////////////////////////////////
//  Copyright by HPotter v1.0 19/10/2017
// The Relative Momentum Index (RMI) was developed by Roger Altman. Impressed
// with the Relative Strength Index's sensitivity to the number of look-back
// periods, yet frustrated with it's inconsistent oscillation between defined
// overbought and oversold levels, Mr. Altman added a momentum component to the RSI.
// As mentioned, the RMI is a variation of the RSI indicator. Instead of counting
// up and down days from close to close as the RSI does, the RMI counts up and down
// days from the close relative to the close x-days ago where x is not necessarily
// 1 as required by the RSI). So as the name of the indicator reflects, "momentum" is
// substituted for "strength".
//
// You can change long to short in the Input Settings
// WARNING:
// - For purpose educate only
// - This script to change bars colors.
////////////////////////////////////////////////////////////
strategy(title="Relative Momentum Index", shorttitle="RMI")
xPrice = close
Length = input(20, minval=1)
BuyZone = input(40, minval=1)
SellZone = input(70, minval=1)
reverse = input(false, title="Trade reverse")
// hline(0, color=gray, linestyle=dashed)
// hline(SellZone, color=red, linestyle=line)
// hline(BuyZone, color=green, linestyle=line)
xMom = xPrice - xPrice[Length]
xMU = iff(xMom >= 0, nz(xMU[1], 1) - (nz(xMU[1],1) / Length) + xMom, nz(xMU[1], 1))
xMD = iff(xMom <= 0, nz(xMD[1], 1) - (nz(xMD[1],1) / Length) + abs(xMom), nz(xMD[1], 0))
RM = xMU / xMD
nRes = 100 * (RM / (1+RM))
pos = iff(nRes < BuyZone, 1,
	   iff(nRes > SellZone, -1, nz(pos[1], 0)))
possig = iff(reverse and pos == 1, -1,
          iff(reverse and pos == -1, 1, pos))
if (possig == 1)
    strategy.entry("Long", strategy.long)
if (possig == -1)
    strategy.entry("Short", strategy.short)
barcolor(possig == -1 ? red: possig == 1 ? green : blue )
plot(nRes, color=blue, title="RMI")
- Trend-Breakout-Verfolgungsstrategie für gleitenden Durchschnitt
- Strategie zur Trendverfolgung auf Basis des Volumen-Oszillators
- Trend nach langfristiger Strategie auf Basis von SuperTrend und Fisher Transform
- Zweifelhafte Golden Cross-Umkehrhandelsstrategie
- Fibonacci zieht sein Trading-Strategieskript zurück
- Die Risikopositionen werden von den Risikokapitalgebern und den Finanzinstituten geprüft, um die Risikopositionen zu ermitteln.
- Breakout-Band-Fixed Stop Loss-Strategie
- Handelsstrategie auf der Grundlage von RSI und SuperTrend
- EMA 13 48 Trend nach der Strategie
- Williams Akkumulation/Verteilung (Williams AD) Strategie
- Doppelbox-Trendverfolgungssystem
- Martingale-Strategie mit erweitertem gleitenden Durchschnittsbereich für den Aktienhandel
- Strategie zur Balance zwischen Bullen und Bären
- Oma und Apollo Dual Rail Handelsstrategie
- Strategie für eine doppelte Kreuzung von gleitenden Durchschnitten
- Strategie zur Trendverfolgung mit zwei Signalen
- Trend nach der SMA-Strategie
- Strategie zur Balance der Löwenspalte
- Adaptive ATR-Strategie für gleitende Durchschnittswerte
- Zwei-Richtungs-Umkehrstrategie