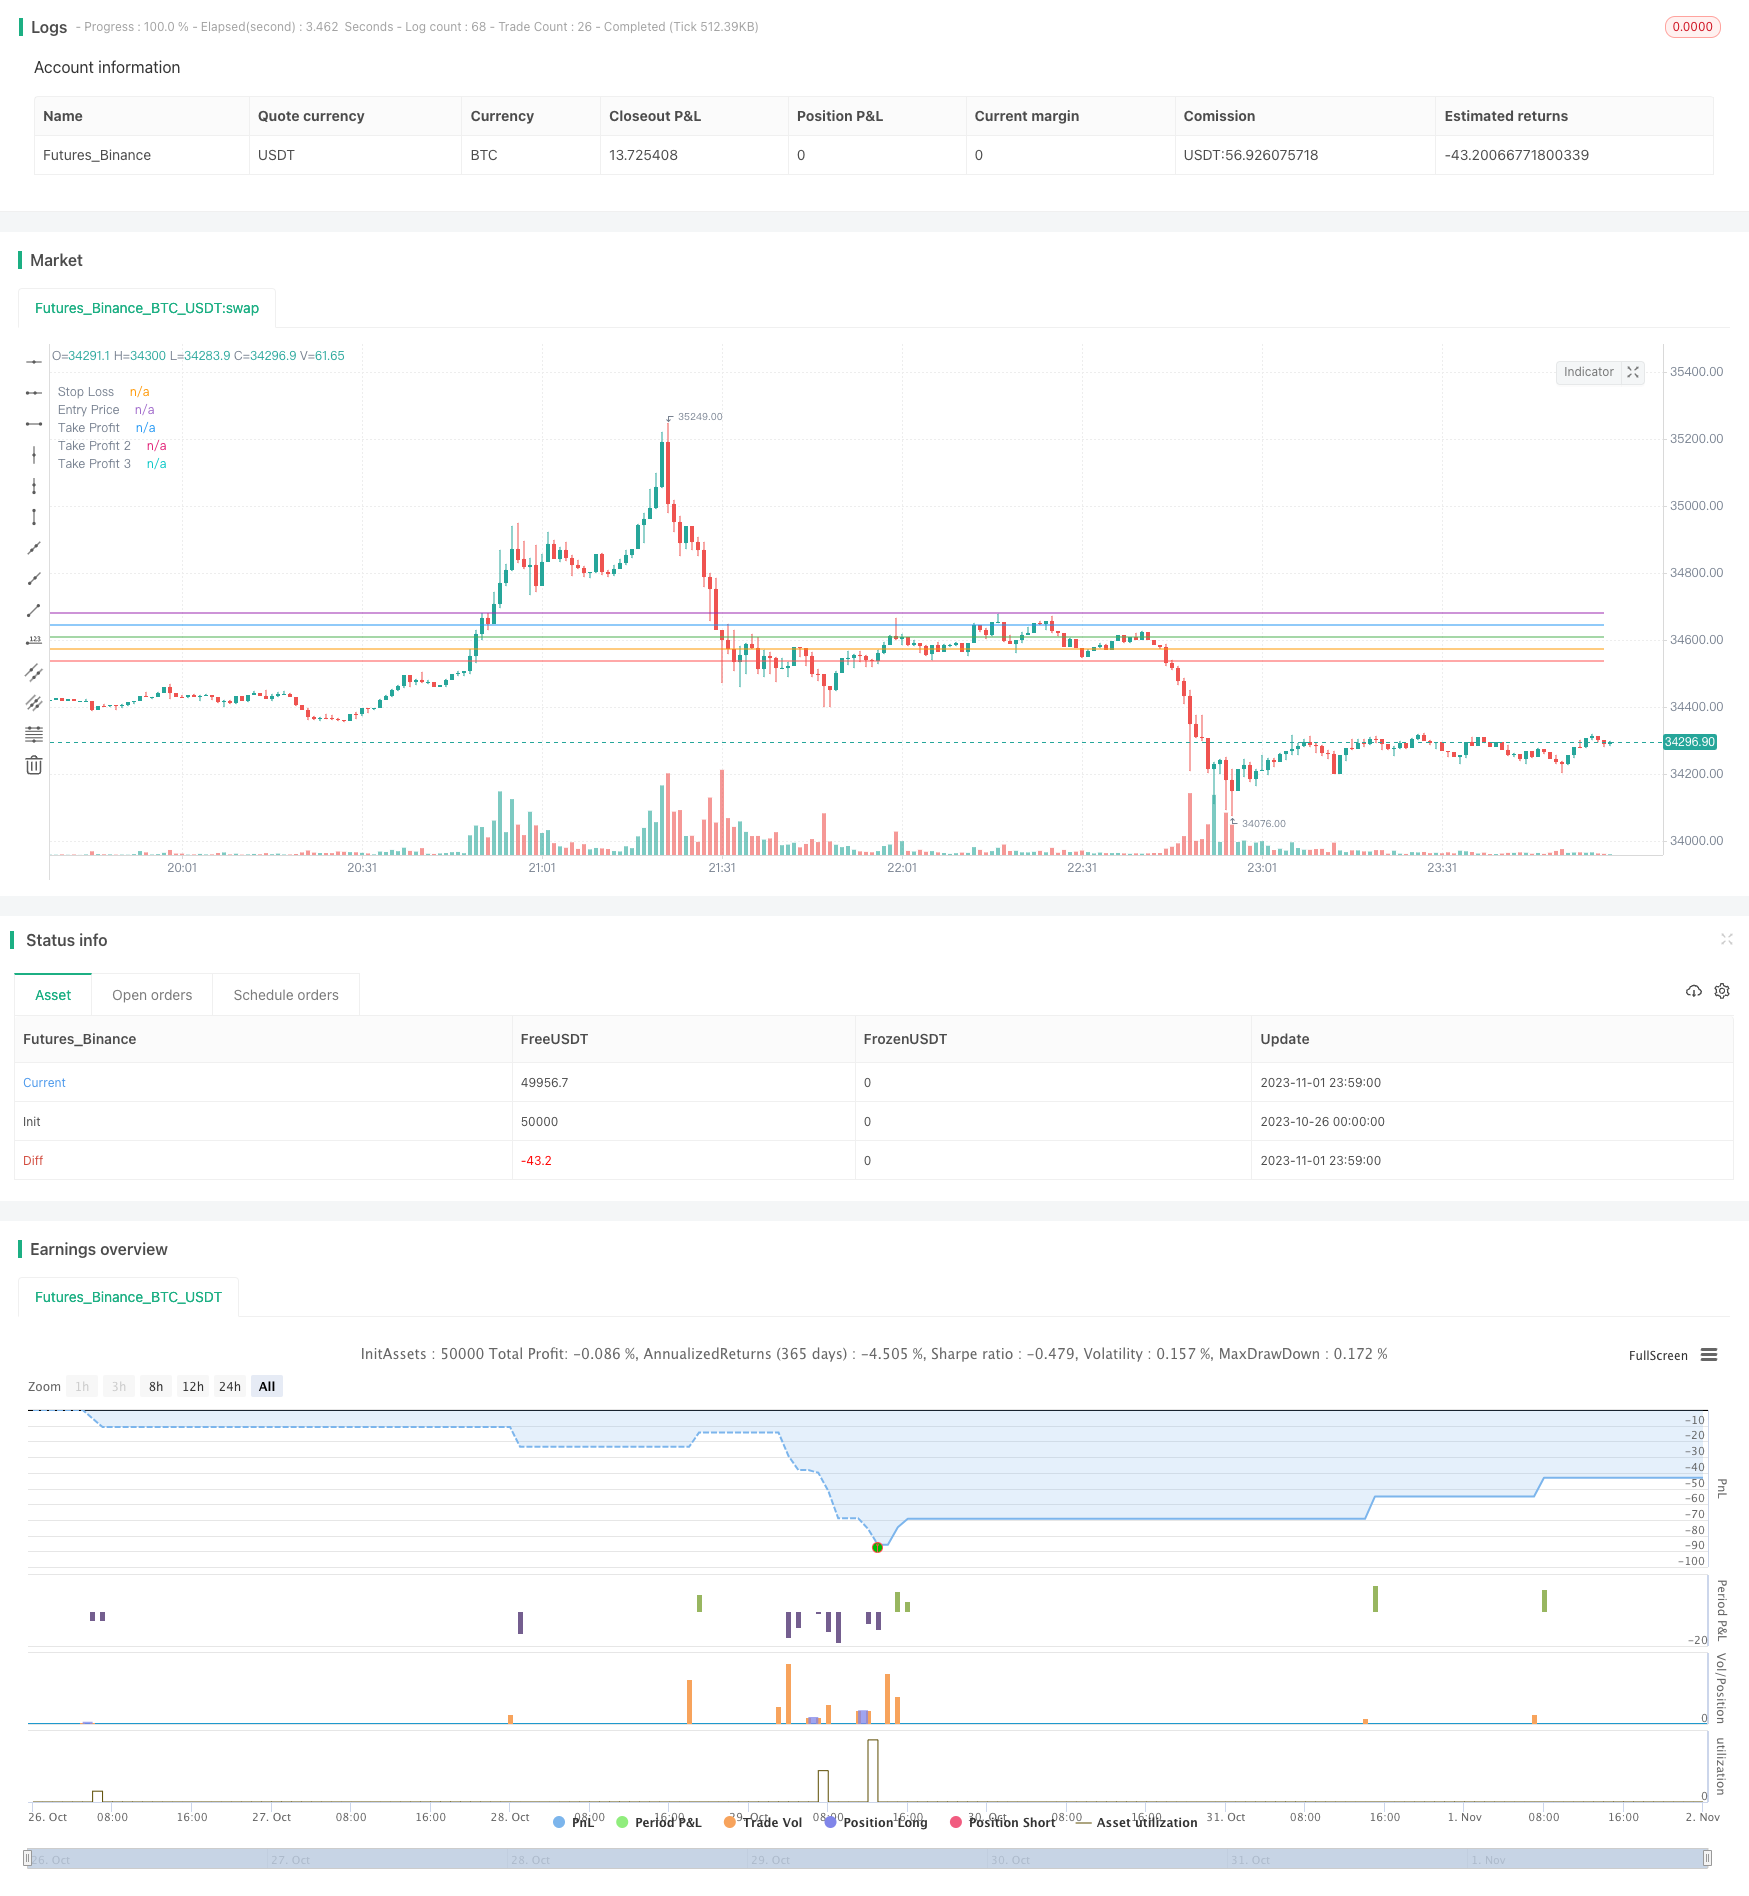
概述
该策略融合了SuperTrend和Fisher变换两个指标,实现了一种较为稳定的趋势跟随长线交易策略。当SuperTrend指标发出买入信号,同时Fisher变换指标小于-2.5且上升时,产生买入信号。策略以合理的止损和止盈方式进行持仓管理。
策略原理
SuperTrend指标用于判断价格趋势方向。当价格上穿上轨时,为看涨信号;当价格下穿下轨时,为看跌信号。本策略在SuperTrend为看涨时发出买入信号。
Fisher变换指标反映价格波动对消费者心理的影响程度。Fisher值在(-2.5, 2.5)区间代表市场neutral,小于-2.5代表市场panic,大于2.5代表市场euphoria。本策略在Fisher小于-2.5且上升时发出买入信号,以捕捉panic到neutral的转折点。
策略以合理止损止盈来管理仓位。止损点设置为入场价减去ATR值与ATR倍数的乘积,止盈点设置为入场价加上ATR值与ATR倍数的乘积。止损幅度大于止盈幅度,体现趋势跟随策略的风险控制思想。
同时考虑了风险金额管理。根据ATR和风险金额计算头寸规模,使每单位风险不超过设置的风险金额。
优势分析
多指标结合,避免单一指标造成交易频繁。SuperTrend判断趋势方向,Fisher变换判断市场心理面,两者结合形成稳定的交易信号。
设置合理止损止盈,有利于把握趋势进行长线持有,同时控制风险。
采用风险金额管理和最小交易单位,使每笔交易风险可控,避免超过承受能力的大额损失。
交易信号稳定,适合长线持有。Fisher变换是平滑指标,有助于过滤市场噪音,避免假信号。
指标参数优化空间大。可以根据不同品种不同周期调整SuperTrend的ATR周期和乘数参数,以及Fisher变换的平滑参数,寻找最佳参数组合。
风险分析
作为趋势跟随策略,在震荡盘整阶段将积累小额损失。应选择趋势明显的品种和周期运行策略。
Fisher变换对极端情况效果不佳。当市场长期维持某一状态时,Fisher值会持续偏离中性区间,此时应暂停策略。
止损点过近可能造成过频退出。应合理设置ATR周期和ATR倍数参数,确保止损距离有一定缓冲区间。
忽略交易成本会导致小额获利交易亏损。应考虑品种的交易费用水平,适当调整止盈幅度。
需长时间参与市场才能体现策略优势。应确保有足够资金支持长线交易,且心态稳定。
优化方向
调整ATR周期和ATR倍数参数,优化止损止盈幅度。可以通过回测数据优化参数,也可以动态优化。
尝试不同的Fisher变换参数,如平滑周期,寻找更稳定的交易信号。可以结合市场波动率动态调整参数。
结合其他指标作为过滤器,避免大盘不确定时的错误交易。可采用均线、波动率等判断大盘走势。
测试不同止盈策略,如移动止盈、分批止盈、ATR尾随止盈等,提高盈利能力。
优化资金管理策略,如固定比例资金管理、凯利公式等,使盈亏比更高。
针对交易费用进行优化,确保小额持仓交易后保持盈利。
总结
该策略整合SuperTrend和Fisher变换等指标优势,形成稳定的趋势跟随长线交易策略。通过止损止盈管理和风险控制,能获得较好的风险回报率。策略有待进一步优化参数、过滤信号、资金管理等方面,以获得更强的实盘表现。但整体思路稳健,值得实盘验证和持续优化。如果管理停利和风险的心态,该策略有望获得稳定的长线收益。
/*backtest
start: 2023-10-26 00:00:00
end: 2023-11-02 00:00:00
period: 1m
basePeriod: 1m
exchanges: [{"eid":"Futures_Binance","currency":"BTC_USDT"}]
*/

//@version=5
strategy("Supertrend and Fisher_LONG", overlay=true)

//This block is for  Fisher Transformation Calculation.
len = input.int(10, minval=1, title="Length") // Length is optional. 10 is good but is up to you.
high_ = ta.highest(hl2, len)
low_ = ta.lowest(hl2, len)
round_(val) => val > .99 ? .999 : val < -.99 ? -.999 : val
value = 0.0
value := round_(.66 * ((hl2 - low_) / (high_ - low_) - .5) + .67 * nz(value[1]))
fish1 = 0.0
fish1 := .5 * math.log((1 + value) / (1 - value)) + .5 * nz(fish1[1])
fish2 = fish1[1]

// Buy condition for Fisher transformation.
buy_signal = (fish1 < -2.5) and (fish1 > fish2)
durum = 0 //just for the situation.

if (buy_signal)
    durum := 1 // now it changes from 0 to 1.

// Supertrend indicator inputs and calculations (same as in the indicator)
Periods = input(title='ATR Period', defval=10) // period is 10, but you can change it
src = input(hl2, title='Source')
Multiplier = input.float(title='ATR Multiplier', step=0.1, defval=2) //atr multiplier is important. it is 2 for this strategy but you can find another for best performance
RiskAmount = input.float(title='Risk Amount ($)', defval=10.0, minval=0.0, step=1.0) // ıf you use risk-reward method, risk is 10$ for each position. you can also change it
changeATR = input(title='Change ATR Calculation Method ?', defval=true)

atr2 = ta.sma(ta.tr, Periods)
atr = changeATR ? ta.atr(Periods) : atr2
up = src - Multiplier * atr
up1 = nz(up[1], up)
up := close[1] > up1 ? math.max(up, up1) : up
dn = src + Multiplier * atr
dn1 = nz(dn[1], dn)
dn := close[1] < dn1 ? math.min(dn, dn1) : dn
trend = 1
trend := nz(trend[1], trend)
trend := trend == -1 and close > dn1 ? 1 : trend == 1 and close < up1 ? -1 : trend

// Calculate position size based on risk amount
riskPerContract = atr * Multiplier
contracts = RiskAmount / (riskPerContract * syminfo.mintick)

//short signal condition
buySignal = trend == 1 and trend[1] == -1 and durum == 1

plotshape(buySignal, title='Buy Signal', location=location.belowbar, color=color.green, style=shape.triangleup, size=size.small)

// variables
var float entryPrice = na
var float stopLoss = na
var float takeProfit = na
var float atr1 = na
var float takeProfit2 = na
var float takeProfit3 = na

//it calculates the stop level and reward profit levels using atr.
if (buySignal)
    entryPrice := close
    atr1 := atr
    stopLoss := entryPrice - atr1 * Multiplier
    contracts := entryPrice / (entryPrice - stopLoss) * RiskAmount / entryPrice
    takeProfit := entryPrice + atr1 * Multiplier
    takeProfit2 := entryPrice + 2 * atr1 * Multiplier
    takeProfit3 := entryPrice + 3 * atr1 * Multiplier

if (buySignal)
    strategy.entry("Buy", strategy.long, qty=contracts)

//
if (close <= stopLoss)
    strategy.close("Buy", comment="Stop Loss Hit")
else if (close >= takeProfit)
    strategy.close("Buy", comment="Take Profit Hit")

// draw the stop, entry and profit levels
plot(stopLoss, title="Stop Loss", color=color.red, linewidth=1, style=plot.style_linebr)
plot(entryPrice, title="Entry Price", color=color.orange, linewidth=1, style=plot.style_linebr)
plot(takeProfit, title="Take Profit", color=color.green, linewidth=1, style=plot.style_linebr)
plot(takeProfit2, title="Take Profit 2", color=color.blue, linewidth=1, style=plot.style_linebr)
plot(takeProfit3, title="Take Profit 3", color=color.purple, linewidth=1, style=plot.style_linebr)