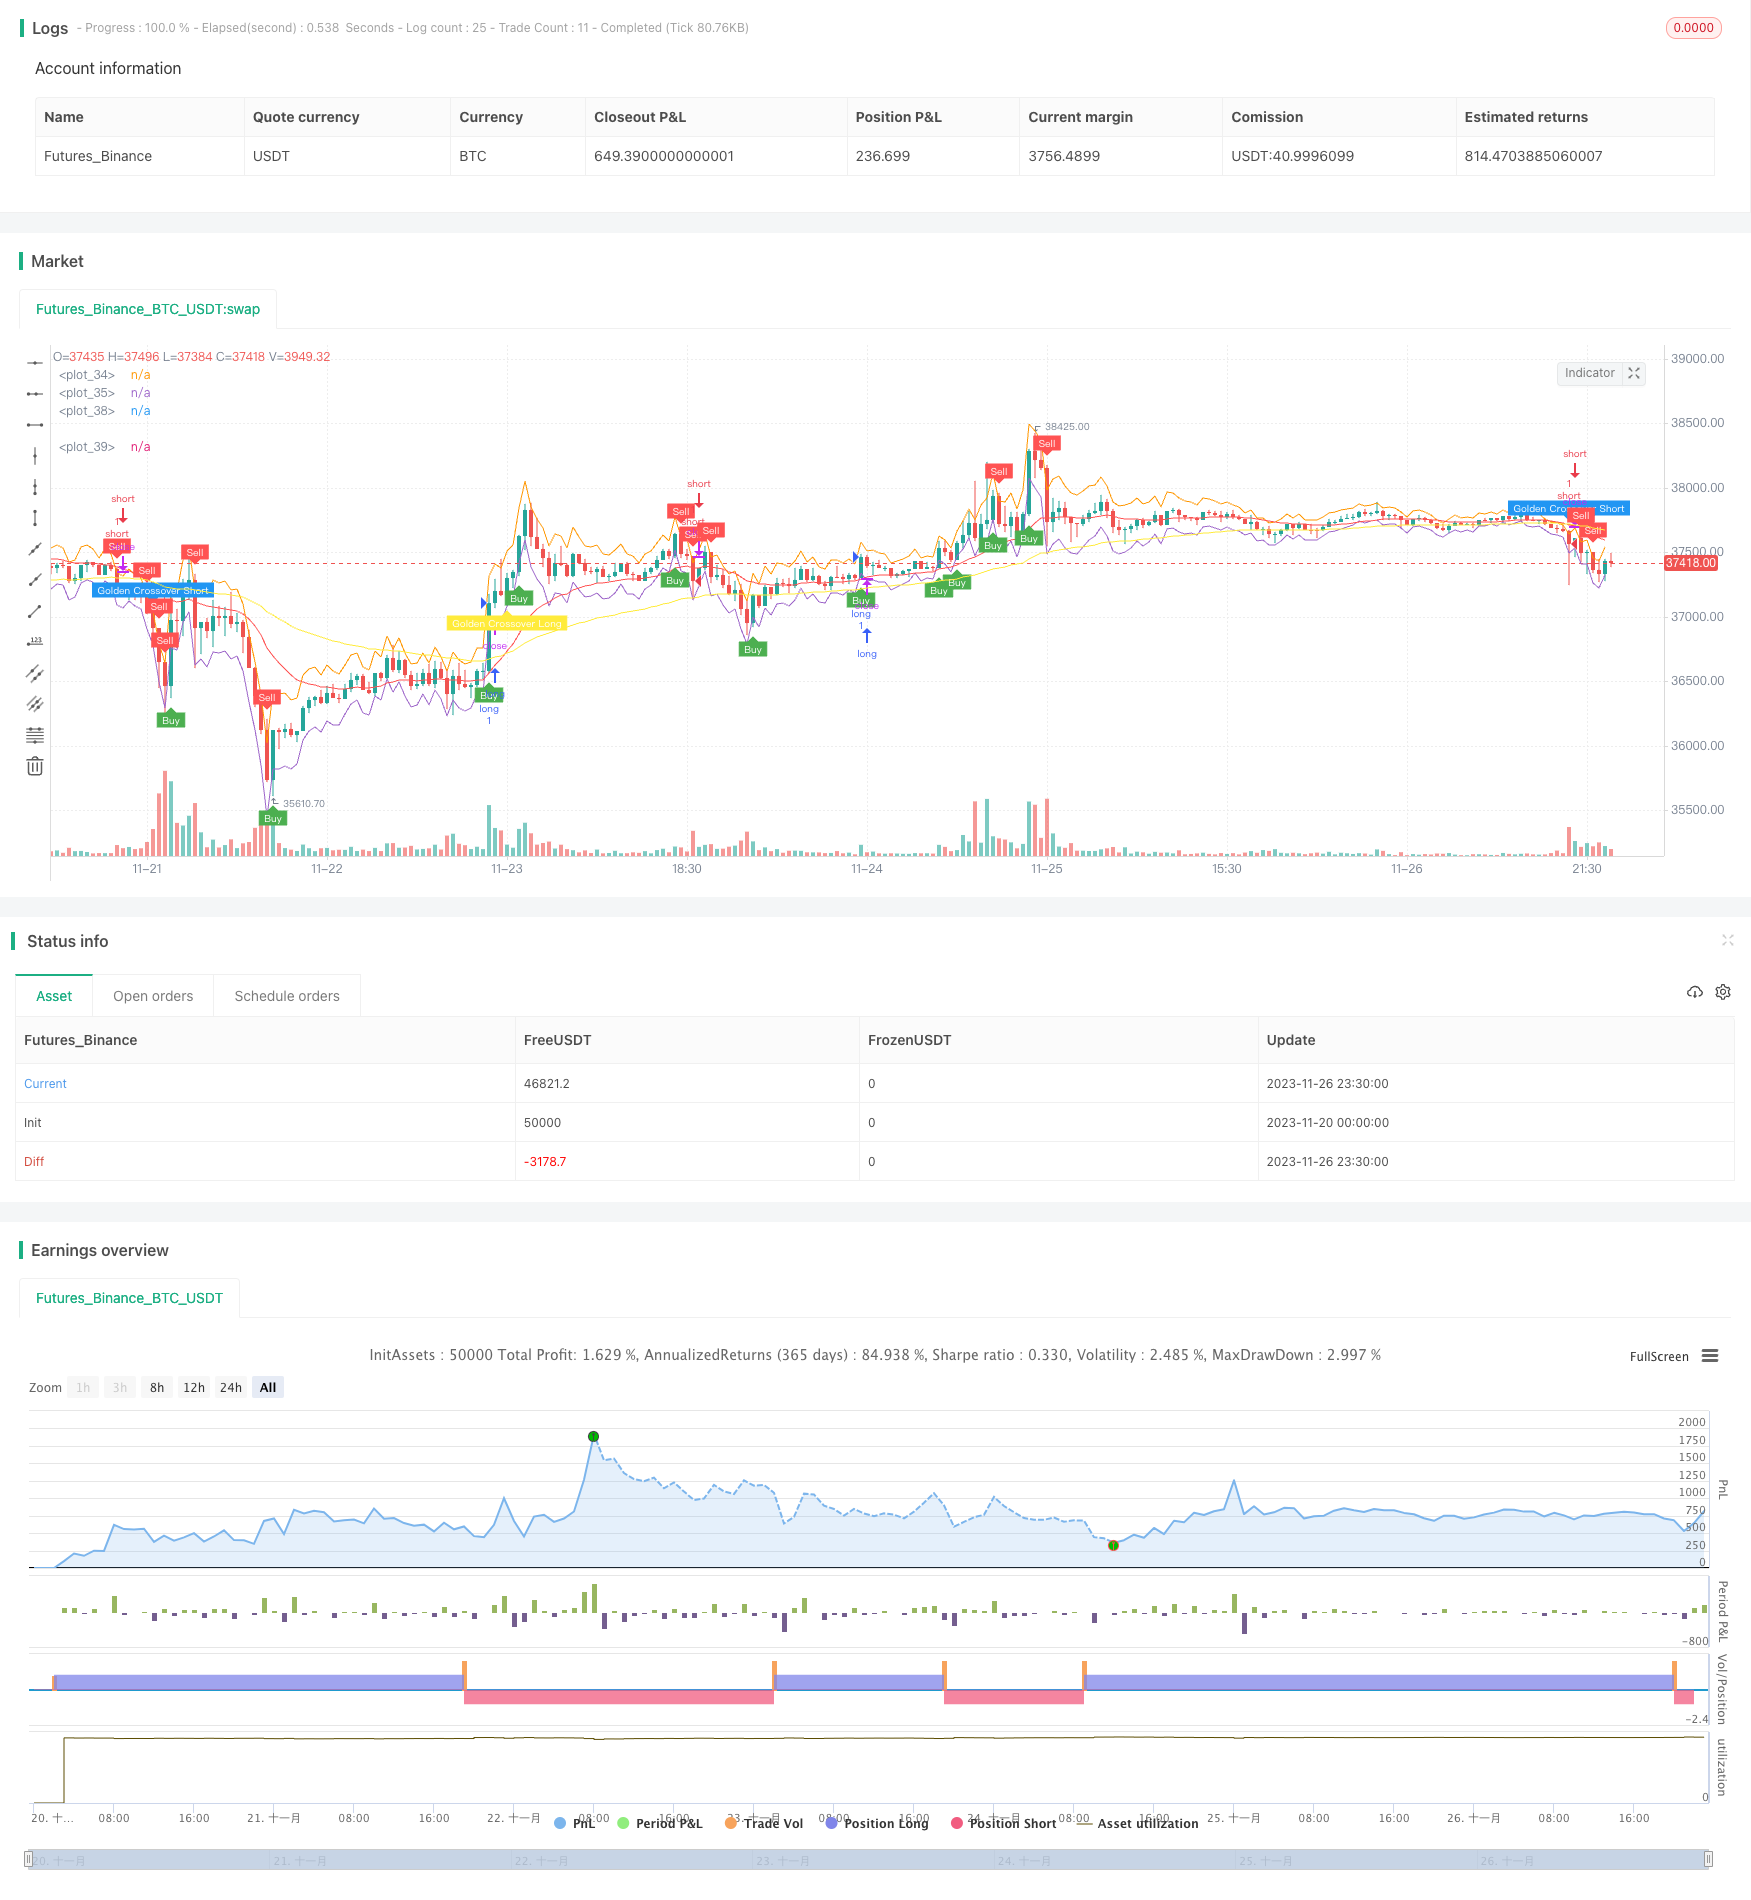
Super-Scalping-Strategien basierend auf RSI und ATR-Kanälen
Schriftsteller:ChaoZhang, Datum: 2023-11-28 15:15:14Tags:

Super-Scalping-Strategie auf Basis von RSI und ATR-Kanal
Übersicht
Diese Strategie basiert auf dem Relative Strength Index (RSI) und dem Average True Range (ATR) -Kanal, geeignet für 5-minütige und 15-minütige Zeitrahmen, die zum Super-Scalping-Strategietypen gehören.
Strategieprinzip
- Verwenden Sie den 21-Tage-Exponential Moving Average (EMA) und den 65-Tage-EMA, um die Haupttrendrichtung zu beurteilen.
- Wenn der RSI unter 50 liegt, ist er bärisch; wenn er über 50 liegt, ist er bullisch und sendet Kauf- und Verkaufssignale aus.
- Die oberen und unteren Bands des ATR-Kanals sind: close+ATR und close-ATR. Verkaufen, wenn close durch das obere Band des ATR bricht und kaufen, wenn es durch das untere Band bricht.
- Setzen Sie den Stop-Loss auf das 2-fache des ATR und nehmen Sie den Gewinn auf das 5-fache des ATR.
Analyse der Vorteile
- Die Verwendung von goldenem Kreuz und totem Kreuz zur Bestimmung des Haupttrends und Vermeidung des Handels gegen den Trend.
- RSI kann bessere Eintrittszeiten erkennen.
- Der ATR-Kanal setzt Stop-Loss- und Take-Profit-Punkte effektiv ein und verbessert die Gewinn-Verlust-Ratio erheblich.
- Geeignet für den Hochfrequenz-Scalping-Handel mit schnellen Gewinnen.
Risikoanalyse
- Der Markt muss genau beobachtet werden, sonst kann ein fehlender Eintritts- oder Stop-Loss-Punkt zu großen Verlusten führen.
- Auf dem Trendmarkt können mehrere zusätzliche Positionen auftreten, die eine gute Kontrolle der Positionsgröße erfordern.
- Für den häufigen Handel ist genügend Kapital erforderlich.
Optimierungsrichtung
- Optimieren Sie die ATR-Parameter für einen vernünftigeren Stop Loss und Gewinn.
- Hinzufügen anderer Indikatorfilter zur Verbesserung der Eingangsqualität.
- Fügen Sie automatische Stop-Loss- und Take-Profit-Funktionen hinzu.
- Einbeziehung von Modulen zur Steuerung des Kapitalmanagements und der Positionsgrößenbildung.
Zusammenfassung
Diese Strategie gehört zum Hochfrequenz-Scalping-Handelstyp. Sie setzt Eingangs- und Ausstiegspunkte durch RSI-Indikator und ATR-Kanal für schnelle Trades. Die Vorteile sind schneller Gewinn mit guter Risikokontrolle, geeignet für den Handel entlang des Trends. Allerdings ist eine enge Marktbeobachtung mit ausreichend Kapital zur Unterstützung häufiger Trades erforderlich. Insgesamt funktioniert diese Strategie gut für den Trendhandel und könnte durch Optimierung die Rentabilität weiter verbessern.
/*backtest
start: 2023-11-20 00:00:00
end: 2023-11-27 00:00:00
period: 30m
basePeriod: 15m
exchanges: [{"eid":"Futures_Binance","currency":"BTC_USDT"}]
*/

//@version=4
strategy("Super Scalper - 5 Min 15 Min", overlay=true)

// Create Indicator's
shortSMA = ema(close, 21)
longSMA = ema(close, 65)
rsi = rsi(close, 14)
atr = atr(14)

// Specify  conditions
longCondition = open < close-atr
shortCondition = open > atr+close
GoldenLong = crossover(shortSMA,longSMA)
Goldenshort = crossover(longSMA,shortSMA)

plotshape(shortCondition, title="Sell Label", text="Sell", location=location.abovebar, style=shape.labeldown, size=size.tiny, color=color.red, textcolor=color.white, transp=0)
plotshape(longCondition, title="Buy Label", text="Buy", location=location.belowbar, style=shape.labelup, size=size.tiny, color=color.green, textcolor=color.white, transp=0)
plotshape(Goldenshort, title="Golden Sell Label", text="Golden Crossover Short", location=location.abovebar, style=shape.labeldown, size=size.tiny, color=color.blue, textcolor=color.white, transp=0)
plotshape(GoldenLong, title="Golden Buy Label", text="Golden Crossover Long", location=location.belowbar, style=shape.labelup, size=size.tiny, color=color.yellow, textcolor=color.white, transp=0)
// Execute trade if condition is True
if (longCondition)
    stopLoss = low - atr * 2
    takeProfit = high + atr * 5
    strategy.entry("long", strategy.long, 1, when = rsi > 50)


if (shortCondition)
    stopLoss = high + atr * 2
    takeProfit = low - atr * 5
    strategy.entry("short", strategy.short, 1, when = rsi < 50)


// Plot ATR bands to chart
plot(atr+close)
plot(close-atr)

// Plot Moving Averages
plot(shortSMA, color = color.red)
plot(longSMA, color = color.yellow)
Mehr
- Strategie für den Rohstoffmomentumindex
- Strategie für den Durchbruch der doppelten Schildkröte
- Quantitative Handelsstrategie auf Basis der Wellenentwicklung
- Ichimoku Kumo Twist-Gold-Absorbierungsstrategie
- Schrittweise Verzögerung mit Teilgewinnstrategie
- TSI und CCI Hull Strategie zur Verfolgung des gleitenden Durchschnittstrends
- RSI-Strategie im Umkehrverfahren
- Doppelte quantitative Strategie der CCI
- Zweigleisige EMA-Crossover-Ausbruchstrategie
- Multi-Zeitrahmen-MACD-Strategie
- Donchianische Trendstrategie
- Multi-SMA-Crossover-Strategie für gleitende Durchschnitte
- Handelsstrategie für Multi-RSI-Indikatoren
- SuperTrend-Strategie mit Trailing Stop Loss
- Gewichtete gleitende Durchschnittswerte
- Strategie für einen gleitenden durchschnittlichen relativen Stärkeindex
- ADX-Intelligente Trendverfolgungsstrategie
- Strategie zur Aggregation von RSI-Momentum
- Strategie zur Verringerung von Verlusten auf Basis von Preisunterschieden
- Strategie für einen brechenden gleitenden Durchschnitt