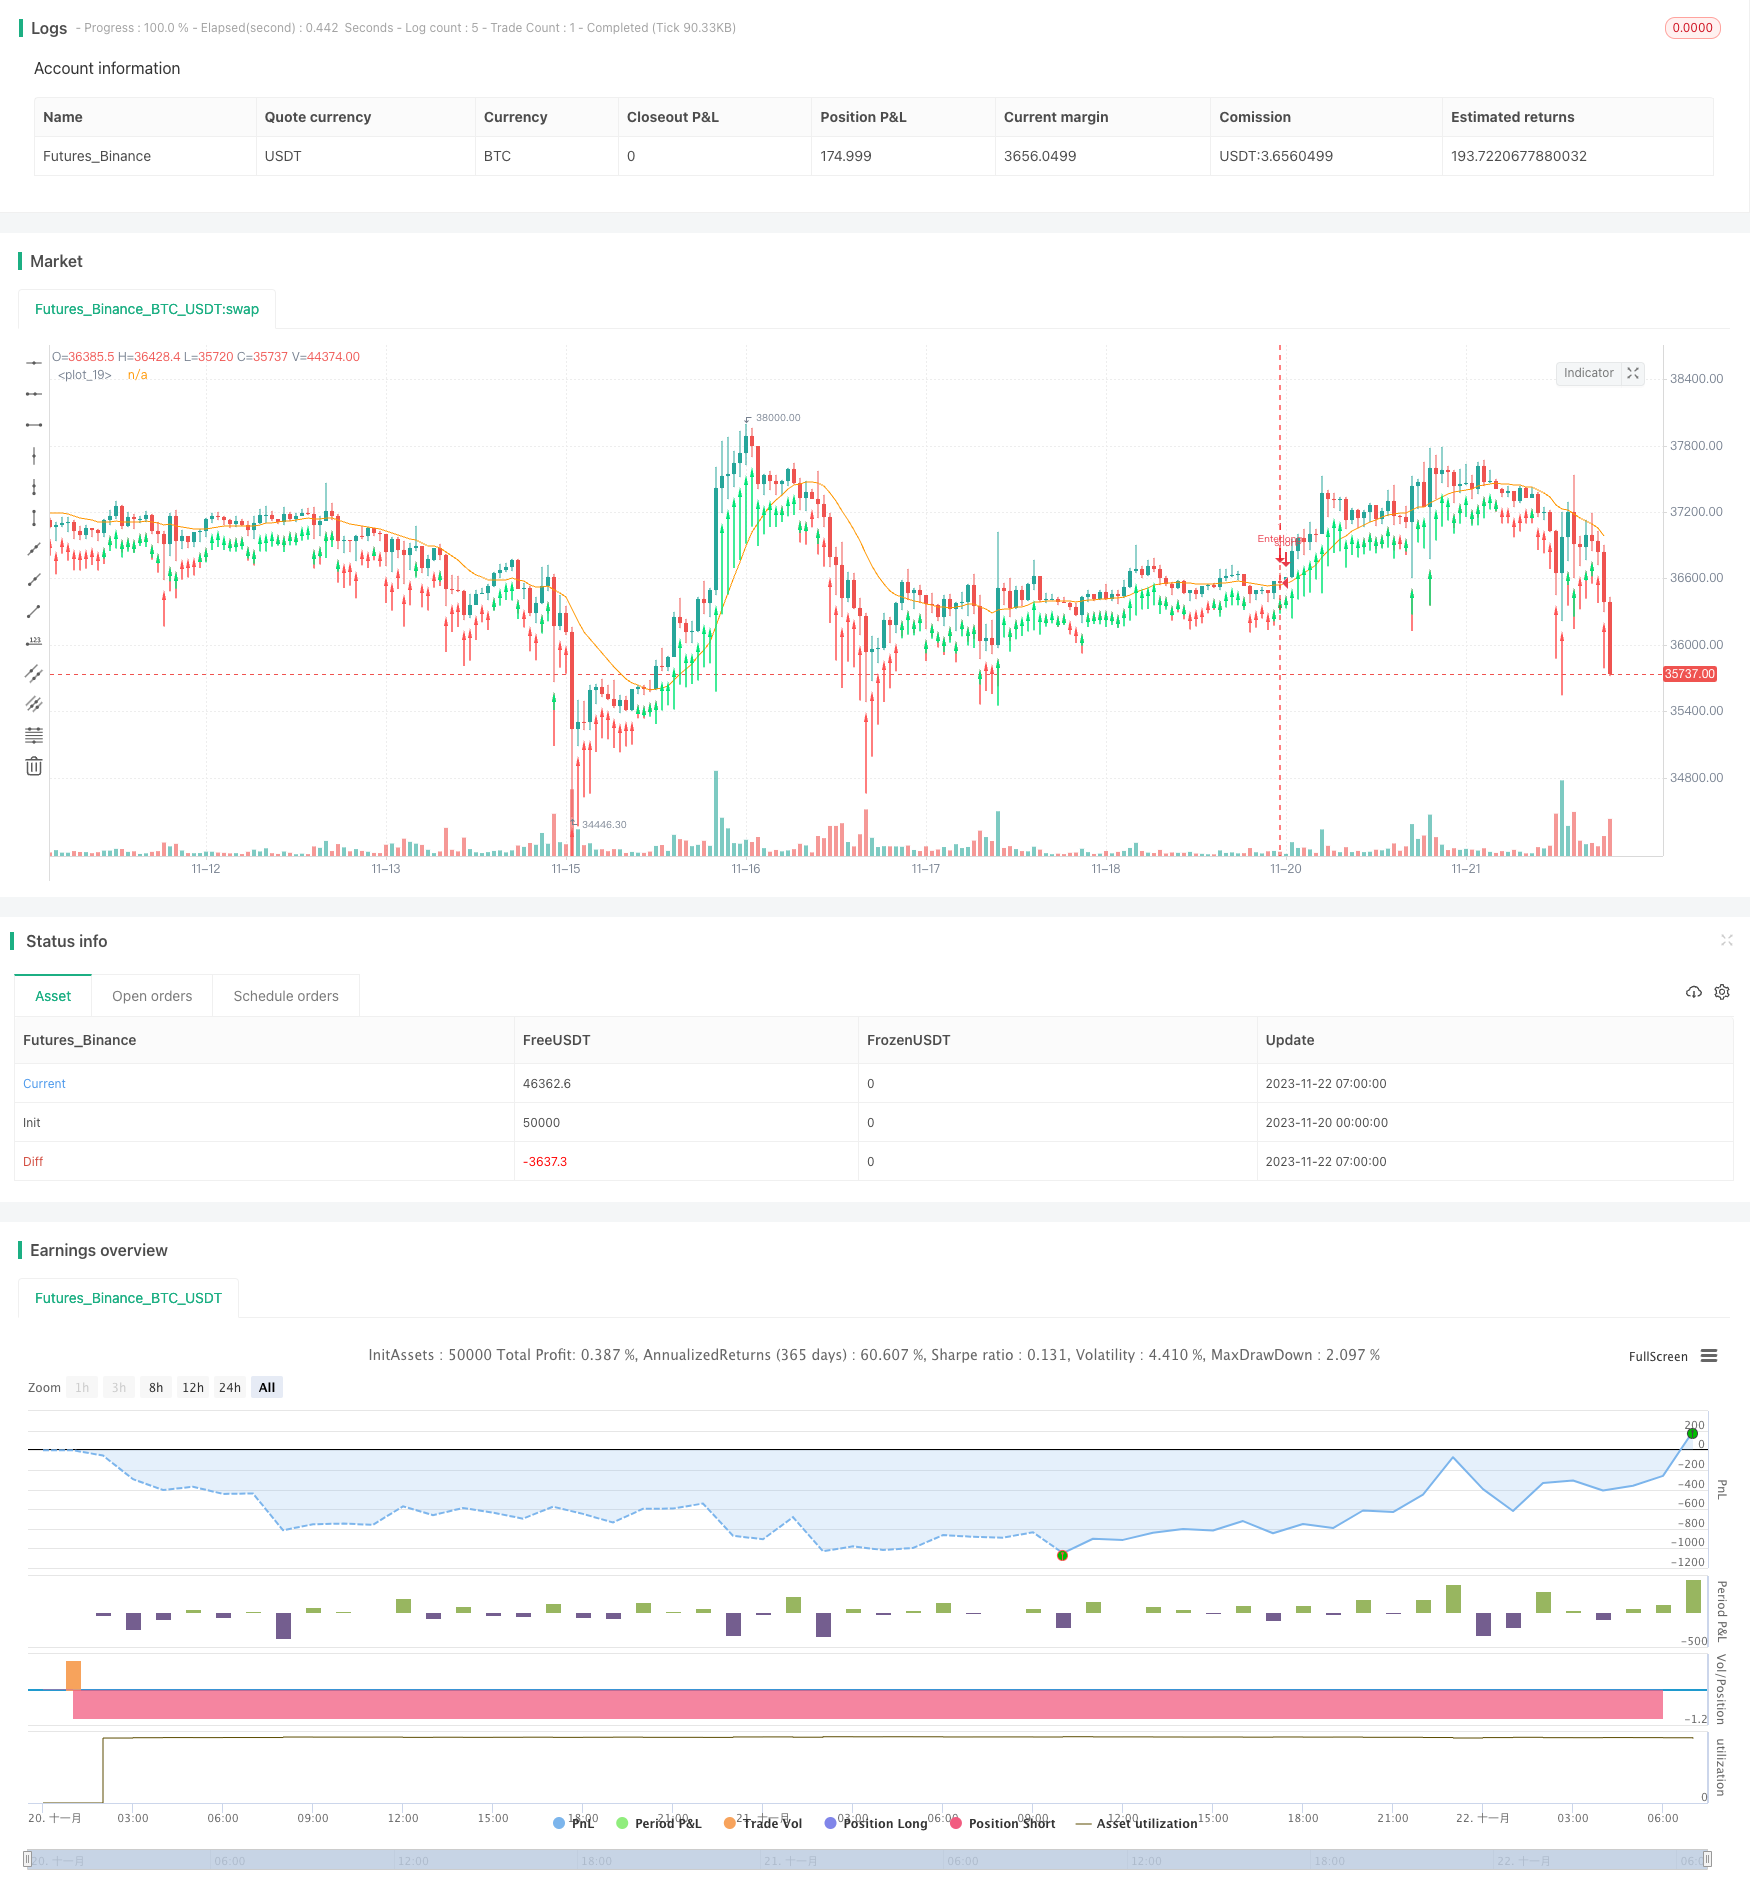
概述
该策略的主要思想是利用价格反转回测试加权移动均线附近的重要支持或阻力区域来建立头寸。当价格暴涨或暴跌后回调测试均线时,很可能形成支撑或压力,从而产生反转机会。
策略原理
该策略基于加权移动均线指标,首先计算一定长度的加权移动均线,然后监测价格是否出现一定幅度的突破。当价格突破均线达到一定距离时,绘制箭头指示并开仓建立头寸。进入多头时,价格要首先出现一定幅度的突破下跌;进入空头时,价格要首先出现一定幅度的突破上涨。这样通过突破形成反转信号,再结合移动均线的支持阻力区域,可以优化进入市场的时机。
策略通过trail参数选择是否使用追踪止损,还是使用固定止损距离。可以通过调整止损幅度来控制风险。通过限价单参数来锁定部分利润。还可以通过时间过滤来限制特定时段开仓。
优势分析
该策略最大的优势在于利用反转行情与均线结合,找准市场关键点进行开仓。反转策略的胜率和盈亏比通常较好,风险容易控制。同时,该策略还提供了完善的止损机制,以及部分利润的锁定方法,这些都可以帮助降低风险,提高稳定性。
由于建立在移动均线基础之上,因此参数优化空间较大,可以通过调整均线长度、突破幅度等参数来测试不同市场的适应性。
风险分析
该策略最大的风险在于反转失败。当价格形成反转信号后,如果不能成功触发止损或止盈,而继续原有方向运行,则会形成较大的浮亏。
此外,对参数优化依赖较高,如果参数设置不当,容易错过价格反转时机或产生假信号。需要充分理解和测试市场行为,仔细评估参数设置。
优化方向
可以考虑加入更多指标来提高信号质量和准确率。例如在价格出现反转信号之前,可以检测一定时期内的增量,特别是短周期增量数据,判断价格波动特征。或者加入一定量化因子,检测价格的动量、波动率等特征值,构建多因子模型。
还可以尝试机器学习方法,通过记录历史交易信号和价格数据,训练模型判断价格下一步的可能走势。这可以帮助过滤假信号,提高信号质量。
此外,可以引入一定的自适应优化机制。根据实际交易结果,动态调整参数或规则权重,实现策略的自我优化和ENO。
总结
该策略整体运作稳定,在合理的参数空间和市场环境下,可以获得不错的收益。最大的优势是风险可控,同时具备一定的优化潜力。下一步工作将专注于信号质量的提升,并增加自适应优化能力。相信在持续优化后,该策略可以成为投资组合中的有力选择。
/*backtest
start: 2023-11-20 00:00:00
end: 2023-11-22 08:00:00
period: 1h
basePeriod: 15m
exchanges: [{"eid":"Futures_Binance","currency":"BTC_USDT"}]
*/

//@version=3
strategy(title="WMA Breakout",overlay=true, initial_capital=25000, default_qty_value=1, commission_type=strategy.commission.cash_per_contract, commission_value=3.02)
len = input(20, minval=1, title="Length")
src = input(close, title="Source")
out = wma(src, len)
price_drop = input(.003, "When price drops (In Ticks) Enter Long", step=.001)
price_climb = input(.003, "When price climbs (In Ticks) Enter Short", step=.001)
trail = input(true, "Trailing Stop(checked), Market stop(unchecked)")
stop = input(10, "Stop (in ticks)", step=1)
limit = input(5, "Limit Out", step=1)
//size = input(1, "Limit Position Size (pyramiding)", minval=1)
timec = input(true, "Limit Time of Day (Buying Side)")


//Time Session
sess = input("1600-0500", "Start/Stop trades (Est time)")
t = time(timeframe.period, sess)
//plots
plot(wma(src,len))
z = if low+price_drop<out
    (out-low)
plotarrow(z, colorup=red)

a = if high-price_climb>out
    (high-out)
plotarrow(a, colorup=lime)
av=wma(src,len)

//Orders
if(timec)
    strategy.entry("Enterlong", long=true, when=z and t>1)
else
    strategy.entry("Enterlong", long=true, when=z)
if(trail)
    strategy.exit("Exit","Enterlong", profit=limit, trail_points = 0, trail_offset = stop )
else
    strategy.exit("Exit","Enterlong", profit=limit, loss = stop )

if(timec)
    strategy.entry("Entershort", long=false, when=a and t>1)
else
    strategy.entry("Entershort", long=false, when=a)
if(trail)
    strategy.exit("Exit","Entershort", profit=limit, trail_points = 0, trail_offset = stop )
else
    strategy.exit("Exit","Entershort", profit=limit, loss = stop )