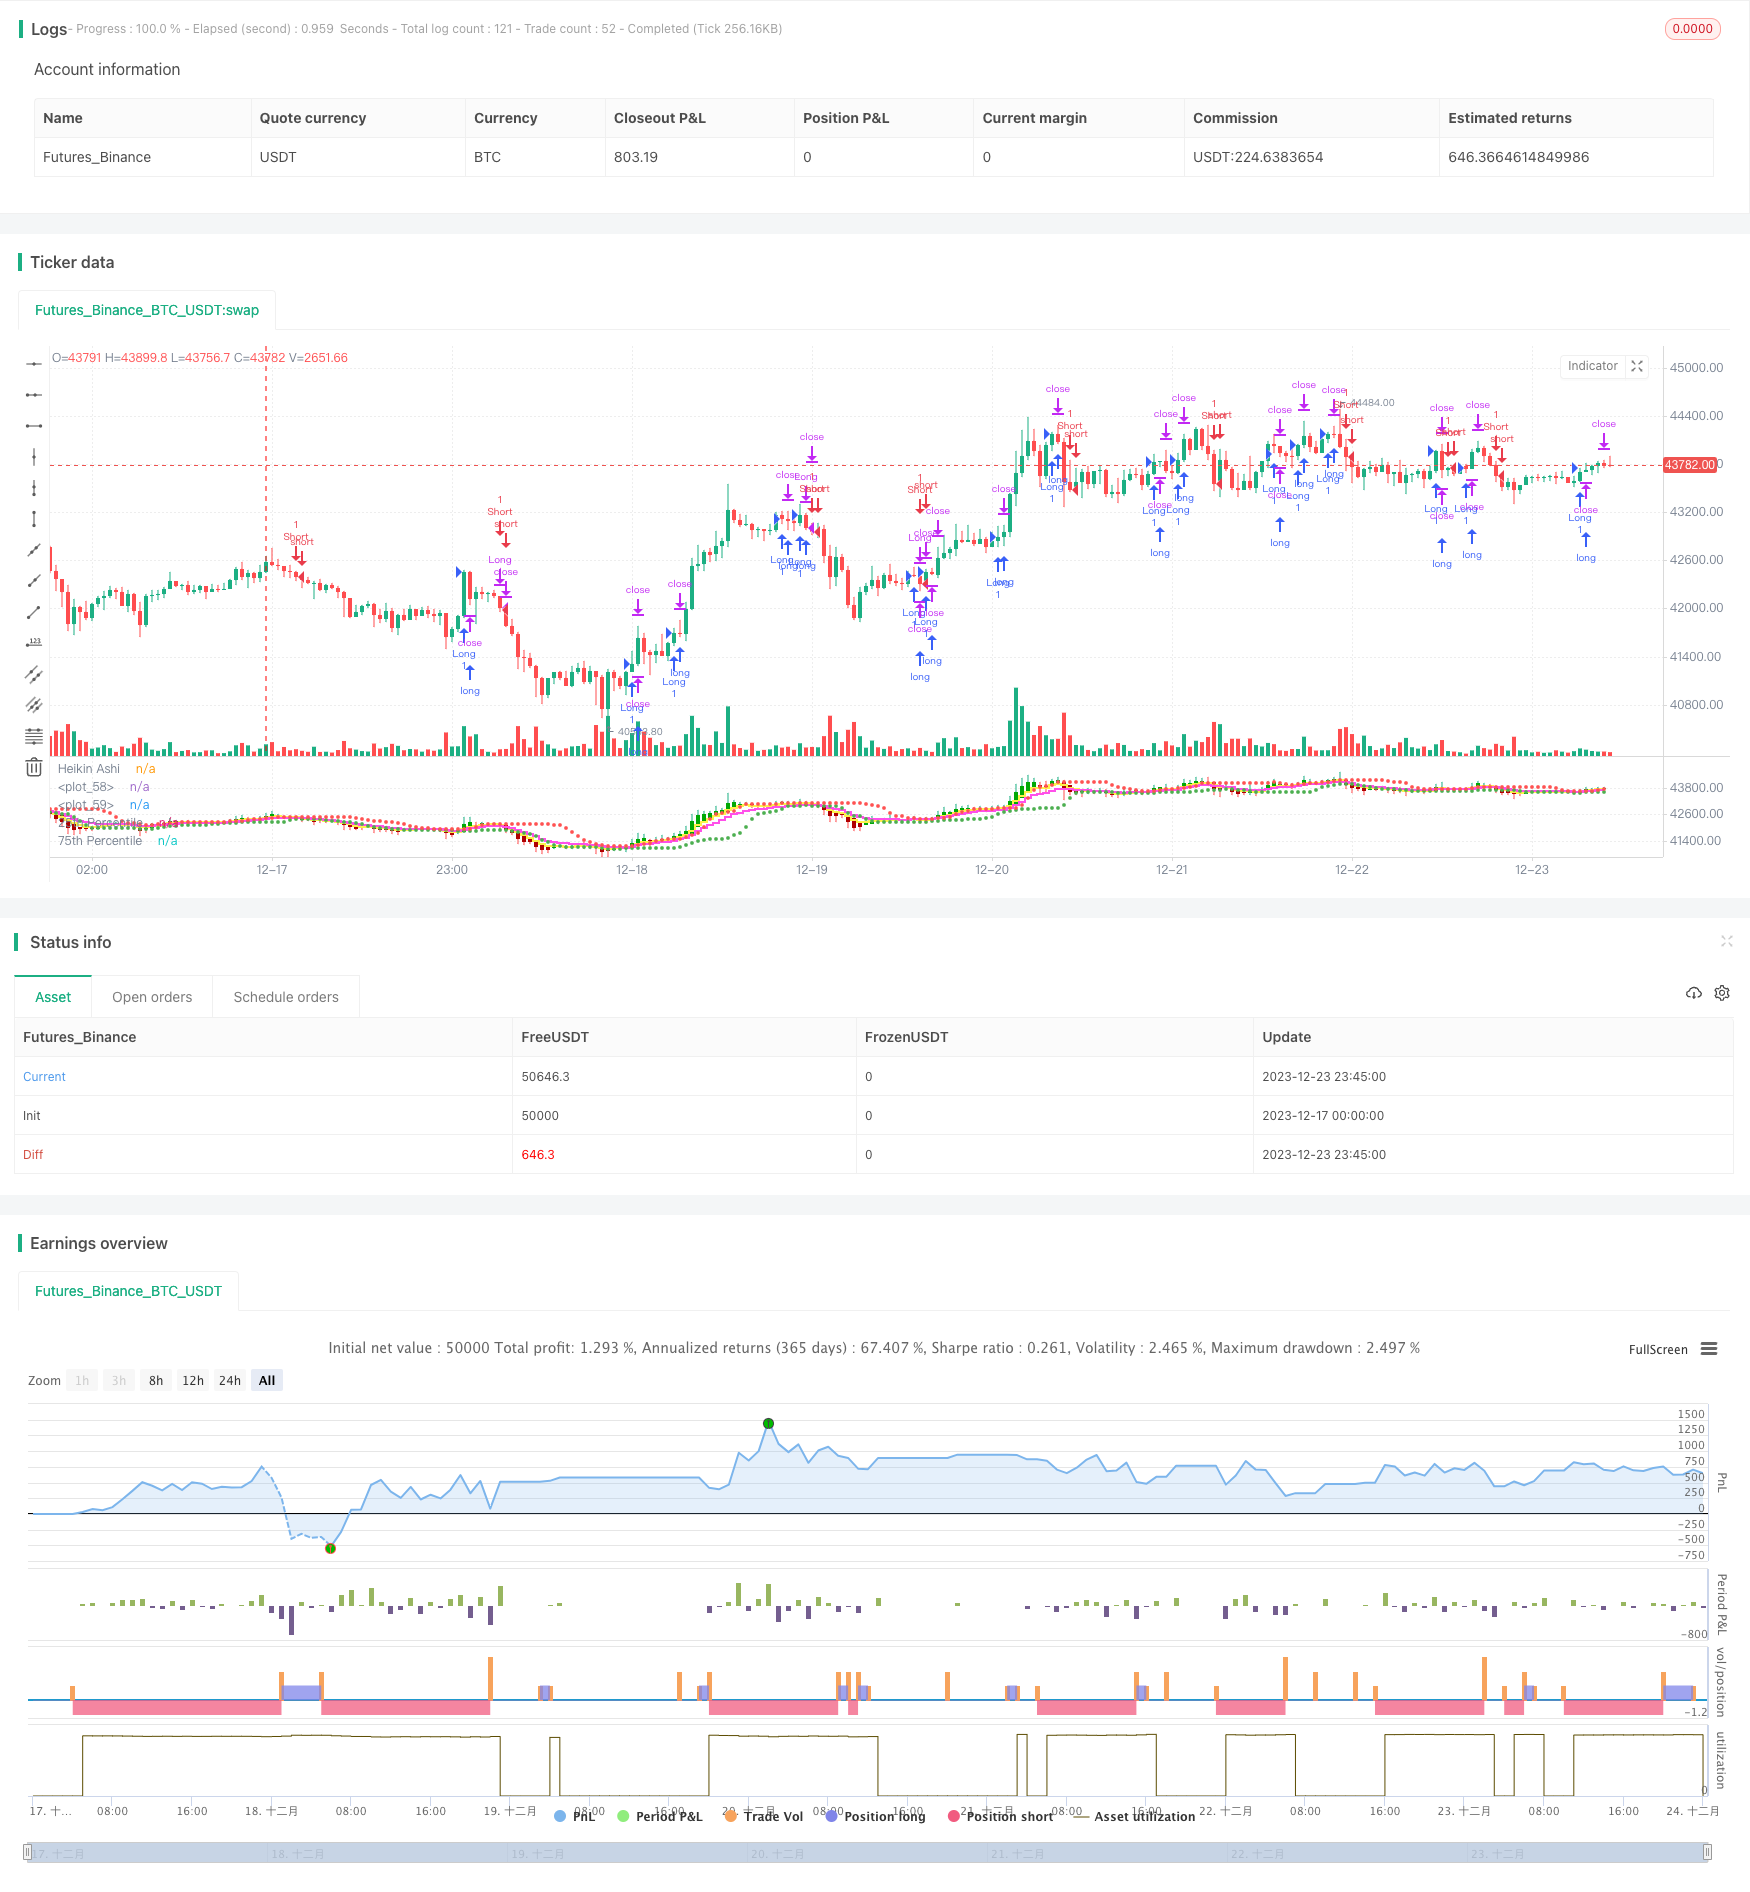
Heinach-Handelsstrategie für gleitende Durchschnitte basierend auf Perzentilen

Überblick
Die Strategie basiert auf der Erzeugung von Handelssignalen für die Heinrichs-Equivalen. Die Erzeugung von Kauf- und Verkaufssignalen berücksichtigt die Kreuzung des Heinrichs-Schlusskurses mit dem 75-Prozent-Preisniveau sowie die beiden Faktoren, dass der Heinrichs-Schlusskurs über dem Moving Average liegt.
Strategieprinzip
Die Strategie analysiert mit einer Heinrich-Achse-Equivalen anstelle einer normalen K-Equivalen, die Marktlärm filtert und eher für die Trendentdeckung und Umkehrsignale geeignet ist. Konkret kombiniert die Strategie die Prozentkanäle mit den Moving Averages, um Handelssignale zu erzeugen:
- Ein Kaufsignal wird erzeugt, wenn ein 75%-Punkt über dem Ende von Heinrichs Kurs liegt.
- Ein Verkaufssignal wird erzeugt, wenn ein 5-Tage-Moving-Average unterhalb des Heinz-Ach-Schlusspreises durchbrochen wird.
Darüber hinaus wurde eine Stop-Loss-Distanz und eine Stop-Loss-Verfolgung festgelegt, um einseitige Risiken zu kontrollieren.
Strategische Vorteile
- Die Verwendung der Heinrichs-Even-Linie ermöglicht eine klarere Trenderkennung und die rechtzeitige Entdeckung von Umkehrsignalen.
- In Kombination mit dem Prozentkanal kann festgestellt werden, ob der Preis in einem Über-Hit- oder Überverkaufszustand ist, um zu entscheiden, wann zu kaufen und zu verkaufen ist.
- Die Einrichtung von Stop-Loss und die Verfolgung von Stop-Losses helfen, Risiken aktiv zu kontrollieren und übertragbare Verluste zu vermeiden.
Strategisches Risiko
- Die Einheitslinie von Heinrich Aachen selbst verursacht Verzögerungen und kann die beste Stelle für die Kurzstreckenoperation verpassen.
- Die Prozentkanäle können die Wendepunkte des Preises nicht vollständig bestimmen und es gibt eine bestimmte falsche Signalrate.
- Eine falsche Einstellung des Stop-Loss-Distanz kann zu locker oder zu eng sein, was die Strategie beeinträchtigt.
Um diese Risiken zu verringern, können Sie die Moving Average-Periode oder die Stop-Loss-Rate anpassen.
Strategieoptimierung
- Verschiedene Kombinationen von Moving Averages werden getestet, um die optimale Parameter zu finden.
- Verschiedene Parameter des Percentile-Kanals werden getestet, um sicherzustellen, dass die Preise in den heißen Zonen erfasst werden.
- In Kombination mit anderen Indikatoren werden Kauf- und Verkaufssignale überprüft und Falschsignale gefiltert.
- Dynamische Anpassung der Stoppdistanz.
Zusammenfassen
Diese Strategie integriert mehrere Indikatoren der Heinrichs-Mean, der Prozentkanal und der Moving Average in ein Handelssystem. Dieses System kann die Richtung der Tendenz effektiv erkennen und Stop-Losses setzen, um das Risiko zu kontrollieren. Eine quantitative Handelsstrategie, die in Betracht gezogen werden sollte.
/*backtest
start: 2023-12-17 00:00:00
end: 2023-12-24 00:00:00
period: 45m
basePeriod: 5m
exchanges: [{"eid":"Futures_Binance","currency":"BTC_USDT"}]
*/

//@version=5
strategy("HK Percentile Interpolation One",shorttitle = "HKPIO", overlay=false, default_qty_type = strategy.cash, default_qty_value = 5000, calc_on_order_fills = true, calc_on_every_tick = true)

// Input parameters
stopLossPercentage = input(3, title="Stop Loss (%)") // User can set Stop Loss as a percentage
trailStopPercentage = input(1.5, title="Trailing Stop (%)") // User can set Trailing Stop as a percentage
lookback = input.int(14, title="Lookback Period", minval=1) // User can set the lookback period for percentile calculation
yellowLine_length = input.int(5, "Yellow", minval=1) // User can set the length for Yellow EMA
purplLine_length = input.int(10, "Purple", minval=1) // User can set the length for Purple EMA
holdPeriod = input.int(200, title="Minimum Holding Period", minval=10) // User can set the minimum holding period
startDate = timestamp("2021 01 01")  // User can set the start date for the strategy

// Calculate Heikin Ashi values
haClose = ohlc4
var float haOpen = na
haOpen := na(haOpen[1]) ? (open + close) / 2 : (haOpen[1] + haClose[1]) / 2
haHigh = math.max(nz(haOpen, high), nz(haClose, high), high)
haLow = math.min(nz(haOpen, low), nz(haClose, low), low)

// Calculate Moving Averages
yellowLine = ta.ema(haClose, yellowLine_length)
purplLine = ta.ema(haClose, purplLine_length)

// Calculate 25th and 75th percentiles
p25 = ta.percentile_linear_interpolation(haClose, lookback, 28)
p75 = ta.percentile_linear_interpolation(haClose, lookback, 78)

// Generate buy/sell signals
longSignal = ta.crossover(haClose, p75) and haClose > yellowLine
sellSignal = ta.crossunder(haClose, yellowLine)
longSignal1 = ta.crossover(haClose, p75) and haClose > purplLine
sellSignal1 = ta.crossunder(haClose, purplLine)

// Set start time and trade conditions
if(time >= startDate)
    // When longSignal is true, enter a long trade and set stop loss and trailing stop conditions
    if (longSignal)
        strategy.entry("Long", strategy.long, 1)
        strategy.exit("Sell", "Long", stop=close*(1-stopLossPercentage/100), trail_points=close*trailStopPercentage/100, trail_offset=close*trailStopPercentage/100)
    // When sellSignal is true, close the long trade
    if (sellSignal)
        strategy.close("Long")
    // When sellSignal1 is true, enter a short trade
    if (sellSignal1)
        strategy.entry("Short", strategy.short, 1)
    // When longSignal1 is true, close the short trade
    if (longSignal1)
        strategy.close("Short")

// Plot Heikin Ashi candles
plotcandle(haOpen, haHigh, haLow, haClose, title="Heikin Ashi", color=(haClose >= haOpen ? color.rgb(1, 168, 6) : color.rgb(176, 0, 0)))

// Plot 25th and 75th percentile levels
plot(p25, title="25th Percentile", color=color.green, linewidth=1, style=plot.style_circles)
plot(p75, title="75th Percentile", color=color.red, linewidth=1, style=plot.style_circles)

// Plot Moving Averages
plot(yellowLine, color = color.rgb(254, 242, 73, 2), linewidth = 2, style = plot.style_stepline)
plot(purplLine, color = color.rgb(255, 77, 234, 2), linewidth = 2, style = plot.style_stepline)