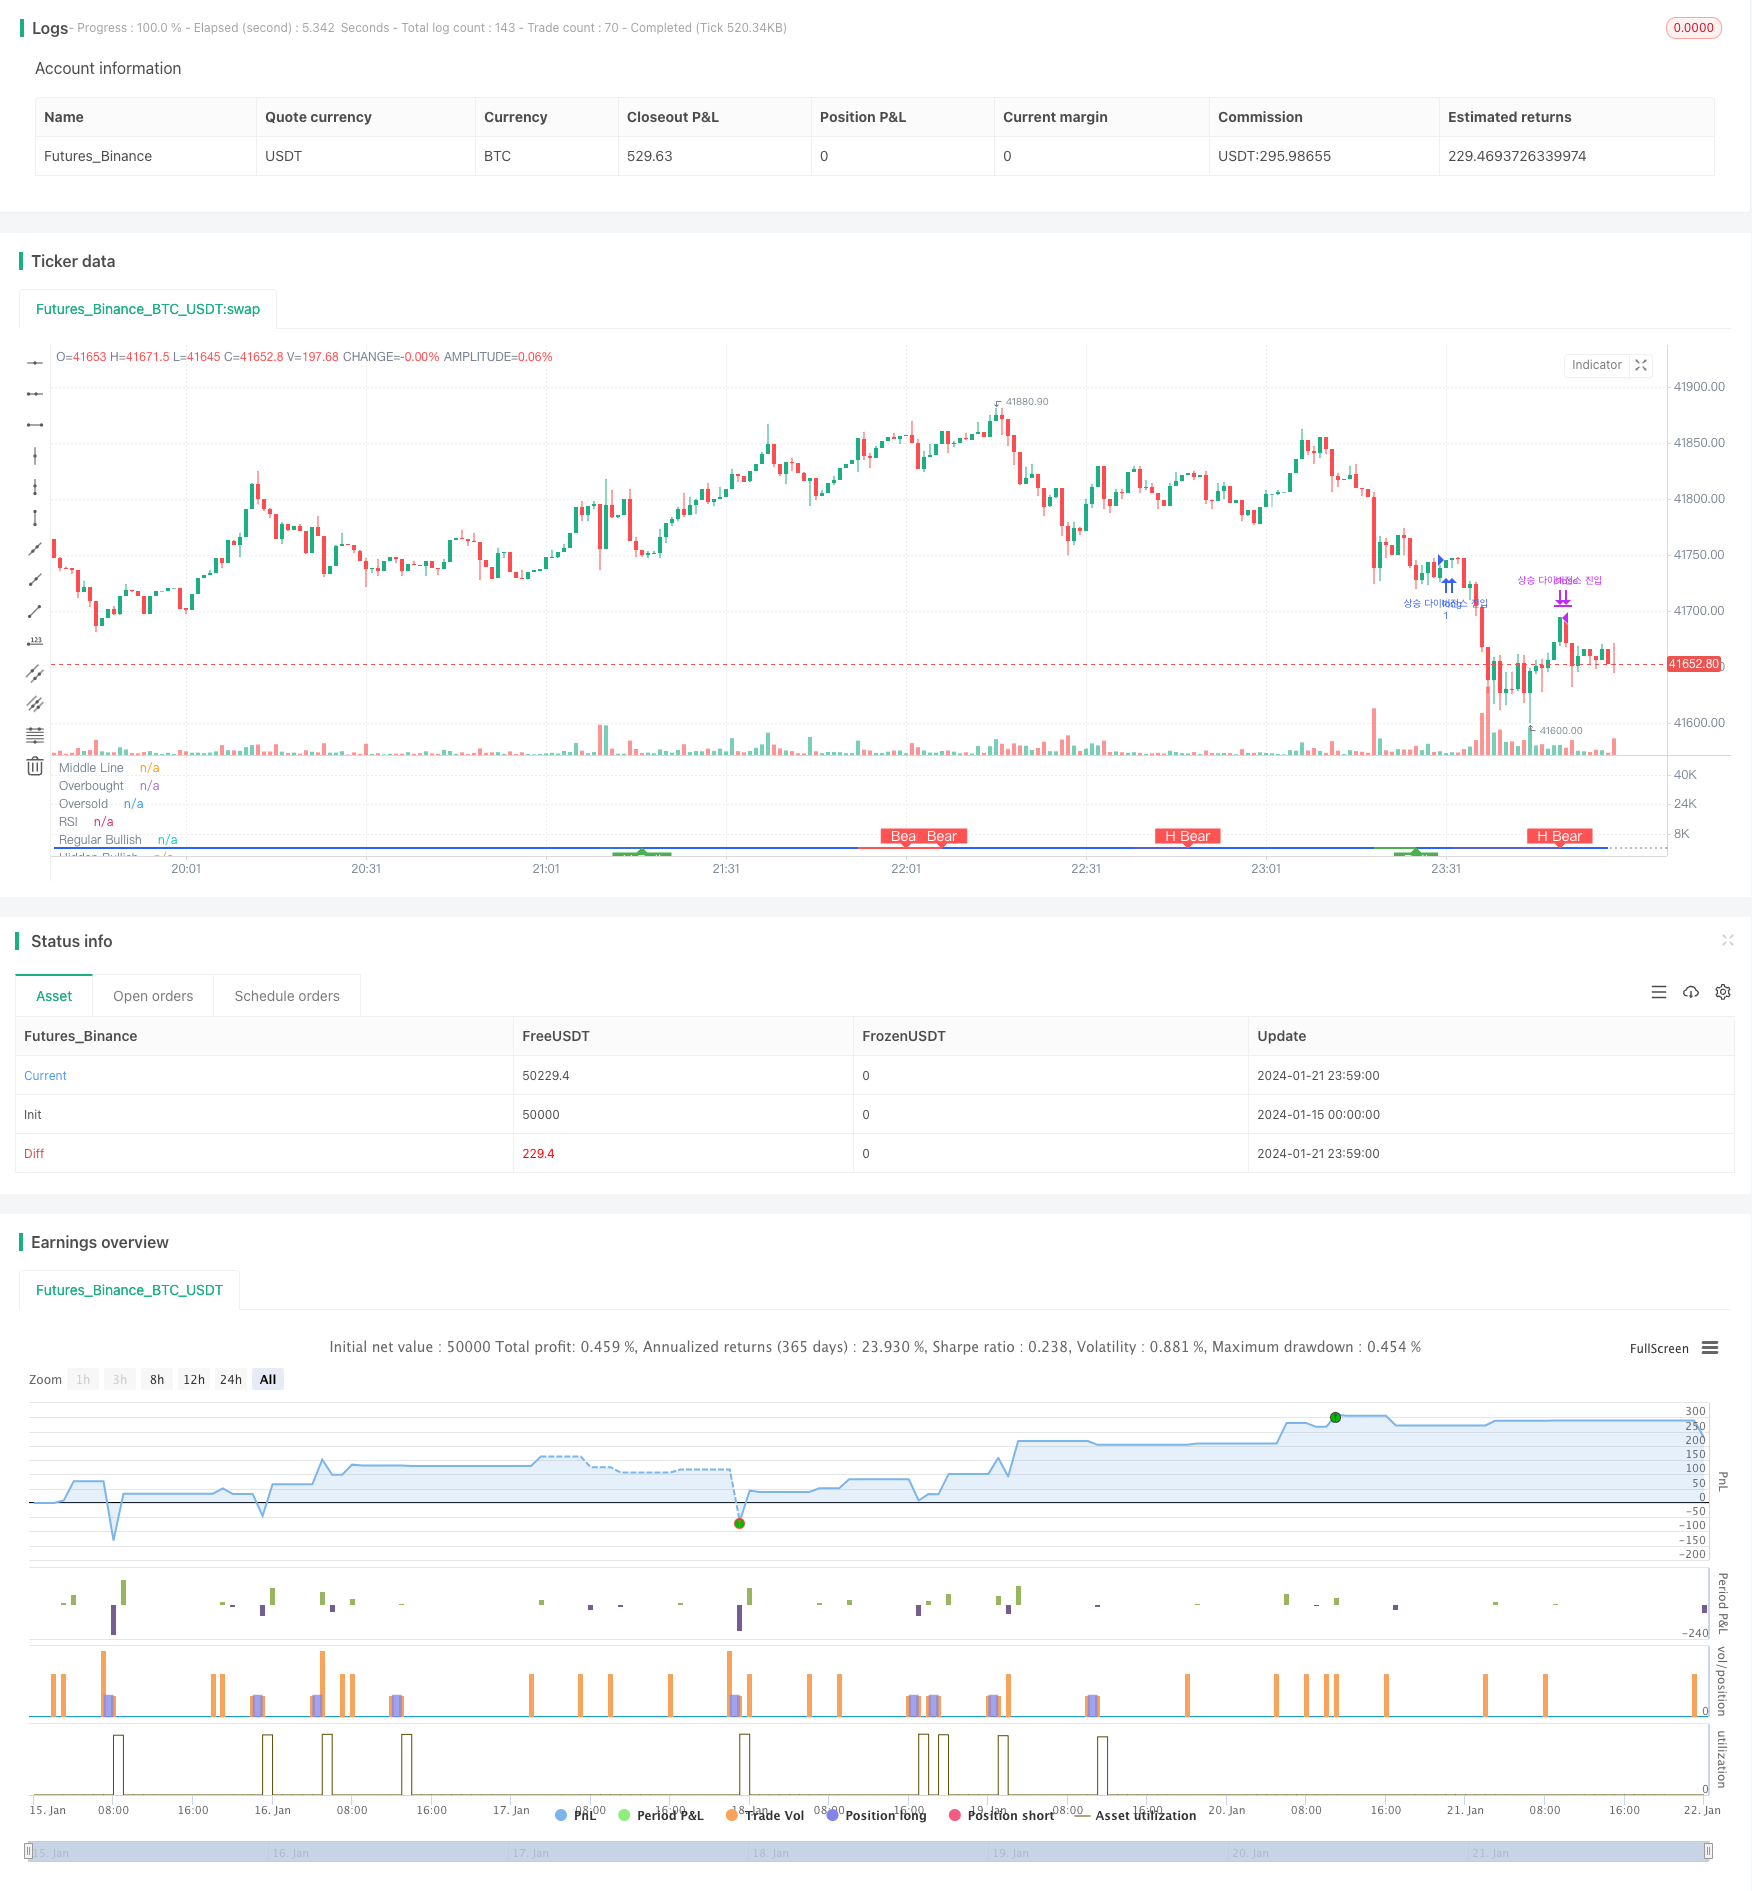
RSI-Divergenz-Handelsstrategie

Überblick
Die RSI-Divergenz-Trading-Strategie analysiert die Abweichung des RSI-Indikators vom Preis und entdeckt die Gelegenheit zur Abweichung des Wertes.
Strategieprinzip
Diese Strategie basiert auf der Abweichung zwischen dem RSI und dem Preis bei Abweichungen. Der RSI zeigt eine starke Schwäche, der Preis spiegelt die Nachfrage und die Versorgung wider. Wenn die beiden Abweichungen auftreten, zeigt dies, dass der Markt einen Fehlpreis hat.
Konkret bedeutet dies, dass der Markt, obwohl oberflächlich nach unten, tatsächlich bereits Anzeichen für eine Akkumulationsrebound hat. Die Rebound-Gelegenheit kann erfasst werden, wenn der RSI sich vom Preis abwendet und die 50-Grenze nach oben überschreitet.
Im Gegensatz zu einer normalen Abweichung von der oberflächlichen Abweichung bildet der RSI niedrigere Höhen, während der Preis höhere Höhen bildet. Dies bedeutet, dass der Markt oberflächlich optimistisch ist, aber in der Realität bereits Anzeichen von innerer Schwäche zeigt.
Darüber hinaus gibt es versteckte Mehrkopf-Differenzen und Leerkopf-Differenzen. In diesem Fall ist die Beziehung zwischen RSI und Preis die entgegengesetzte der herkömmlichen Differenzen, aber das Prinzip ist das gleiche.
Strategische Vorteile
- Es ist eine gute Idee, die Differenzen zu erfassen und Marktfehler zu erkennen.
- Die Abweichung zwischen den Kennzahlen und den Preisen erhöht die Gewinnquote
- Es gibt mehrere Möglichkeiten, unterschiedliche Situationen zu unterscheiden
Risikoanalyse
- Es gibt auch falsche Meinungsverschiedenheiten in speziellen Marktverhältnissen, die zu erkennen sind.
- Die Überschreitung der 50-Grenze ist nicht sehr hoch und kann entsprechend optimiert werden.
- Fehlentscheidungen bei der Auswahl der Multifunktionsrichtung können zu größeren Verlusten führen
Optimierungsrichtung
- Optimierung der RSI-Parameter zur Erhöhung der Prognose-Genauigkeit
- In Kombination mit anderen Indikatoren signalisiert das Urteil eine Abweichung.
- Beurteilung des Risikos von Überdeckung und Gewinnverhältnis, Kontrolle von Einzelschäden
Zusammenfassen
Die RSI-Differenzstrategie ist eine typische statistische Arbitrage-Strategie, die die Abweichung von Wert und Preis analysiert und Marktfehler feststellt. Der Vorteil der Strategie liegt in der rechtzeitigen Erkennung von Trendwendechancen, das Risiko liegt in der Genauigkeit der Differenzerkennung. Durch kontinuierliche Optimierung kann ein stabiler Gewinn in der Realität erzielt werden.
/*backtest
start: 2024-01-15 00:00:00
end: 2024-01-22 00:00:00
period: 1m
basePeriod: 1m
exchanges: [{"eid":"Futures_Binance","currency":"BTC_USDT"}]
*/

//@version=5
strategy(title="Divergence Indicator")
len = input.int(title="RSI Period", minval=1, defval=14)
src = input(title="RSI Source", defval=close)
lbR = input(title="Pivot Lookback Right", defval=5)
lbL = input(title="Pivot Lookback Left", defval=5)
rangeUpper = input(title="Max of Lookback Range", defval=60)
rangeLower = input(title="Min of Lookback Range", defval=5)
plotBull = input(title="Plot Bullish", defval=true)
plotHiddenBull = input(title="Plot Hidden Bullish", defval=true)
plotBear = input(title="Plot Bearish", defval=true)
plotHiddenBear = input(title="Plot Hidden Bearish", defval=true)
bearColor = color.red
bullColor = color.green
hiddenBullColor = color.new(color.green, 80)
hiddenBearColor = color.new(color.red, 80)
textColor = color.white
noneColor = color.new(color.white, 100)
osc = ta.rsi(src, len)

plot(osc, title="RSI", linewidth=2, color=#2962FF)
hline(50, title="Middle Line", color=#787B86, linestyle=hline.style_dotted)
obLevel = hline(70, title="Overbought", color=#787B86, linestyle=hline.style_dotted)
osLevel = hline(30, title="Oversold", color=#787B86, linestyle=hline.style_dotted)
fill(obLevel, osLevel, title="Background", color=color.rgb(33, 150, 243, 90))

plFound = na(ta.pivotlow(osc, lbL, lbR)) ? false : true
phFound = na(ta.pivothigh(osc, lbL, lbR)) ? false : true
_inRange(cond) =>
	bars = ta.barssince(cond == true)
	rangeLower <= bars and bars <= rangeUpper

//------------------------------------------------------------------------------
// Regular Bullish
// Osc: Higher Low

oscHL = osc[lbR] > ta.valuewhen(plFound, osc[lbR], 1) and _inRange(plFound[1])

// Price: Lower Low

priceLL = low[lbR] < ta.valuewhen(plFound, low[lbR], 1)
// bull : 상승 Condition : 조건
bullCond = plotBull and priceLL and oscHL and plFound // 상승다이버전스?
strategy.entry("상승 다이버전스 진입", strategy.long, when = bullCond)
strategy.close("상승 다이버전스 진입", when = ta.crossover(osc, 50))
plot(
     plFound ? osc[lbR] : na,
     offset=-lbR,
     title="Regular Bullish",
     linewidth=2,
     color=(bullCond ? bullColor : noneColor)
     )

plotshape(
	 bullCond ? osc[lbR] : na,
	 offset=-lbR,
	 title="Regular Bullish Label",
	 text=" Bull ",
	 style=shape.labelup,
	 location=location.absolute,
	 color=bullColor,
	 textcolor=textColor
	 )

//------------------------------------------------------------------------------
// Hidden Bullish
// Osc: Lower Low

oscLL = osc[lbR] < ta.valuewhen(plFound, osc[lbR], 1) and _inRange(plFound[1])

// Price: Higher Low

priceHL = low[lbR] > ta.valuewhen(plFound, low[lbR], 1)
hiddenBullCond = plotHiddenBull and priceHL and oscLL and plFound
// strategy.entry("히든 상승 다이버전스 진입", strategy.long, when = hiddenBullCond)
// strategy.close("히든 상승 다이버전스 진입", when = ta.crossover(osc, 50))
plot(
	 plFound ? osc[lbR] : na,
	 offset=-lbR,
	 title="Hidden Bullish",
	 linewidth=2,
	 color=(hiddenBullCond ? hiddenBullColor : noneColor)
	 )

plotshape(
	 hiddenBullCond ? osc[lbR] : na,
	 offset=-lbR,
	 title="Hidden Bullish Label",
	 text=" H Bull ",
	 style=shape.labelup,
	 location=location.absolute,
	 color=bullColor,
	 textcolor=textColor
	 )

//------------------------------------------------------------------------------
// Regular Bearish
// Osc: Lower High

oscLH = osc[lbR] < ta.valuewhen(phFound, osc[lbR], 1) and _inRange(phFound[1])

// Price: Higher High

priceHH = high[lbR] > ta.valuewhen(phFound, high[lbR], 1)
// bear : 하락
bearCond = plotBear and priceHH and oscLH and phFound
// strategy.entry("하락 다이버전스 진입", strategy.short, when = bearCond)
// strategy.close("하락 다이버전스 진입", when = ta.crossunder(osc, 50))
plot(
	 phFound ? osc[lbR] : na,
	 offset=-lbR,
	 title="Regular Bearish",
	 linewidth=2,
	 color=(bearCond ? bearColor : noneColor)
	 )

plotshape(
	 bearCond ? osc[lbR] : na,
	 offset=-lbR,
	 title="Regular Bearish Label",
	 text=" Bear ",
	 style=shape.labeldown,
	 location=location.absolute,
	 color=bearColor,
	 textcolor=textColor
	 )

//------------------------------------------------------------------------------
// Hidden Bearish
// Osc: Higher High

oscHH = osc[lbR] > ta.valuewhen(phFound, osc[lbR], 1) and _inRange(phFound[1])

// Price: Lower High

priceLH = high[lbR] < ta.valuewhen(phFound, high[lbR], 1)

hiddenBearCond = plotHiddenBear and priceLH and oscHH and phFound
// strategy.entry("히든 하락 다이버전스 진입", strategy.short, when = hiddenBearCond)
// strategy.close("히든 하락 다이버전스 진입", when = ta.crossunder(osc, 50))
plot(
	 phFound ? osc[lbR] : na,
	 offset=-lbR,
	 title="Hidden Bearish",
	 linewidth=2,
	 color=(hiddenBearCond ? hiddenBearColor : noneColor)
	 )

plotshape(
	 hiddenBearCond ? osc[lbR] : na,
	 offset=-lbR,
	 title="Hidden Bearish Label",
	 text=" H Bear ",
	 style=shape.labeldown,
	 location=location.absolute,
	 color=bearColor,
	 textcolor=textColor
	 )