Smiley curve for delta hedging of bitcoin options
Author: FMZ~Lydia, Created: 2023-08-16 14:53:25, Updated: 2023-09-18 20:17:37
Smiley curve for delta hedging of bitcoin options
Summary
We used a set of implied smile curves and other smile-adjusted deltas to analyze the robust dynamic delta hedges of bitcoin options. These deltas are either modelless, in a sense they are the same for each scale, random and/or local volatility models that do not change, or based on a simple system-dependent parametrized local volatility. These deltas are popular among traders in the options market for traditional assets because they are easy to implement. Actual studies on the impetus of the delta trend are based solely on the stock index interest rate duration, but also on the small historical interest rate duration.
Key wordsThese include: derivatives hedging, implied volatility curves, perpetual contracts, sound financing, and dynamic growth hedging.
1. Preface to the book
Any research on dynamic delta hedging is based on the Black and Scholes (1973) model as a benchmark. The Black-Scholes (BS) delta model only asks for the bias of the model's option price relative to the price of the benchmark, because the model assumes that the price of the benchmark is zero correlated to its volatility. However, it is well known that stock options have a large and negative price volatility correlation, resulting in a significant bias of the implied volatility curve. According to the basic idea of Bates (2005) and the more general results of Alexander and Nigelson (2007) (BS), the results can be implicitly biased to suggest a positive correction to the delta scale, which is not the same as the one proposed by the model, i.e. the same for any scale of non-variable instruments.
As Alexander and Nogueira (2007a) point out, the price-related Minimum Difference (MV) total derivative is another delta that considers non-zero price-volatility correlations, but it is model-dependent. However, these authors cannot distinguish between the empirical results obtained using Lee's 2001 modelless MV Delta and the pioneering work of Lee's 2001 modelless MV Delta based on a non-variable model of different scales. Lee's 2001 MV Delta is also a non-smile adjustment, i.e. it adds to the BBS delta a term that uses an empirical feature of the implied volatility smile curve.
Standard practice for stock options traders is to use simple model-free adjustments to hedge their risk caps against the Delta BSI, as these are considered so-called robust financing caps, i.e. hedge ratios that are unrelated to the model. Delta hedges with implicit smile curves and other smile adjustment curves are particularly popular with traders, as confirmed by numerous articles and forums. Note 2 There have been several empirical studies on delta hedges with implicit smile curves and/or smile adjustment curves, but they are all stock index options.
The purpose of this paper is to investigate the proven applications of the random fluctuation pricing model applied to various smiley implicit curves and other smiley adjustment curves in bitcoin options. The authors of this paper have considered a series of random fluctuations as a way of comparing the coin duration. At the time of writing, only a small number of studies on bitcoin options have emerged. Siu and Elliott (2021), Jalan et al. (2021) and Chen and Huang et al. (2021) have all studied the proven applications of random fluctuation pricing models, but not a single paper will investigate their hedging performance. Hou et al. (2020) have considered a series of random fluctuations as a way of comparing coin duration. Duffie et al. (2020) have considered a series of random fluctuations as a way of comparing price durations.
Unlike Matic et al. (2021), we did not compare the options hedge performance of different random volatility models. An important practical advantage of our study was that all delta values were very easy to compute. Since all information was derived directly from the volatility smile curve in a robust model-free manner, no model calibration was required.
Our focus is on short-term options with a maturity of 10 to 30 days, which have much higher liquidity and a wider range of exercise prices compared to options studied by Matic et al. (2021). We chose to do this because Bitcoin options only account for 20% of the total trading volume between one and three months of expiration, whereas on options with an expiration date of 30 days or less, Bitcoin options account for about 80% of all trading volume. In addition, we need a proper Smiley curve to adjust the Smiley range for BS Delta, which has considerable liquidity for these short-term options. In fact, the monetary validity range of the options used in our analysis varies from 0.7 to 1.3.
We only studied dynamic delta hedges that are periodically rebalanced, either every eight hours at the time of payment of funds or every day at 00:00 UTC. The choice of this experimental design is based on the characteristics of the Bitcoin options market, which are novel and will therefore be explained in detail later. The cost of trading futures is much smaller than options. For example, the price difference of futures contracts varies from about 1 to 5 basis points, depending on the expiration date, but the point of short-term parity options that are commonly used for horsepower hedging is usually around 200 to 300 basis points.
Next, Section 2 describes the market for Bitcoin options and futures; Section 3 compares and distinguishes the features of the implied volatility surface of Bitcoin and the stock index; Section 4 describes our proof framework, introducing each hedge ratio as an adjusted BS formula; Section 5 describes our data; Section 6 introduces the proof results; Section 7 summarizes.
2. Bitcoin options and futures markets
At the time of writing, there are six major cryptocurrency exchanges offering options trading in Bitcoin and other currencies, as well as some tokens, with an average daily total trading volume of nearly $1 billion in December 2021; in particular, Bitcoin options trading has recently skyrocketed to a new all-time high, with average monthly trading volume more than doubling and holdings more than sixfold from January 2020 to December 2021. The vast majority of trades are being conducted on the Derbit futures exchange, which has moved to the Panamanian currency, avoiding following international standards set by the US Commodity Futures Trading Commission (CFTC) and even any other form of regulation to protect client interests. In contrast to many other major trading platforms that typically regulate offshore contracts, the merged index is largely unregulated.
The huge volume of trading on Deribit makes it the most attractive exchange for the study of cryptocurrency options of any type; even if the CME (and some other exchanges) list only Bitcoin options, only 10%-15% of the Bitcoin option trading volume is attributed to these exchanges alone. Deribit accounts for more than 90% of the Bitcoin option trading volume. Note 7 One of these reasons may be that Deribit operates around the clock, while the CME operates only on a daily basis. Another reason may be that Deribit options are traded for the purpose of underwriting and settling Bitcoin, even if their token is the USD value of the BTC index.
Whether or not Bitcoin can exist in the traditional sense of the money market is a controversial issue (Sauer, 2016), but the highly active decentralized money market for Bitcoin (as well as other currencies and tokens) does exist in many revenue farms and different liquidity pools. Note 9 Therefore, we can convert from dollar pricing to Bitcoin in order to measure the hedging effect of any model in dollars.
Regardless of which hedging method is chosen, the hedge itself is simple. The trader opens a position in the option and establishes opposite positions in the underlying asset, with the position size equal to the delta value of the option. In the traditional market, the hedging instrument is usually a futures contract with the same maturity as the option, as the settlement price is not an instrument that is easily traded. For the BTC index, the same comment applies, as it is based on the average of the price of the token on several different exchanges.
Bitcoin options also have a hedging tool that uses contracts unique to the cryptocurrency market. These contracts, commonly known as perpetual futures, or perpetual swaps, or simply as perpetual contracts, are by far the most popular type of cryptocurrency derivatives. Their prices are closely tied to the spot price, using a perpetual cash payment mechanism to automatically pay or receive a small portion of the net position every eight hours. The calculation of this percentage, called the perpetual cash fee, is variable because exchanges pay and receive depending on whether the price of the perpetual contract is close to or very close to the spot price of the BTC.
On the world's largest cryptocurrency futures and derivatives exchange Coinbase, two-thirds of the trading products are perpetual futures contracts; by contrast, the ratio between such futures and derivatives seems to be the norm in the cryptocurrency market, as the CryptoCompare (2022) report shows. As of this writing, eight cryptocurrency exchanges report an average daily trading volume of futures exceeding $1 billion, most of which is due to perpetual contracts. Note 12 Here, unregulated exchanges such as Coinbase, OKExbit, and Bybit account for more than 65% of all futures transactions; by comparison, regulated exchanges, especially USCME and DerbitFTX together, have a much lower combined volume of trading instruments, with a combined volume of trading volume of approximately 25%; Derbit holds a market share of almost 20%; as the average annual trading volume of perpetual futures is over $4 billion, its volume data has provided a limited amount of data that will be used to track the volume of transactions in these commodities, which will be adapted to the average trading volume of all commodities in the perpetual trading sector.
Figure 1. Average daily trading volume of Deribit futures and perpetual contracts
Figure 1 shows the average daily trading volume of perpetual contracts (blue) and all other futures contracts (red) from January 2020 to January 2022. The daily trading volume is calculated based on the total number of contracts traded on Deribit in 24 hours multiplied by their nominal value of $10 and then taking the average over the past seven days. The result is given in units of $1 billion.
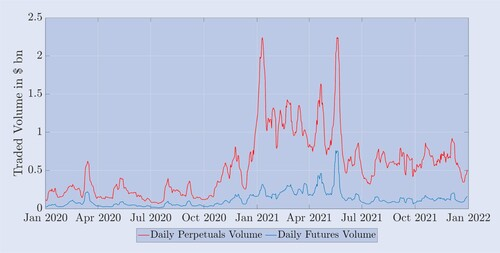
Table 1. Trading volume and unbroken contracts of Deribit Bitcoin derivatives.
3. Bitcoin has implicit volatility
Figure 2 illustrates the empirical dynamics of the implied volatility curve derived from Deribit options, mapping a two-and-a-half-year timeframe with a daily structure. The monetary axis represents the implied volatility curve from the price of a nil-value put option to the price of a nil-value put option, where the monetarity of the deep nil-value put option is 0.7, the monetarity of the deep nil-value put option is 1.3, and the monetarity of both the flat-value put option and the put option is 1, and we have plotted the data to represent the monetary levels of these at a fixed 30-day maturity. More details on the data and its filtering will be given in the next section.
Figure 2. Bitcoin has an implicit volatility curve.
The implied volatility curve for the 30-day fixed expiration of a Bitcoin option covers the daily data from January 1, 2020 to June 30, 2022, which is derived from the null and void options. The exercise price ranges from the bottom 30% of the current underlying Bitcoin index value to the top 30% of the value.
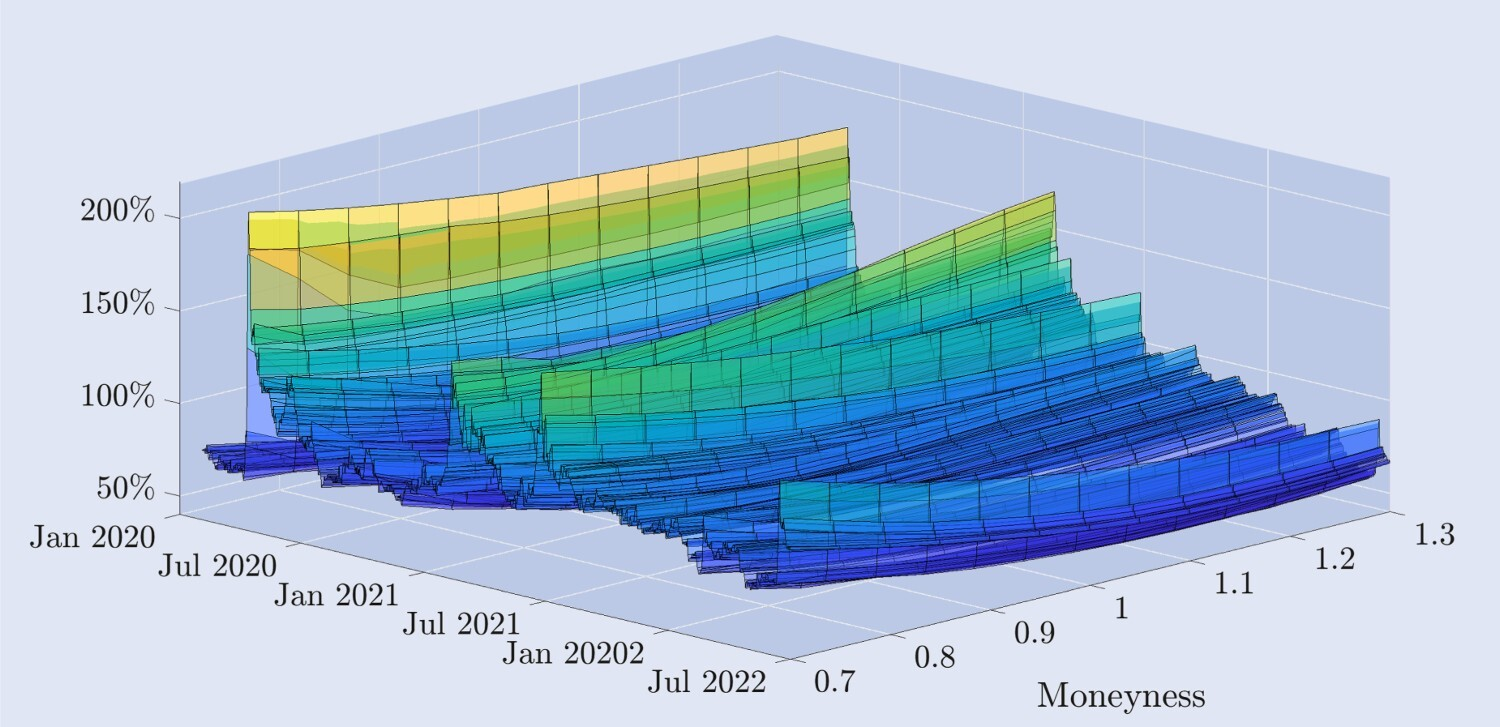
The shape of the curve varies greatly over time. For example, shortly after the March 2020 Ripple Black Thursday Ripple event, the Bitcoin price fell by more than 30% in a few hours, and the implied volatility curve took on a skewed negative shape, where a typical feature of stock index options is that the volatility of the false bear option is much higher than that of the false bear option. However, in general, the implied volatility rate of Bitcoin options is much higher than that of stock coin options. For most of the sample period, the implied volatility curve showed a slightly sloping shape of the curve of the hockey stick, where the wave waveforms became flat rather than flat, and the waveforms became a slightly sloppy one.
Figure 3. Bitcoin implies volatility and ATM bias.
The graph shows the implied volatility curve of a Bitcoin option, with a 30-day maturity, and a time range of January 1, 2020 to June 30, 2022. The curve is calculated by zero-value and zero-value options, with the range of the option's strike price falling 30% to 30% from the current value of the Bitcoin index.
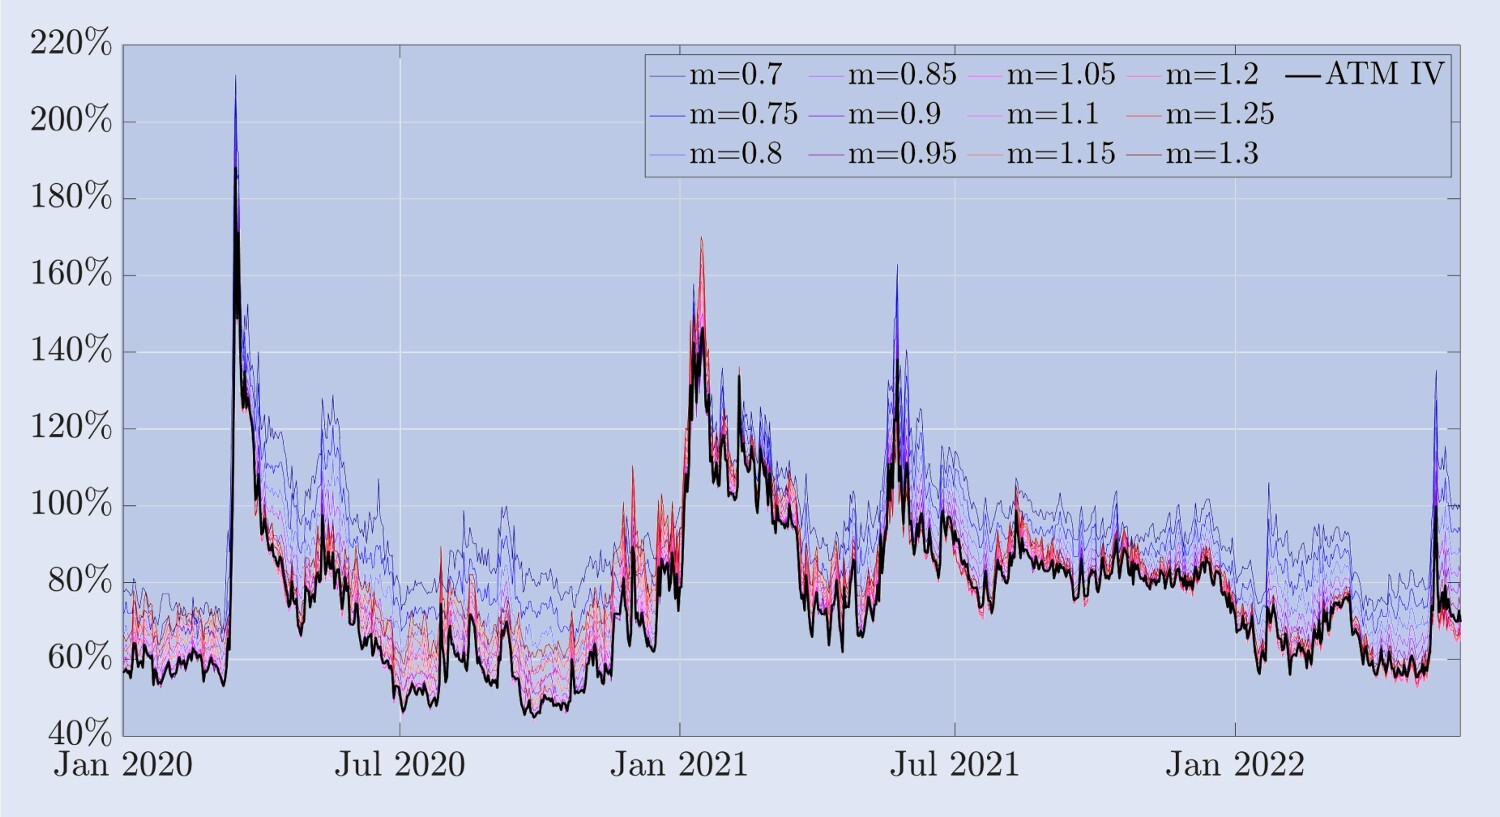
Based on our sample data, the ATM ((flat) implied volatility appears to be the lowest point on the Smiley curve and appears to be negatively skewed for most of the time. However, unlike stock index options, the Smiley curve will show a marked positive skewing during periods of high volatility. For example, during the upside of Bitcoin in June 2021, the slope of the Smiley curve increased and has been positively skewed for several months. While the correlation between the stock index price and the volatility rate is almost always large and negative, the correlation between the Bitcoin price and its implied volatility rate seems to depend on the market environment.
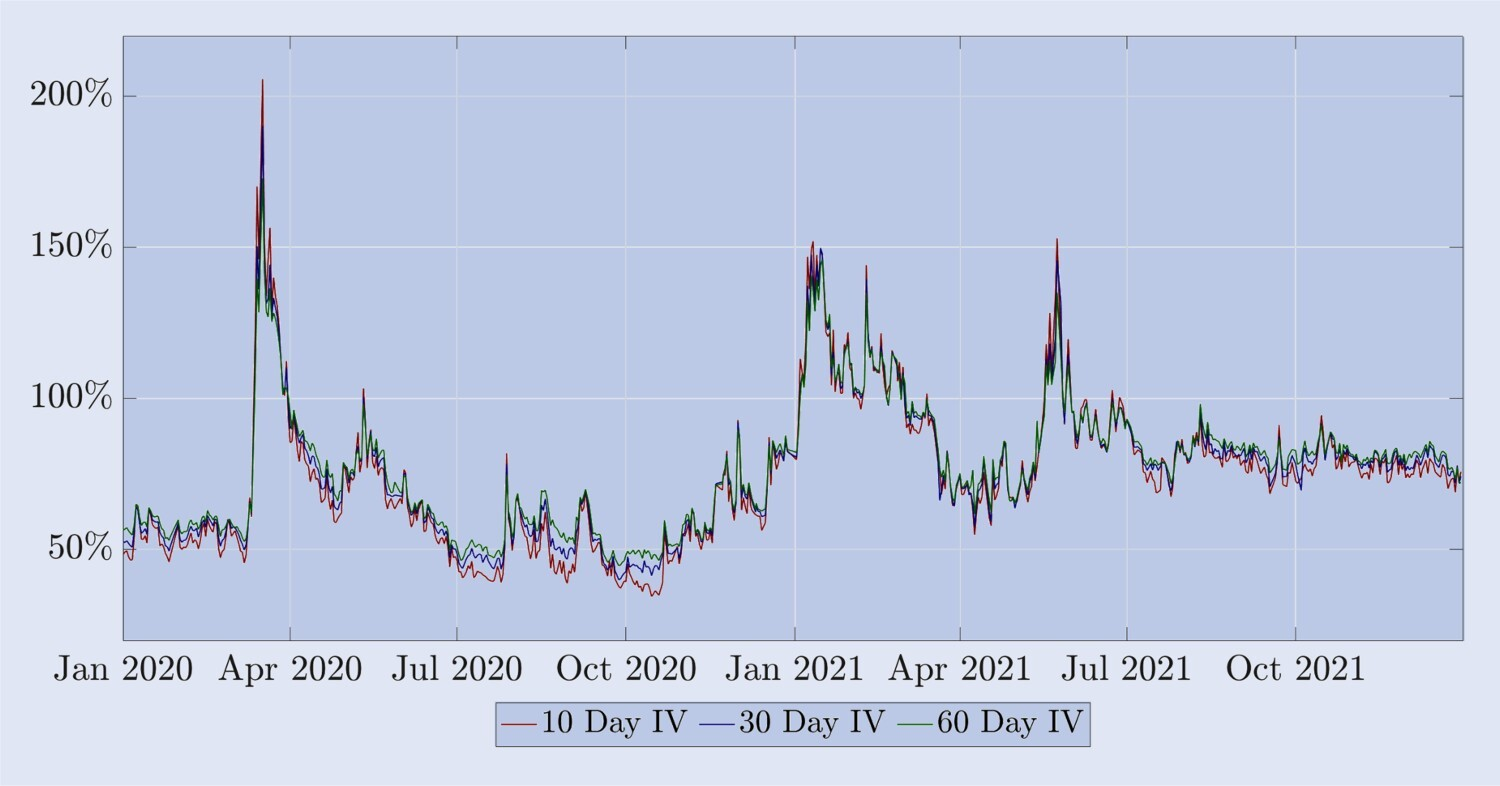
However, some features are similar to those of stock index options implied volatility: (i) volatility of different degrees of uncertainty is highly correlated with flat volatility over the same period, as shown in Figure 3; (ii) the implied volatility term structure of Bitcoin has regular fluctuations between high volatility reverse futures and relatively calm positive forward futures. Figure 4 shows that, similar to the volatility structure of the stock index, the implied volatility of Bitcoin is smaller and similar to the fluctuations during most reverse term futures.
Figure 4. The implied volatility time structure of Bitcoin.
The implied volatility time structure of Bitcoin options, including fixed expiration dates of 10, 20 and 30 days, is calculated based on the parity option calculation from January 1, 2020 to December 31, 2021. During periods of relative calm, the time structure presents positive futures, while during the crash period (especially March 2020 and June 2021), the opposite is true.
We derive the remainder of this article by using the features of bitcoin options and futures that we highlighted above. However, market makers and other professional traders are actively involved in dynamic delta hedging because the risk of the hedging option is critical to them as providers of liquidity. They can use DeltaBS to complete this hedge, but given the widespread use of the Smiley Curve by stock option traders, the study of whether this type of delta option is effective against the overbought price is significant. We have reviewed a series of literature tools that discuss the effectiveness of the Smiley Curve trading platform against the overbought price of any given stock and have studied many different types of trading strategies based on the study of the overbought price.
4. Hedge ratio
In our experimental design, we wrote a standard European option on a bitcoin index futures worth one bitcoin and hedged it by holding multiple positions of a certain number of futures contracts. T-maturing futures allow traders to enter into an agreement to buy or sell a certain number of bitcoins at a now agreed bitcoin-dollar rate at a future T time. The underlying asset of the futures and options is the Deribit Bitcoin index BTC, which is a non-tradable composite index. However, we can also use the principle of perpetual position to hedge against T-maturing options, not T-maturing futures.

Where δBS is the standard BS delta, νBS is the volatility sensitivity of the BS option price (βega), and σF=∂σ/∂F is the volatility sensitivity of the price, i.e. the implied volatility of the underlying asset changes. Although BS delta and vega have closed formulas and are easy to compute, σF is relatively difficult to quantify and there are many different methods.
The first adjustment to the BS delta we discussed is rooted in different ways of parametrizing local volatility based on the current state of the market or the underlying market mechanism. Beginning with the classic paper by Dupire (1994) and Derman et al. (1996), the concept of local volatility has been developed in a wide range of academic literature. Of particular interest here is the sticky model of the delta, which Derman (1999) advocated in the case of hedging stock index options, applying different local volatility parameters to binary tree nodes of simulated underlying asset price evolution.

where σK=∂σ/∂K represents the volatility relative to the derivative of the strike price, which should depend on the current market mechanism. In fact, Derman (1999) introduced three different sticky model waves to represent the behavior of local volatility under different market mechanisms. The sticky strike price model (SS) describes a trend market situation in which he assumes that the volatility is independent of future price movements of the underlying asset, and that it is constant and the same for each option. Under this mechanism, delta delta waves are equivalent.
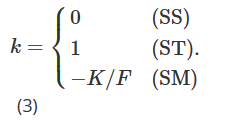
Crépey (2004) and Alexander et al. (2012) both extended the approximation formula (2) by adding state dependencies of k. At the same time, note that by combining the equations (1) and (2) of Alexander et al. (2012) with the equations (3) of Alexander and Nogueira (2007b), some algebraic operations can be performed to find that Bates (2005) implies that the smile curve, the unchanging delta of the scale, is almost identical to the sticky currency (SM) as promoted in Alexander and Nogueira (2007a).
Given the high volatility of Bitcoin, the range of available exercise prices will vary greatly over time. Therefore, in order to provide a framework for studying options with the same characteristics over longer time frames, we move from exercise prices to monetary indicators. We define monetary m as m=K/F, and now use the implicit volatility ofθ (t, tF) =σ (tK, tF) to represent the implied volatility.

We used the local volatility assumption of Derman (1999) to estimate the volatility-price sensitivityθF. The tree structure used to simulate option price evolution will also vary based on three possible market patterns: steady-trend market (SS), segment market (SM) and jump-crash market (ST). Therefore, converting the viscosity increment of Derman (1999) to a monetary measure, the value of κ in (5) should vary depending on the market pattern.
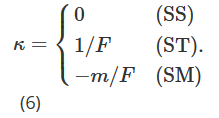
As before, Bates (2005) and Alexander and Nogueira (2007a) proposed a modelless, smiling implicit, scale-invariant delta with the same viscous currency metric (SM) delta as Derman and Kani (1994).
Next, we consider the minimal variance (MV) delta δmv, i.e. the momentary variance delta of the minimized delta hedge combination. Here, we follow an approximation introduced by Bakshi et al. (1997) that minimizes the local variance. Lee (2001) shows that this adjustment of the MV hedge ratio is the same size as the delta implicit in the SM smile, but the symbol is reversed, i.e.:

As explained in detail in Chapter 4 of Alexander (2008), other texts on implied volatility also indicate that the implied delta produces an unintuitive floating delta dynamic, which also means that the SM adjustment produced significantly worse hedging performance than the BS Delta when the volatility-price correlation is large and negative (i.e. there is a significant negative skew).
Our final smile curve adjustment delta, written as δhw, was proposed by Hull and White (in 2017) ‒ it is an empirical estimate of the secondary relationship between the absolute value of the daily PnL ΔP of the BS Delta hedge combination and the BS Delta ‒ that is:

where ΔF is the daily PnL of the futures. After using historical data to obtain the parameter estimate (aˆ, bˆ, cˆ), the Hull and White (HW) delta is calculated as follows:

where δBS and νBS represent the classic BS Delta and vega. The current price of the index is F, and its variation is ΔF, and τ represents the expiration of the option. The authors use a 36-month rolling window to calculate the estimated value (aˆ, bˆ, cˆ) and then analyze the hedging performance of HW Delta to minimize the standard deviation of the daily hedging error for 11 years starting in January 2014 for S&P 500 and other stock index options. They find that using HW Delta can improve up to 26%; other conclusions are based solely on stock index periods.
This section covers a series of simple hedging approaches to the BS Delta that have been shown to be effective in past studies of stock index options hedges and other traditional asset classes. The question now is whether they can also perform better in the Bitcoin options market than simple BS Delta hedges. The Bitcoin options market is relatively immature for the traditional options market, with its volatility and directional buying pressures being more significant, and market makers rebalancing their inventories based on information from these pressures.
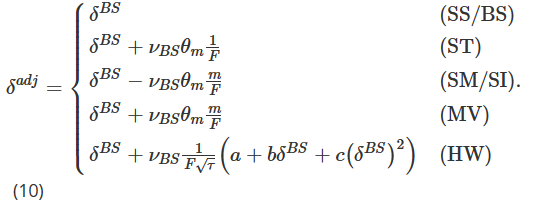
The following is an explanation of the above:
-
When m=1, i.e. in a par value option, the MV adjustment is the same as the ST adjustment; otherwise, when m>1, i.e. in a nil-value put option, the MV adjustment is larger than the ST adjustment; when m<1, i.e. in a nil-value put option, the MV adjustment is smaller than the ST adjustment;
-
The MV adjustment is always equal in size and in the opposite direction to the SM adjustment, while the SM Delta is also Alexander and Nogueira's model-free Scale-Invariant (SI) Delta (2007a), i.e. the delta of any type of random fluctuating jump in the price of a Bitcoin option;
-
The symbols for ST, SM and MV adjustments depend on the slopeθm of the implied oscillation curve. When it has a negative slope, MV and ST Delta are smaller than BS/SS Delta, while SM/SI Delta is larger than BS/SS Delta. When it has a positive slope, MV and ST Delta are larger than BS/SS Delta, and SM/SI Delta is smaller than BS/SS Delta.
5. The data
We have created a unique database by using the exchange API to obtain hourly snapshots of Deribit options market data over a period of several years. This data contains all options, futures, and perpetual contracts with one-level order book information. In this article, we only use data every eight hours and daily frequency, spanning the time span of January 1, 2020 to January 1, 2022, a total of two years.
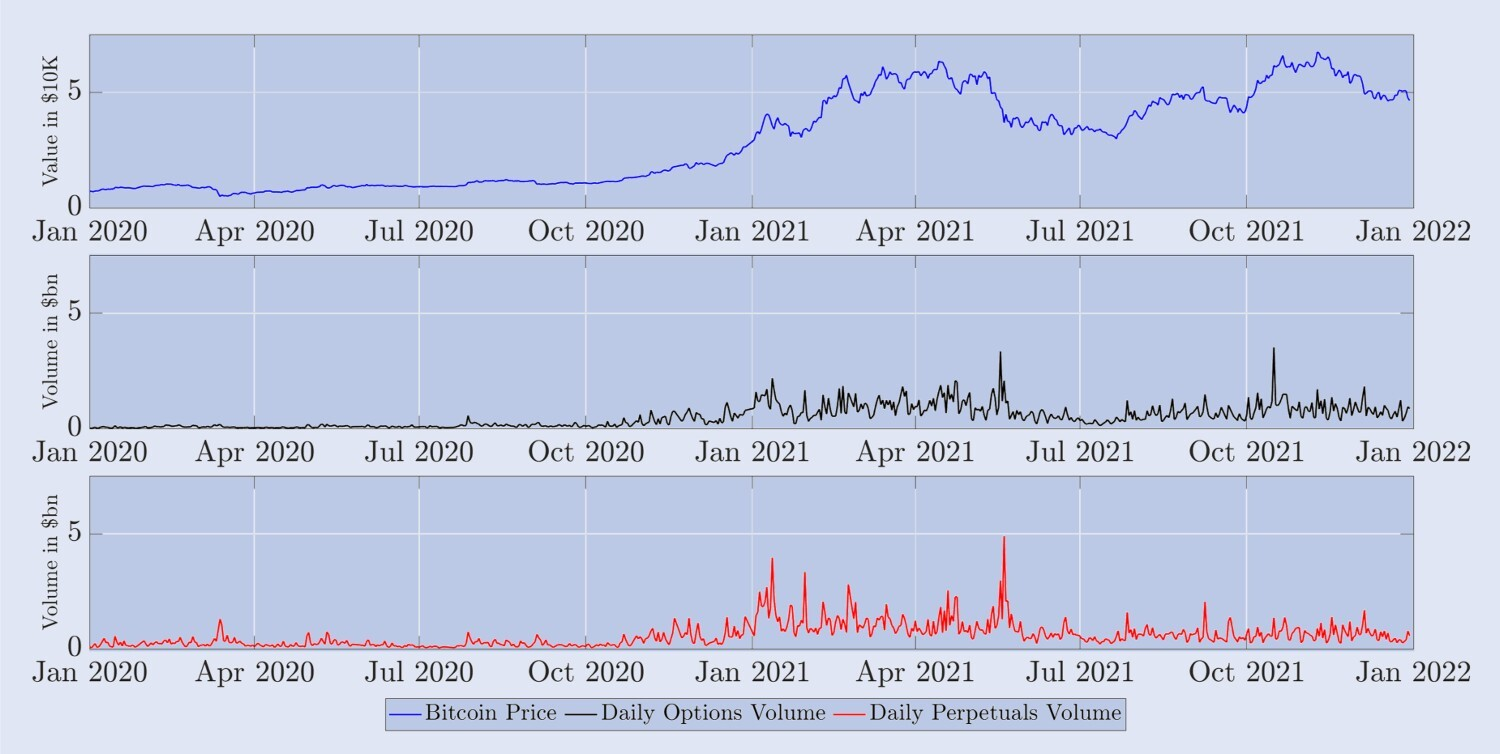
Figure 5 depicts the daily settlement price of the BTC index (i.e. the price at 00:00 UTC) and the total value of all options and perpetual contracts on Deribit in the last 24 hours (in nominal amounts, in billion dollars). The futures contracts are not included here because they are traded at a much lower volume than the perpetual contracts and options, as shown in Figure 1. During 2020, the BTC index rose relatively slowly from around $7,000 until the first major bull market that began in November 2020, and the value of all options and perpetual contracts on Deribit dropped to almost $28,000 at the end of 2020. In 2021, the total number of transactions on the index may have increased from a small volume of contracts (about $28,000) in the first half of 2020 to almost a doubling in the first half of April 2021, and then may have reached a significantly different pattern of trading.
Figure 5. BTC index evolution and daily trading volume of derivatives
The chart above shows the price of the BTC index at 00:00 UTC daily (top, blue chart) during the two-year sample period beginning on January 1, 2020; the corresponding total 24-hour trading volume of all Deribit options (center, black chart); and the daily trading volume of perpetual contracts (bottom, red chart).
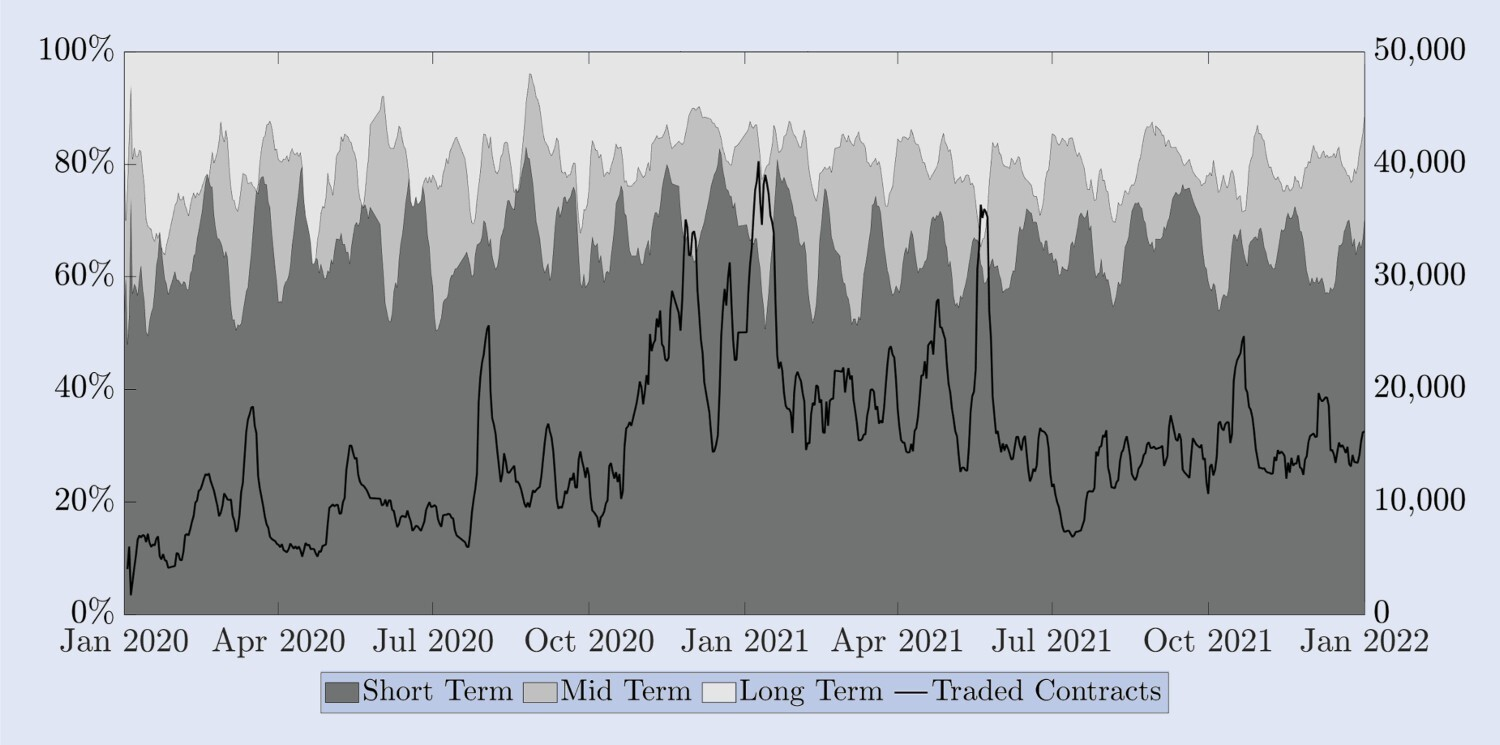
Alexander et al. (2022b) documented many differences between the Bitcoin and S&P 500 options market; one of the main differences is the approximate proportion of transactions in terms of time to time on Derbit. One of the main differences is that the real line represents the proportion of all futures contracts traded. For the sake of very clear analysis, we used the average number of weekly contracts in the S&P 500 index, which is relatively short-term, since most of the trading occurs between one month and three months of maturity. However, a one-month expiration date for a bitcoin option falls into our category of long-term options. To clarify this, Figure 6 describes the approximate proportion of transactions in terms of time to time on Derbit.
Figure 6. Expiry date of the trading option.
The left-hand margin indicates the proportion of short-term options (up to two weeks, dark gray), medium-term options (between two weeks and one month, medium gray) and long-term options (over one month, light gray) in total trading volume. The black line (right-hand margin indicates the total number of trading options contracts). All series are weekly rolling averages of daily data.
Next, we discuss data filtering. Even if we only focus on options with a one-month expiration, we still need to filter out some of the outdated prices, i.e. the option prices with zero trading volume in the last 24 hours. Liquidity is also a key issue for data on limited expiration futures contracts, as outdated futures prices can lead to errors in the delta calculation of the options. Therefore, we prefer to use the bullish-bullish parity PCP relationship to push the correct futures price, rather than calculate the market continuity price as for highly liquid perpetual contracts.
In order to obtain a continuous historical sequence of each option price, we constructed a price of a composite fixed-term contract of a given maturity and currency nature; for short-term options, the medium term is 20 days, while for longer-term options, we consider the maturity to be 30 days. Given the frequent trend changes in the price of Bitcoin, it is impossible to have the same price differential over a long period of time, so we also chose the appropriate range of monetary nature to interpolate. We found that there were enough trades within the range of about 30% below the specific bitcoin level.
First, we use the segmented three-factor Ermett polynomial, which is kept in shape, to interpolate the implied volatility smile curve to obtain a constant monetary implied volatility, under the no-interest constraint proposed by Fengler (in 2009). Next, we interpolate the volatility term structure to obtain a fixed maturity, a fixed monetary option implied volatility, and use this implied volatility to create a composite option price. To avoid any calendar arbitrage possibility, we ensure that the total implied curve increases with the maturity difference. To evaluate the hedging table next, we need to record the price of each compound option in a small incremental amount of time, without changing the price of the corresponding cross-period product. Only this framework allows us to record data on the composite power loss method.
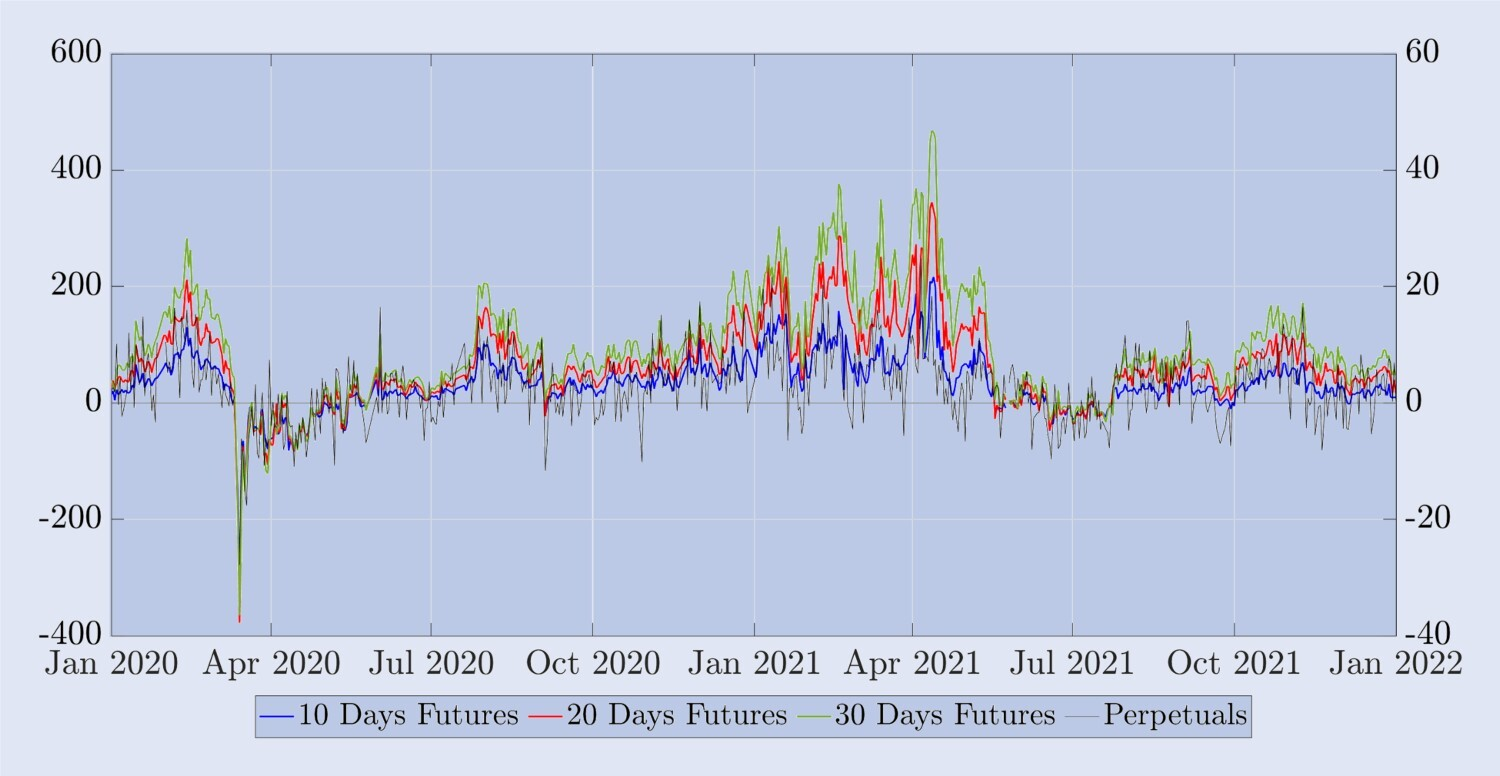
Next, before we do the hedging study, we will examine some of the empirical features of Bitcoin perpetual contracts and compare them to fixed-to-term futures. The settlement price of Bitcoin options is non-tradable contracts, so we need to use futures or perpetual contracts as a hedging instrument. In this case, the effectiveness of using futures contracts to hedge against options depends on the volatility of the spread, etc. To illustrate this volatility, Figure 7 describes the difference between the BTC index, except for BTC. This percentage difference can be seen on a positive basis.
Figure 7. Differences between spot and perpetual contracts and futures.
Futures price minus BTC index, in addition to the BTC index, expressed in basis points. The right-hand side of the scale measures the percentage of the margin of perpetual futures (black) and the left-hand side measures the percentage of the margin of futures with fixed expiry dates of 10, 20 and 30 days (blue, red and green respectively). The sample covers a two-year period starting in January 2020, with daily snapshots taken at midnight UTC.
Another factor that affects the success of a dynamic delta arbitrage strategy is the trading cost. Frequent rebalancing of delta arbitrage (in our example, not only daily, but also every 8 hours) may erode the performance of the hedge. However, for any given option, the delta value cannot vary between extreme differences, for example, the delta value of a close to flat subscription option is always close to 0.5, regardless of which model is used - see the 2004 example of Vähämaa. Therefore, only when the bid-ask spread is large, the different delta values may have a significant impact on the hedge. However, the bid-ask spread for durable commodities is very small, and even the bid-ask spread for low calendar periods is very small.
6. Evidence-based hedging
Inspired by our discussions in sections 2, 3 and 5, we will consider reverse options as ordinary vanilla forex options, i.e. the current value of the options we use to convert their bitcoin price to the corresponding dollar value. We choose to synthesize sequential futures and fixed expiry dates of the option price of 10, 20 and 30 days, with the option's monetary choice between 0.7 and 1.3. Our data is constructed to rebalance the hedge every 8 hours or every day, and the sample results span the two-year period from 1 January 2020 to 1 January 2022, and we divide it into two small sample periods showing the results of the combined balance sheet. In each time period we sell a set of continuity currencies, which typically have expiry dates of T-minutes and a record time of time with the same duration.
All of the deltas in Hull and White (2017) require us to calculate the slope of the implied volatility curve when rebalancing the hedging portfolio. We have studied various numerical techniques to calculate the derivative of the implied volatility curve and found that the three-fold polynomial is the easiest and most accurate method to use. For each option based on the slope we calculated, depending on its monetary nature and expiration date, we apply the standard formula BS delta and vega. For Hull and White (2017) delta, we did not simulate their 36-month sample in-school benchmark period, and they experimented with the stock index term.
We use the Standard F test for the user-side difference to show our results, using the BS delta as the benchmark, i.e. the Sticky Strike (SS) delta in (i.e. 10). First, Table 2 shows the result of currency hedging of 7-day, 1-day and 3-day options between 10.20 and 30.0, where each option is hedged with a corresponding fixed-maturity futures and rebalanced every 8 hours.
Table 2. F test hedge results ((8 hours rebalancing, fixed expiration futures) ).
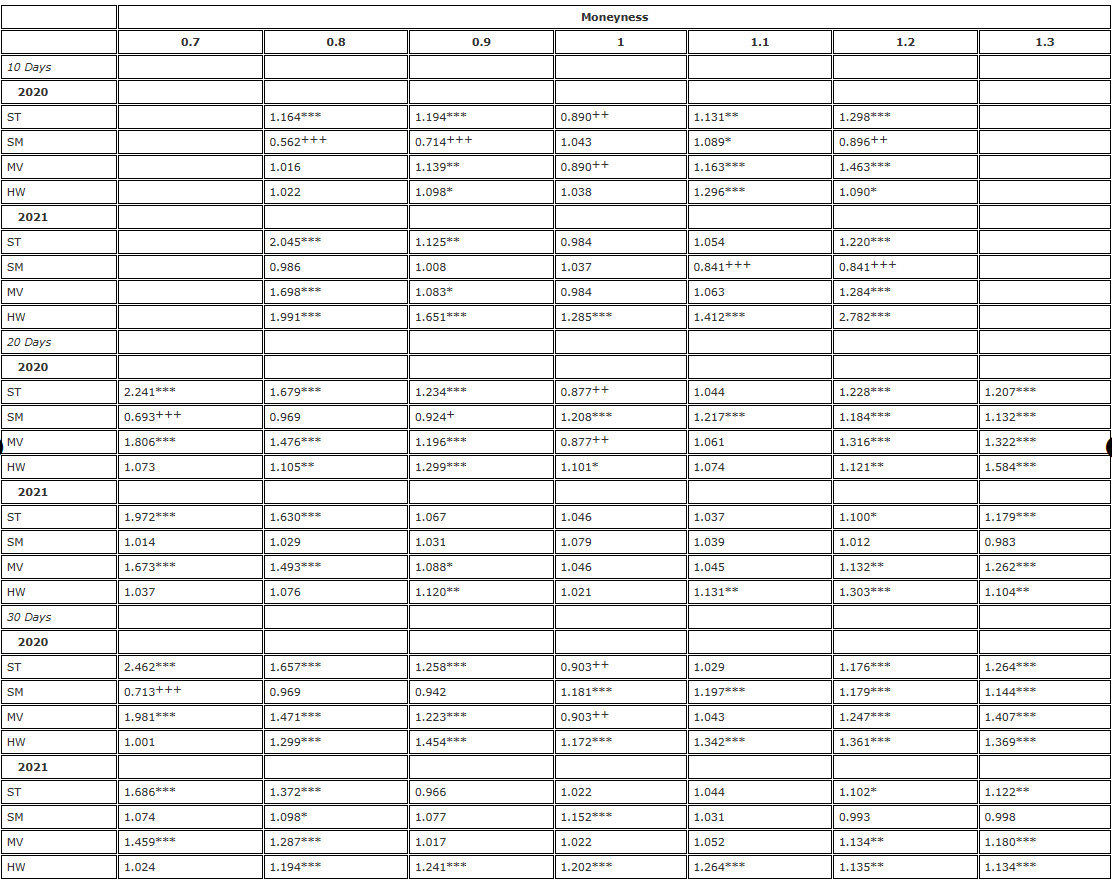
Note: The side-difference ratio and the significance level of the unilateral F-test are for the null hypothesis, respectively The alternative hypothesis
 The hedge is based on a futures contract with the same expiration date as the option, and rebalanced every 8 hours. We compare the difference in delta hedge error with the difference in delta hedge using BS and divide the two-year sample into two parts. We use three different options with different maturities, ranging from 0.7 to 1.3 in monetary value, using OTM bear options when monetary <1 and OTM see-saw options when monetary >1.
The greater the effectiveness of the hedge, the smaller the spread of the hedge error, and the efficiency gain with the adjusted smile curve delta is 1 minus this spread. For example, when hedging a 10-day option of 0.8 in monetary value, SM (implied smile) delta produces a spread of 0.562. This means that the efficiency gain is 1-0.562 = 43.8% compared to the BS delta hedge. This is very significant, so the entry is marked as +++. In the ratio table, the above indicator indicates the significance of the one-sided F test at significant levels of 10%; 5% and 1% respectively.
Considering first the 2020 results in Table 2; this part of the sample is characterized by a slow but steady rise in prices, consistent with the steady trend pattern of Derman (1999), where we expect SS delta (BS delta) to provide the most effective delta hedge, or SM delta to dominate in a limited range mode. Overall, the 2020 results in Table 2 show a pattern in which the success of a particular delta run-win-BS hedge depends on the monetarity of the option, rather than the duration. For example, for a parity option, the ST delta effect is best accompanied by note 18 Efficiency gains obtained from the 30-day parity period of 9.7% to the 20-day period of 12.3%, and again from the 10-day option of 11% are not consistent with the effectiveness of the use of TMTMTMTM and TMTMTMTM over the limited range.
- Introduction to the Lead-Lag suite in digital currency (3)
- Introduction to Lead-Lag Arbitrage in Cryptocurrency (2)
- Introduction to the Lead-Lag suite in the digital currency (2)
- Discussion on External Signal Reception of FMZ Platform: A Complete Solution for Receiving Signals with Built-in Http Service in Strategy
- Discussing FMZ platform external signal reception: a complete set of strategies for the reception of signals from built-in HTTP services
- Introduction to Lead-Lag Arbitrage in Cryptocurrency (1)
- Introduction to the Lead-Lag suite in digital currency (1)
- Discussion on External Signal Reception of FMZ Platform: Extended API VS Strategy Built-in HTTP Service
- External signal reception on FMZ platforms: extended API vs. built-in HTTP services
- Discussion on Strategy Testing Method Based on Random Ticker Generator
- Strategy testing methods based on random market generators explored
- Alternative Trading Ideas--K-line Area Trading Strategy
- Construction and application of market noise
- PSY (psychological line) factor upgrading and transformation
- High frequency trading strategy analysis - Penny Jump
- How to Measure Position Risk - An Introduction to the VaR Method
- Alternative trading ideas - K-line area trading strategies
- How to measure the risk of holding VaR
- FMZ Mobile APP Trading Terminal, empowering your quantitative trading experience
- FMZ mobile app trading terminal that empowers you to quantify your trading experience
- Analysis and instructions for use about built-in function _Cross
- Thoughts on High-Frequency Trading Strategies (5)
- Thoughts on High-Frequency Trading Strategies (4)
- Thinking about high-frequency trading strategies (5)
- Thinking about high-frequency trading strategies (4)
- Thoughts on High-Frequency Trading Strategies (3)
- Thinking about high-frequency trading strategies (3)
- Thoughts on High-Frequency Trading Strategies (2)
- Thinking about high-frequency trading strategies (2)
- Thoughts on High-Frequency Trading Strategies (1)
- Thinking about high-frequency trading strategies (1)