Strategy testing methods based on random market generators explored
Author: Inventors quantify - small dreams, Created: 2024-11-29 16:35:44, Updated: 2024-12-02 09:12:43[TOC]

The Foreword
The inventor's backtesting system is a backtesting system that is constantly updated and upgraded, from the original basic backtesting functionality, to gradually increase the functionality and optimize the performance. As the platform develops backtesting systems will continue to optimize the upgrade, today we will explore a topic based on the backtesting system: "Strategic testing based on random transactions".
The need
In the field of quantitative trading, strategy development and optimization are inseparable from the verification of real market data. However, in practical applications, due to the complexity and variability of the market environment, reliance on historical data for retrospective analysis may be insufficient, such as the lack of coverage of extreme markets or special scenarios. Therefore, designing an efficient random market generator is an effective tool for quantitative strategy developers.
When we need to have a strategy backdated to historical data on an exchange, a currency, we can use the official data source of the FMZ platform to retest it. Sometimes we also want to see how the strategy performs in a completely unfamiliar market, so we can fabricate some data to test the strategy.
Using random market data means:
-
- Evaluate the robustness of the strategy Random market generators can create a variety of possible market scenarios, including extreme volatility, low volatility, trend markets, and volatility markets. Testing a strategy in these simulated environments can help assess whether it will perform well under different market conditions.
Is the strategy adapted to trends and shocks? Is the strategy going to make a big loss in the extreme markets?
-
- Identify potential weaknesses in the strategy Potential weaknesses in the strategy can be identified and improved by simulating some of the anomalous market conditions (e.g. a hypothetical black swan event).
Is the strategy overly dependent on some market structure? Is there a risk of parameters being over-matched?
-
- Optimize policy parameters Randomly generated data provides a more varied testing environment for tweaking strategy parameters without having to rely entirely on historical data. This allows a more comprehensive range of strategy parameters to be found, avoiding being limited to specific market patterns in historical data.
-
- Insufficient historical data In some markets (e.g. emerging markets or small currency trading markets), historical data may be insufficient to cover all possible market conditions. Random market generators can provide a large amount of supplementary data to help with more comprehensive testing.
-
- Rapid iterative development Rapid testing using random data can speed up the iteration of strategy development without relying on real-time market trends or time-consuming data cleaning and sorting.
But there is also a need for a rational evaluation strategy, and for randomly generated market data, be careful:
- 1, Although a random market generator is useful, its significance depends on the quality of the data generated and the design of the target scenario:
- 2, the generating logic needs to be close to the real market: if the randomly generated market is completely detached from reality, the test results may lack reference value. For example, a generator can be designed with real market statistics features (such as volatility distribution, trend ratio) in combination.
- 3. cannot completely replace real data testing: random data can only complement the development and optimization of strategies, and the final strategy still needs to be validated in real market data.
So much to say, how can we fabricate some of the data? How can we fabricate some of the data in a convenient, fast and easy way so that the retesting system can use it?
Design ideas
This paper is designed to provide a relatively simple random market generated computation, but there are actually a variety of analog algorithms, data models and other techniques that can be used, since the discussion is limited.
In conjunction with the custom data source functionality of the platform retrieval system, we wrote a program in Python.
- 1, randomly generate a set of K-line data written to a CSV file to create a persistent record, so that the generated data can be saved.
- 2, then create a service that supports the data source of the retesting system.
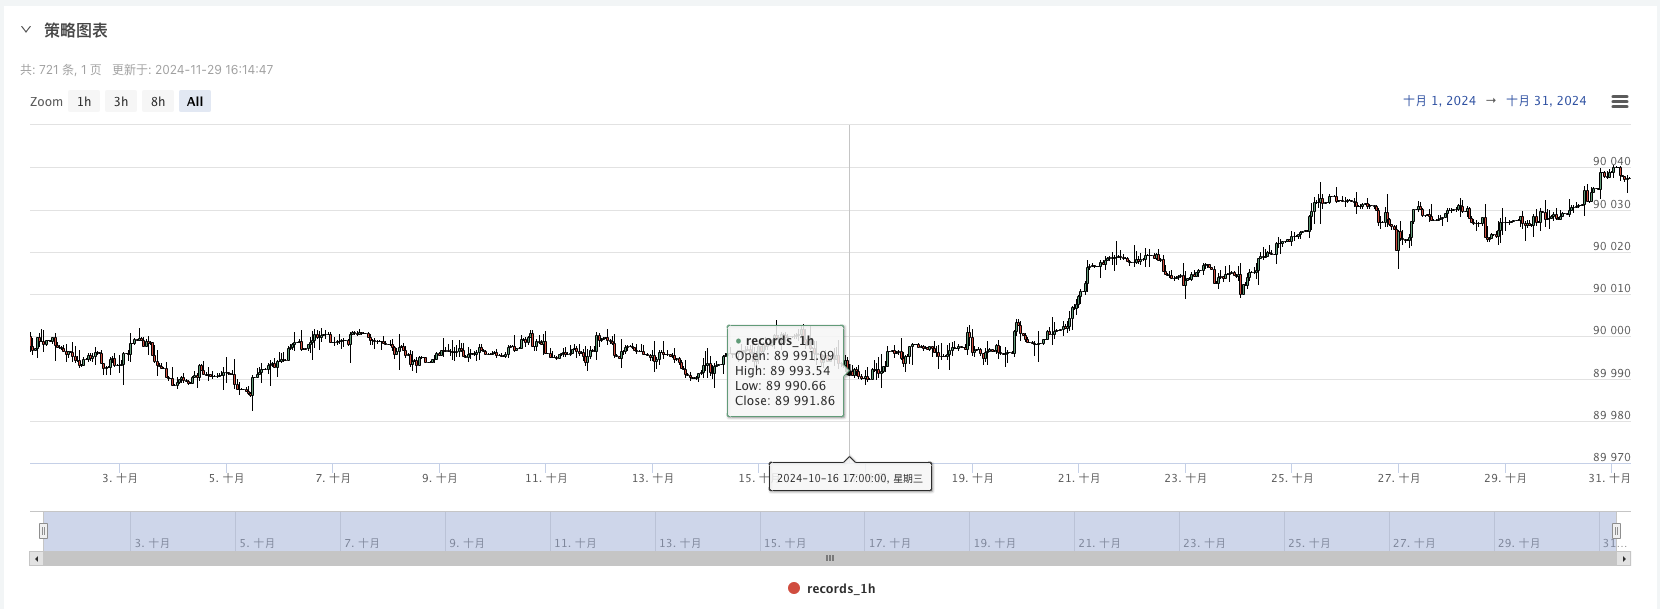
- 3, the generated K-line data is shown in the graph.
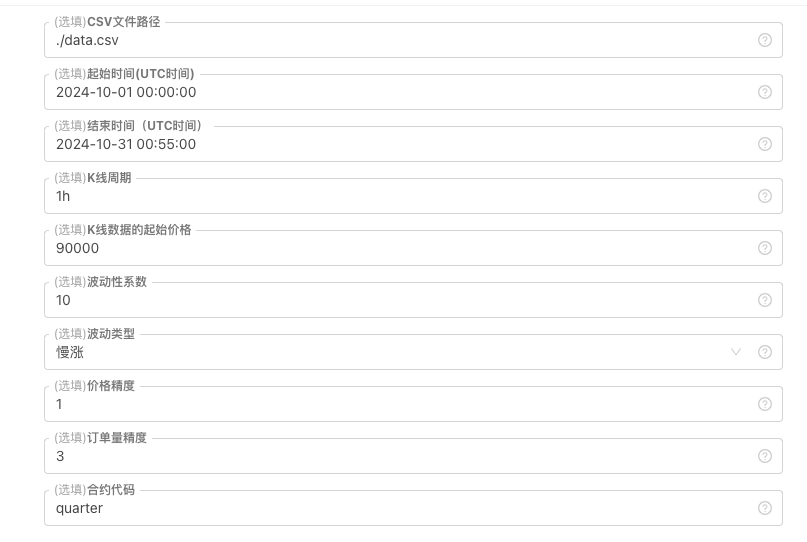
For some generating standards of K-line data, file storage, etc., the following parameter controls can be defined:

-
Patterns of randomly generated data For the fluctuation type of the K-line data, it is simply a simple design using a random number as opposed to a positive negative probability, which may not reflect the desired pattern of behavior when the data generated is small. If there is a better method, this part of the code can be replaced. Based on this simple design, adjusting the random number generating range and some coefficients in the code can affect the data effects generated.
-
Checking the data Rationality testing is also needed for the generated K-line data, to check whether the high-low charge is against the definition, to check the continuity of K-line data, etc.
Random bidding generator for the retesting system
import _thread
import json
import math
import csv
import random
import os
import datetime as dt
from http.server import HTTPServer, BaseHTTPRequestHandler
from urllib.parse import parse_qs, urlparse

arrTrendType = ["down", "slow_up", "sharp_down", "sharp_up", "narrow_range", "wide_range", "neutral_random"]

def url2Dict(url):
    query = urlparse(url).query
    params = parse_qs(query)
    result = {key: params[key][0] for key in params}
    return result

class Provider(BaseHTTPRequestHandler):
    def do_GET(self):
        global filePathForCSV, pround, vround, ct
        try:
            self.send_response(200)
            self.send_header("Content-type", "application/json")
            self.end_headers()

            dictParam = url2Dict(self.path)
            Log("自定义数据源服务接收到请求,self.path:", self.path, "query 参数:", dictParam)

            eid = dictParam["eid"]
            symbol = dictParam["symbol"]
            arrCurrency = symbol.split(".")[0].split("_")
            baseCurrency = arrCurrency[0]
            quoteCurrency = arrCurrency[1]
            fromTS = int(dictParam["from"]) * int(1000)
            toTS = int(dictParam["to"]) * int(1000)
            priceRatio = math.pow(10, int(pround))
            amountRatio = math.pow(10, int(vround))

            data = {
                "detail": {
                    "eid": eid,
                    "symbol": symbol,
                    "alias": symbol,
                    "baseCurrency": baseCurrency,
                    "quoteCurrency": quoteCurrency,
                    "marginCurrency": quoteCurrency,
                    "basePrecision": vround,
                    "quotePrecision": pround,
                    "minQty": 0.00001,
                    "maxQty": 9000,
                    "minNotional": 5,
                    "maxNotional": 9000000,
                    "priceTick": 10 ** -pround,
                    "volumeTick": 10 ** -vround,
                    "marginLevel": 10,
                    "contractType": ct
                },
                "schema" : ["time", "open", "high", "low", "close", "vol"],
                "data" : []
            }

            listDataSequence = []
            with open(filePathForCSV, "r") as f:
                reader = csv.reader(f)
                header = next(reader)
                headerIsNoneCount = 0
                if len(header) != len(data["schema"]):
                    Log("CSV文件格式有误,列数不同,请检查!", "#FF0000")
                    return
                for ele in header:
                    for i in range(len(data["schema"])):
                        if data["schema"][i] == ele or ele == "":
                            if ele == "":
                                headerIsNoneCount += 1
                            if headerIsNoneCount > 1:
                                Log("CSV文件格式有误,请检查!", "#FF0000")
                                return
                            listDataSequence.append(i)
                            break

                while True:
                    record = next(reader, -1)
                    if record == -1:
                        break
                    index = 0
                    arr = [0, 0, 0, 0, 0, 0]
                    for ele in record:
                        arr[listDataSequence[index]] = int(ele) if listDataSequence[index] == 0 else (int(float(ele) * amountRatio) if listDataSequence[index] == 5 else int(float(ele) * priceRatio))
                        index += 1
                    data["data"].append(arr)
            Log("数据data.detail:", data["detail"], "响应回测系统请求。")
            self.wfile.write(json.dumps(data).encode())
        except BaseException as e:
            Log("Provider do_GET error, e:", e)
        return

def createServer(host):
    try:
        server = HTTPServer(host, Provider)
        Log("Starting server, listen at: %s:%s" % host)
        server.serve_forever()
    except BaseException as e:
        Log("createServer error, e:", e)
        raise Exception("stop")

class KlineGenerator:
    def __init__(self, start_time, end_time, interval):
        self.start_time = dt.datetime.strptime(start_time, "%Y-%m-%d %H:%M:%S")
        self.end_time = dt.datetime.strptime(end_time, "%Y-%m-%d %H:%M:%S")
        self.interval = self._parse_interval(interval)
        self.timestamps = self._generate_time_series()

    def _parse_interval(self, interval):
        unit = interval[-1]
        value = int(interval[:-1])

        if unit == "m":
            return value * 60
        elif unit == "h":
            return value * 3600
        elif unit == "d":
            return value * 86400
        else:
            raise ValueError("不支持的K线周期,请使用 'm', 'h', 或 'd'.")

    def _generate_time_series(self):
        timestamps = []
        current_time = self.start_time
        while current_time <= self.end_time:
            timestamps.append(int(current_time.timestamp() * 1000))
            current_time += dt.timedelta(seconds=self.interval)
        return timestamps

    def generate(self, initPrice, trend_type="neutral", volatility=1):
        data = []
        current_price = initPrice
        angle = 0
        for timestamp in self.timestamps:
            angle_radians = math.radians(angle % 360)
            cos_value = math.cos(angle_radians)

            if trend_type == "down":
                upFactor = random.uniform(0, 0.5)
                change = random.uniform(-0.5, 0.5 * upFactor) * volatility * random.uniform(1, 3)
            elif trend_type == "slow_up":
                downFactor = random.uniform(0, 0.5)
                change = random.uniform(-0.5 * downFactor, 0.5) * volatility * random.uniform(1, 3)
            elif trend_type == "sharp_down":
                upFactor = random.uniform(0, 0.5)
                change = random.uniform(-10, 0.5 * upFactor) * volatility * random.uniform(1, 3)
            elif trend_type == "sharp_up":
                downFactor = random.uniform(0, 0.5)
                change = random.uniform(-0.5 * downFactor, 10) * volatility * random.uniform(1, 3)
            elif trend_type == "narrow_range":
                change = random.uniform(-0.2, 0.2) * volatility * random.uniform(1, 3)
            elif trend_type == "wide_range":
                change = random.uniform(-3, 3) * volatility * random.uniform(1, 3)
            else:
                change = random.uniform(-0.5, 0.5) * volatility * random.uniform(1, 3)

            change = change + cos_value * random.uniform(-0.2, 0.2) * volatility
            open_price = current_price
            high_price = open_price + random.uniform(0, abs(change))
            low_price = max(open_price - random.uniform(0, abs(change)), random.uniform(0, open_price))
            close_price = open_price + change if open_price + change < high_price and open_price + change > low_price else random.uniform(low_price, high_price)

            if (high_price >= open_price and open_price >= close_price and close_price >= low_price) or (high_price >= close_price and close_price >= open_price and open_price >= low_price):
                pass
            else:
                Log("异常数据:", high_price, open_price, low_price, close_price, "#FF0000")

            high_price = max(high_price, open_price, close_price)
            low_price = min(low_price, open_price, close_price)

            base_volume = random.uniform(1000, 5000)
            volume = base_volume * (1 + abs(change) * 0.2)

            kline = {
                "Time": timestamp,
                "Open": round(open_price, 2),
                "High": round(high_price, 2),
                "Low": round(low_price, 2),
                "Close": round(close_price, 2),
                "Volume": round(volume, 2),
            }
            data.append(kline)
            current_price = close_price
            angle += 1
        return data

    def save_to_csv(self, filename, data):
        with open(filename, mode="w", newline="") as csvfile:
            writer = csv.writer(csvfile)
            writer.writerow(["", "open", "high", "low", "close", "vol"])
            for idx, kline in enumerate(data):
                writer.writerow(
                    [kline["Time"], kline["Open"], kline["High"], kline["Low"], kline["Close"], kline["Volume"]]
                )

        Log("当前路径:", os.getcwd())
        with open("data.csv", "r") as file:
            lines = file.readlines()
            if len(lines) > 1:
                Log("文件写入成功,以下是文件内容的一部分:")
                Log("".join(lines[:5]))
            else:
                Log("文件写入失败,文件为空!")

def main():
    Chart({})
    LogReset(1)

    try:
        # _thread.start_new_thread(createServer, (("localhost", 9090), ))
        _thread.start_new_thread(createServer, (("0.0.0.0", 9090), ))
        Log("开启自定义数据源服务线程,数据由CSV文件提供。", ", 地址/端口:0.0.0.0:9090", "#FF0000")
    except BaseException as e:
        Log("启动自定义数据源服务失败!")
        Log("错误信息:", e)
        raise Exception("stop")

    while True:
        cmd = GetCommand()
        if cmd:
            if cmd == "createRecords":
                Log("生成器参数:", "起始时间:", startTime, "结束时间:", endTime, "K线周期:", KLinePeriod, "初始价格:", firstPrice, "波动类型:", arrTrendType[trendType], "波动性系数:", ratio)
                generator = KlineGenerator(
                    start_time=startTime,
                    end_time=endTime,
                    interval=KLinePeriod,
                )
                kline_data = generator.generate(firstPrice, trend_type=arrTrendType[trendType], volatility=ratio)
                generator.save_to_csv("data.csv", kline_data)
                ext.PlotRecords(kline_data, "%s_%s" % ("records", KLinePeriod))
        LogStatus(_D())
        Sleep(2000)
Practice in retesting systems
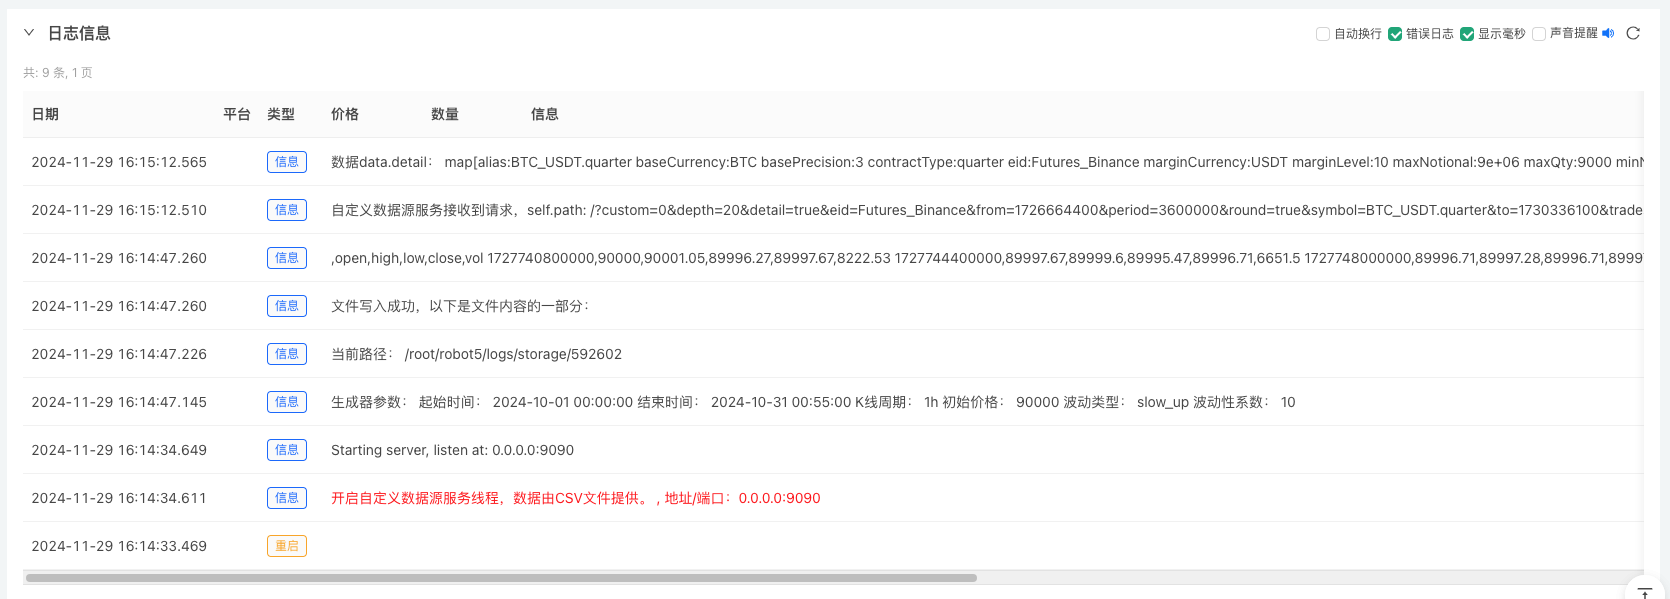
Create an instance of the above policy, configure parameters, and run it. 2, The real disk (the policy instance) needs to run on the host deployed on the server, since it needs to have a public IP to access the retrieval system to get the data. 3 Click on the interaction button and the policy will automatically start generating random market data.


4、生成好的数据会显示在图表上,方便观察,同时数据会记录在本地的data.csv文件

And then we can use this randomly generated data to do a random retest using a strategy.

/*backtest
start: 2024-10-01 08:00:00
end: 2024-10-31 08:55:00
period: 1h
basePeriod: 1h
exchanges: [{"eid":"Futures_Binance","currency":"BTC_USDT","feeder":"http://xxx.xxx.xxx.xxx:9090"}]
args: [["ContractType","quarter",358374]]
*/
This is the first time that the website has been updated.http://xxx.xxx.xxx.xxx:9090The IP address of the server and the port on which the policy is generated at random.
This is the custom data source, which can be consulted in the custom data source section of the platform API documentation.
6, the retrieval system is set up so that the data source can be used to test the random market data.


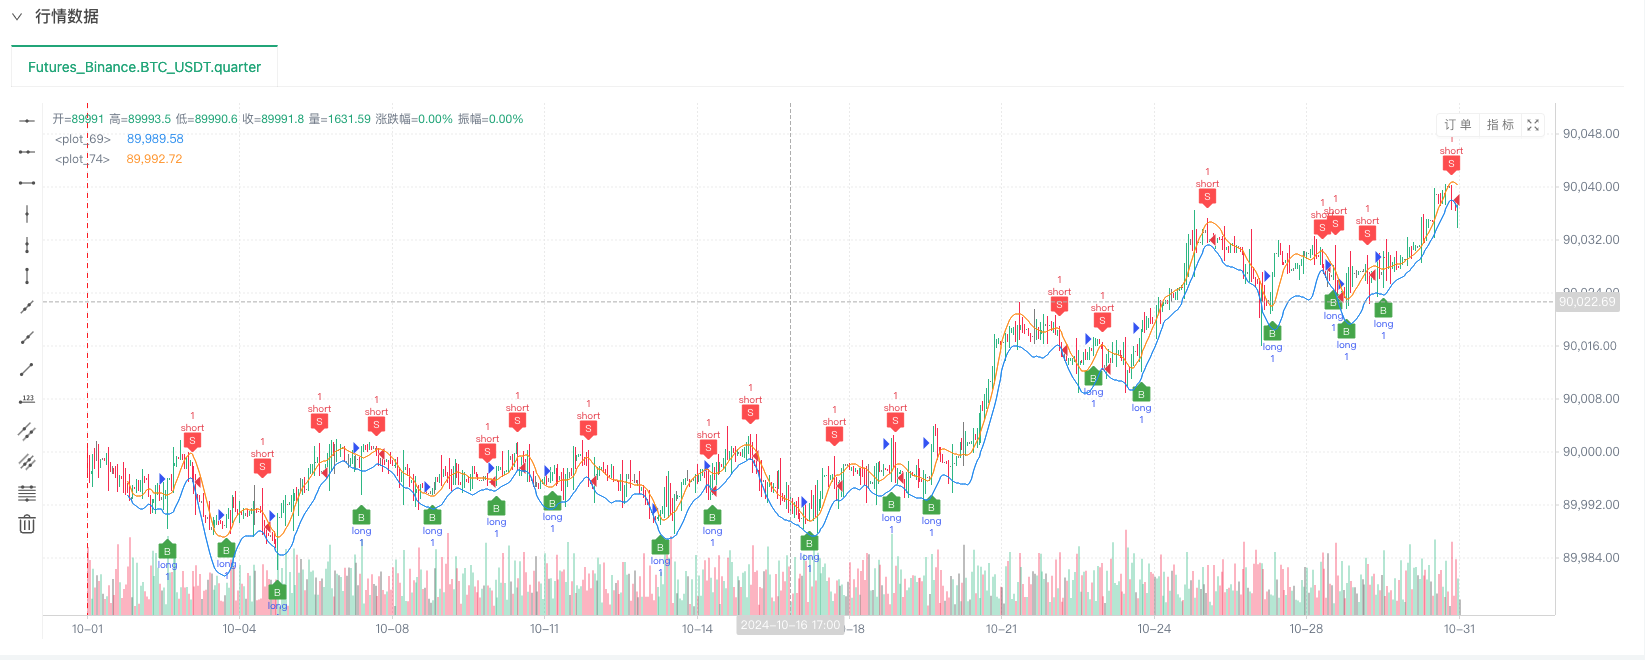
At this time, the retesting system is tested with the analog data of our reverse-engineered reverse. Based on the data in the market chart at the time of the retesting, the data is the same as the data in the random market generated real-time chart, time: October 16, 2024 at 17:00.
7, oh yes, I almost forgot to mention! This random case generator is a Python program that creates a virtual disk to facilitate the presentation, operation, and display of the generated K-line data. In actual use, it is possible to write a completely independent Python script without running a virtual disk.
The source code of the strategy:Random bidding generator for the retesting system
Thank you for your support and reading.
- Introduction to the Lead-Lag suite in digital currency (3)
- Introduction to Lead-Lag Arbitrage in Cryptocurrency (2)
- Introduction to the Lead-Lag suite in the digital currency (2)
- Discussion on External Signal Reception of FMZ Platform: A Complete Solution for Receiving Signals with Built-in Http Service in Strategy
- Discussing FMZ platform external signal reception: a complete set of strategies for the reception of signals from built-in HTTP services
- Introduction to Lead-Lag Arbitrage in Cryptocurrency (1)
- Introduction to the Lead-Lag suite in digital currency (1)
- Discussion on External Signal Reception of FMZ Platform: Extended API VS Strategy Built-in HTTP Service
- External signal reception on FMZ platforms: extended API vs. built-in HTTP services
- Discussion on Strategy Testing Method Based on Random Ticker Generator
- New Feature of FMZ Quant: Use _Serve Function to Create HTTP Services Easily
- Inventors quantify new functionality: Easily create HTTP services using the _Serve function
- FMZ Quant Trading Platform Custom Protocol Access Guide
- FMZ Funding Rate Acquisition and Monitoring Strategy
- FMZ funding rate acquisition and monitoring strategies
- A Strategy Template Allows You to Use WebSocket Market Seamlessly
- A policy template that allows you to use WebSocket seamlessly
- Inventors Quantified Exchange Platforms General Protocol Access Guide
- How to Build a Universal Multi-Currency Trading Strategy Quickly after FMZ Upgrade
- How to quickly build a universal multi-currency trading strategy after FMZ upgrade